Colombia Sports Nutrition Market Report: Trends, Growth and Forecast (2026-2032)
Product Type (Sports Protein Products (Protein/Energy Bars, Sports Protein Powder, Sports Protein RTD), Sports Non-Protein Products), Sales Channel (Retail Offline, Retail Online), Ingredients (Vitamins and Minerals, Proteins and Amino Acids, Carbohydrates, Probiotics, Botanicals/Herbals, Others), Functionality (Energy, Muscle growth, Hydration, Weight Management, Others), End User (Bodybuilders, Athletes, Lifestyle Users) ... Read more
|
Major Players
|
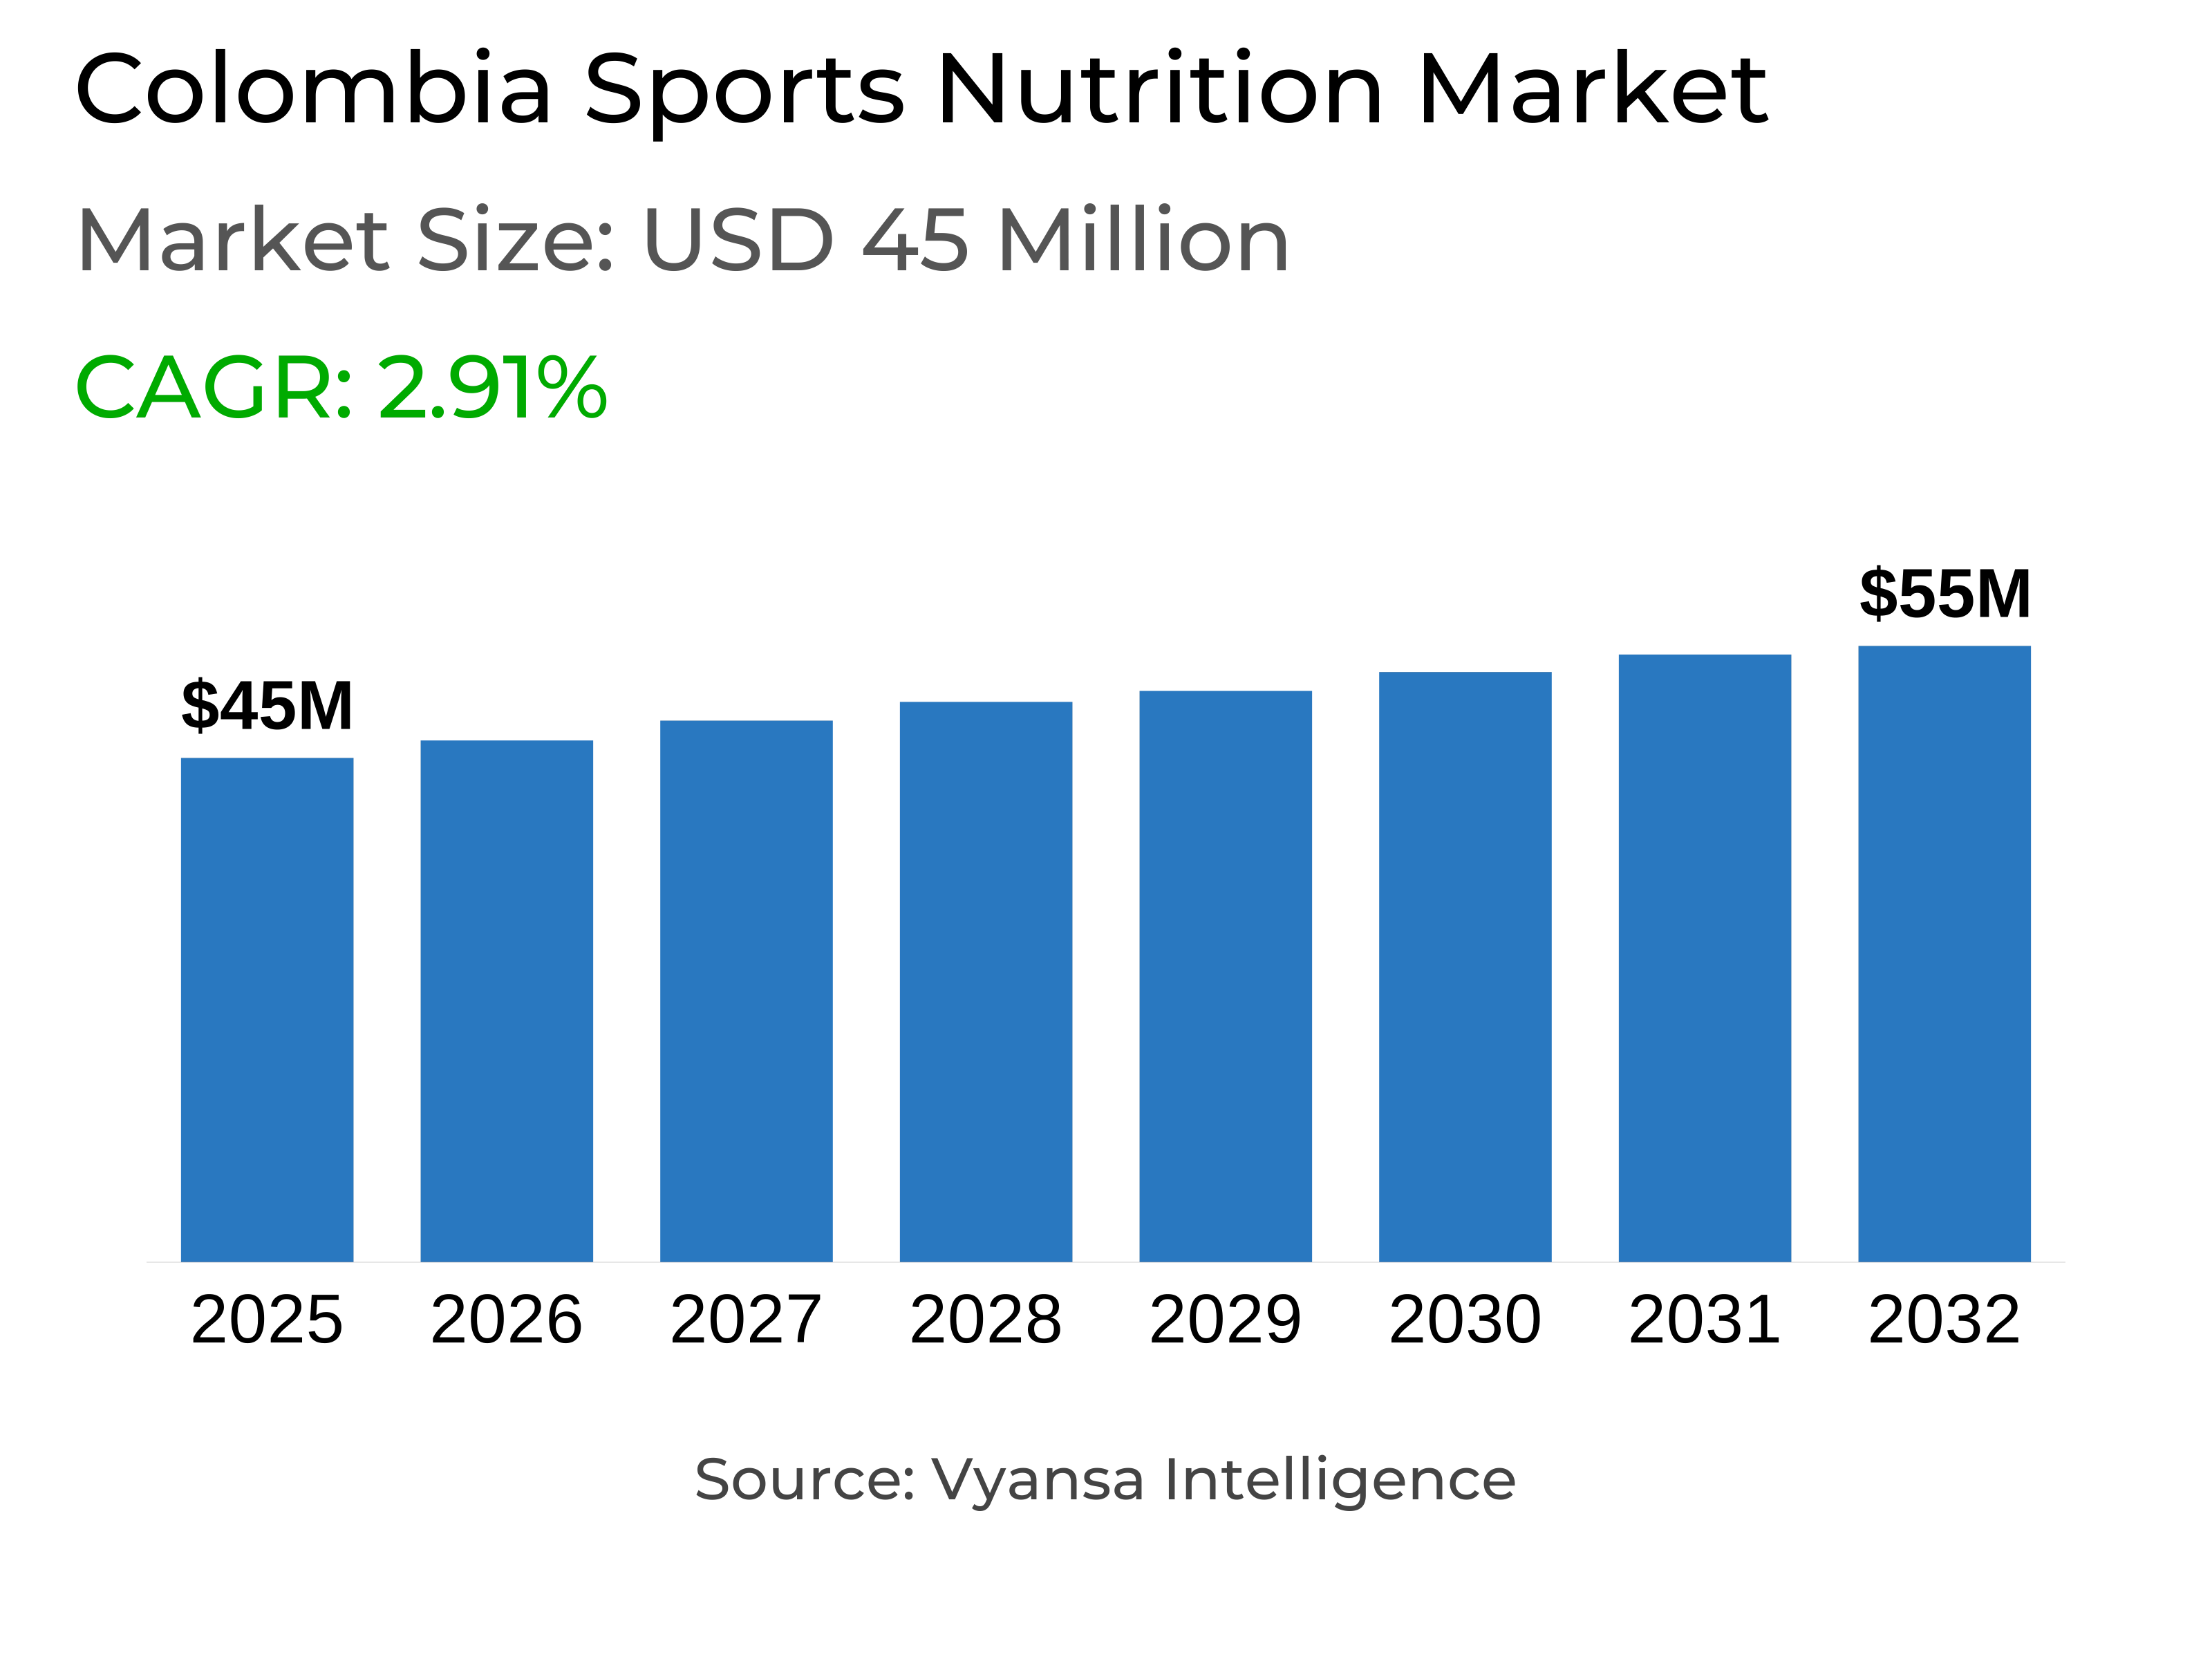
Colombia Sports Nutrition Market Statistics and Insights, 2026
- Market Size Statistics
- Sports nutrition in colombia is estimated at USD 45 million.
- The market size is expected to grow to USD 55 million by 2032.
- Market to register a cagr of around 2.91% during 2026-32.
- Product Type Shares
- Sports protein products grabbed market share of 65%.
- Competition
- More than 15 companies are actively engaged in producing sports nutrition in colombia.
- Top 5 companies acquired around 75% of the market share.
- Healthy America Colombia SAS, Gestion Cargo Zona Franca SAS, Various distributors, Sports & Science Lab SAS, Elitenut SAS etc., are few of the top companies.
- Sales Channel
- Retail offline grabbed 60% of the market.
Colombia Sports Nutrition Market Outlook
The sports nutrition market in Colombia is exhibiting steady growth,the market is valued at around USD 45 million in 2025 and is expected to reach around USD 55 million by 2032 at a CAGR of around 2.91% during the period 2026–2032. This growth is fueled by increasing gym memberships, increased access to fitness clubs, and the influence of trainers and events that encourage proper nutrition during exercise. The increasing demand for balanced diets and items that support endurance, energy, and recovery continues to shape the market positively.
Even with this consistent growth, the existence of fakes and unregistered products continues to be a cause for concern. These unauthorized sales reduce trust in official brands and expose end users to potential safety hazards. Though efforts are being made to manage such operations by authorities, the issue still continues to impact overall category performance. In order to generate long term trust, companies and regulators need to collaborate so that safe, quality, and reliable nutrition products are made accessible.
Sports protein products are the market leaders with around 65% share in sports nutrition segment, led by protein powders and growing demand for ready-to-drink and bar products. The interest in protein based products highlights their significant role in maintaining muscle recovery as well as performance goals. On the other hand, sports non-protein products like endurance and recovery supplements are slowly emerging in interest but remain secondary in volume.
Retail offline holds around 60% of the overall market, led by specialist fitness shops that offer personal advice and product knowledge. Supermarkets and hypermarkets also contribute to the segment's dominance with convenience and variety. As fitness awareness deepens and convenient product formats rise, Colombia’s sports nutrition market is expected to maintain consistent and balanced growth.

Colombia Sports Nutrition Market Growth DriverRising Adoption of Healthier Lifestyles
End users are focusing on being healthy and active, and this is increasing demand for sports nutrition products. Exercise and fitness routines are becoming regular, and products that provide energy, enhance endurance, and facilitate recovery are being used widely. Fitness centers in cities and even in small towns offer access to these products, while trainers and fitness events demonstrate how end users can include nutritions into their routine.
The expansion of gyms and flexible membership schemes makes it easier for the end users to continue exercising. As more end users learn about the benefits of nutrition during training, they include sports nutrition into their daily lives. All these combined with good health practices, better accessibility to gyms, and advice from fitness professionals sustain steady market growth.
Colombia Sports Nutrition Market ChallengeIllegality and Informal Sales Affect Sports Nutrition
Illegality and informal sales remain a serious issue for sports nutrition in Colombia. Even though authorities have worked to contain unauthorized and fake products, these products remain widely available and the problem is expected to continue. End users may buy low quality or unsafe substitutes, which reeduces confidence in legitimate products and has an impact on sales.
This not only the affects the reputation of the particular brand but also the reputation of the entire category, raising questions regarding the quality, effectiveness, and safety of sports nutrition products. The existence of these products in the market makes it difficult for the genuine brands to get full benefit from the growing interest of end users in fitness and healthy lifestyles. Ensuring that end users have access to safe, reliable, and trustworthy products is essential to support steady growth and build confidence in the market over time
Unlock Market Intelligence
Explore the market potential with our data-driven report
Colombia Sports Nutrition Market TrendIncentives by Specialist Retailers
Specialist sports nutrition product retailers are providing several incentives to end users to win over and retain them amid tight household budgets and inflationary pressures. End users are being offered loyalty schemes in which they can accumulate reward points that can be used to receive benefits like cashback, delivery fee discounts, or bonus products.
Flexible payment terms are also being launched to facilitate purchases. Some retailers are offering short term, zero interest loans that can be applied immediately at the point of purchase to buy online orders. These efforts keep end users interested in sports nutrition products and promote repeated buys. By offering rewards and convenient payments, specialist retailers are actively improving the end users shopping experience, making it easier for them to continue using sports nutrition products regularly.
Colombia Sports Nutrition Market OpportunityGrowth Potential for Convenient Sports Nutrition Formats
As lifestyles become busier, end users are likely to turn to more convenient and portable sports nutrition products in the coming years. Most people find it is time consuming to measure powder for every use, and thus ready-to-drink formats are a preferable option. They will enable the user to achieve the same nutritional benefit in a faster, simpler manner that better suits their daily lifestyle. The convenience and portability of ready-to-drink formats are most likely to increase their popularity among end users seeking nutrition without additional effort.
Although ready-to-drink products are priced higher than powders, ready-to-drink products are used primarily by middle to high income individuals. Such groups are more likely to pay extra for conveniences. Consequently, manufacturers are likely to come up with new convenient ready-to-drink products that are easy to consume, portable, and nutritionally complete, creating a strong opportunity for growth in the sports nutrition segment.
Unlock Market Intelligence
Explore the market potential with our data-driven report
Colombia Sports Nutrition Market Segmentation Analysis

By Product Type
- Sports Protein Products
- Sports Non-Protein Products
Sporting protein products lead the market, capturing around 65% of the overall market share, led primarily by sport protein powders. Protein powders remain the most preferred format among end users, supporting muscle building, recovery, and overall fitness goals. Protein/energy bars are slowly increasing their popularity, offering easy access for users requiring nutrition while on the move. Ready to consume protein products are also anticipated to increase as more end users seek out easy formats that accommodate active lifestyles. The emphasis on protein products indicates the high demand for efficient and simple solutions that enable users to reach their fitness and wellness goals.
Sports non-protein products, such as endurance and recovery supplements, are slowly increasing in popularity but are still secondary to protein products in terms of adoption. Overall, sports protein products will continue to lead the market in the years ahead.
By Sales Channel
- Retail Offline
- Retail Online
Retail offline leads the market for sports nutrition with around 60% of total sales. Specialty fitness stores dominate this category with personalized guidance, product knowledge, and a wide range of options, thereby becoming the first choice among fitness professionals and athletes. Supermarkets and hypermarkets are also responsible for retail offline sales as they offer convenience and ease of access to a larger end users base. The high presence of physical stores and the desire of end users for in-store shopping experiences make retail offline the most dominant channel in the market.
Other channels, including pharmacies and health stores, account for a smaller proportion but are consistently growing, catering to health oriented end users looking for quality assurance and professional advice in product choice. verall, offline retail remains the leading sales channel, while these additional channels complement the market and cater to niche consumer segments.
Top Companies in Colombia Sports Nutrition Market
The top companies operating in the market include Healthy America Colombia SAS, Gestion Cargo Zona Franca SAS, Various distributors, Sports & Science Lab SAS, Elitenut SAS, Omnilife Manufactura de Colombia Ltda, Newlab Nutrition Ltda, HLF Colombia Ltda, Laboratorios Funat Ltda, Green Performance SAS, etc., are the top players operating in the colombia sports nutrition market.
Frequently Asked Questions
Related Report
1. Market Segmentation
1.1. Research Scope
1.2. Research Methodology
1.3. Definitions and Assumptions
2. Executive Summary
3. Colombia Sports Nutrition Market Policies, Regulations, and Standards
4. Colombia Sports Nutrition Market Dynamics
4.1. Growth Factors
4.2. Challenges
4.3. Trends
4.4. Opportunities
5. Colombia Sports Nutrition Market Statistics, 2022-2032F
5.1. Market Size & Growth Outlook
5.1.1.By Revenues in US$ Million
5.2. Market Segmentation & Growth Outlook
5.2.1.By Product Type
5.2.1.1. Sports Protein Products- Market Insights and Forecast 2022-2032, USD Million
5.2.1.1.1. Protein/Energy Bars- Market Insights and Forecast 2022-2032, USD Million
5.2.1.1.2. Sports Protein Powder- Market Insights and Forecast 2022-2032, USD Million
5.2.1.1.3. Sports Protein RTD- Market Insights and Forecast 2022-2032, USD Million
5.2.1.2. Sports Non-Protein Products- Market Insights and Forecast 2022-2032, USD Million
5.2.2.By Sales Channel
5.2.2.1. Retail Offline- Market Insights and Forecast 2022-2032, USD Million
5.2.2.2. Retail Online- Market Insights and Forecast 2022-2032, USD Million
5.2.3.By Ingredients
5.2.3.1. Vitamins and Minerals- Market Insights and Forecast 2022-2032, USD Million
5.2.3.2. Proteins and Amino Acids- Market Insights and Forecast 2022-2032, USD Million
5.2.3.3. Carbohydrates- Market Insights and Forecast 2022-2032, USD Million
5.2.3.4. Probiotics- Market Insights and Forecast 2022-2032, USD Million
5.2.3.5. Botanicals/Herbals- Market Insights and Forecast 2022-2032, USD Million
5.2.3.6. Others- Market Insights and Forecast 2022-2032, USD Million
5.2.4.By Functionality
5.2.4.1. Energy- Market Insights and Forecast 2022-2032, USD Million
5.2.4.2. Muscle growth- Market Insights and Forecast 2022-2032, USD Million
5.2.4.3. Hydration- Market Insights and Forecast 2022-2032, USD Million
5.2.4.4. Weight Management- Market Insights and Forecast 2022-2032, USD Million
5.2.4.5. Others- Market Insights and Forecast 2022-2032, USD Million
5.2.5.By End User
5.2.5.1. Bodybuilders- Market Insights and Forecast 2022-2032, USD Million
5.2.5.2. Athletes- Market Insights and Forecast 2022-2032, USD Million
5.2.5.3. Lifestyle Users- Market Insights and Forecast 2022-2032, USD Million
5.2.6.By Competitors
5.2.6.1. Competition Characteristics
5.2.6.2. Market Share & Analysis
6. Colombia Protein Products Sports Nutrition Market Statistics, 2022-2032F
6.1. Market Size & Growth Outlook
6.1.1.By Revenues in US$ Million
6.2. Market Segmentation & Growth Outlook
6.2.1.By Sales Channel- Market Insights and Forecast 2022-2032, USD Million
6.2.2.By Ingredients- Market Insights and Forecast 2022-2032, USD Million
6.2.3.By Functionality- Market Insights and Forecast 2022-2032, USD Million
6.2.4.By End User- Market Insights and Forecast 2022-2032, USD Million
7. Colombia Non-Protein Products Sports Nutrition Market Statistics, 2022-2032F
7.1. Market Size & Growth Outlook
7.1.1.By Revenues in US$ Million
7.2. Market Segmentation & Growth Outlook
7.2.1.By Sales Channel- Market Insights and Forecast 2022-2032, USD Million
7.2.2.By Ingredients- Market Insights and Forecast 2022-2032, USD Million
7.2.3.By Functionality- Market Insights and Forecast 2022-2032, USD Million
7.2.4.By End User- Market Insights and Forecast 2022-2032, USD Million
8. Competitive Outlook
8.1. Company Profiles
8.1.1.Sports & Science Lab SAS
8.1.1.1. Business Description
8.1.1.2. Product Portfolio
8.1.1.3. Collaborations & Alliances
8.1.1.4. Recent Developments
8.1.1.5. Financial Details
8.1.1.6. Others
8.1.2.Elitenut SAS
8.1.2.1. Business Description
8.1.2.2. Product Portfolio
8.1.2.3. Collaborations & Alliances
8.1.2.4. Recent Developments
8.1.2.5. Financial Details
8.1.2.6. Others
8.1.3.Omnilife Manufactura de Colombia Ltda
8.1.3.1. Business Description
8.1.3.2. Product Portfolio
8.1.3.3. Collaborations & Alliances
8.1.3.4. Recent Developments
8.1.3.5. Financial Details
8.1.3.6. Others
8.1.4.Newlab Nutrition Ltda
8.1.4.1. Business Description
8.1.4.2. Product Portfolio
8.1.4.3. Collaborations & Alliances
8.1.4.4. Recent Developments
8.1.4.5. Financial Details
8.1.4.6. Others
8.1.5.HLF Colombia Ltda
8.1.5.1. Business Description
8.1.5.2. Product Portfolio
8.1.5.3. Collaborations & Alliances
8.1.5.4. Recent Developments
8.1.5.5. Financial Details
8.1.5.6. Others
8.1.6.Healthy America Colombia
8.1.6.1. Business Description
8.1.6.2. Product Portfolio
8.1.6.3. Collaborations & Alliances
8.1.6.4. Recent Developments
8.1.6.5. Financial Details
8.1.6.6. Others
8.1.7.SAS Gestion Cargo Zona Franca
8.1.7.1. Business Description
8.1.7.2. Product Portfolio
8.1.7.3. Collaborations & Alliances
8.1.7.4. Recent Developments
8.1.7.5. Financial Details
8.1.7.6. Others
8.1.8.SAS Various distributors
8.1.8.1. Business Description
8.1.8.2. Product Portfolio
8.1.8.3. Collaborations & Alliances
8.1.8.4. Recent Developments
8.1.8.5. Financial Details
8.1.8.6. Others
8.1.9.Laboratorios Funat Ltda
8.1.9.1. Business Description
8.1.9.2. Product Portfolio
8.1.9.3. Collaborations & Alliances
8.1.9.4. Recent Developments
8.1.9.5. Financial Details
8.1.9.6. Others
8.1.10. Green Performance SAS
8.1.10.1. Business Description
8.1.10.2. Product Portfolio
8.1.10.3. Collaborations & Alliances
8.1.10.4. Recent Developments
8.1.10.5. Financial Details
8.1.10.6. Others
9. Disclaimer
| Segment | Sub-Segment |
|---|---|
| By Product Type |
|
| By Sales Channel |
|
| By Ingredients |
|
| By Functionality |
|
| By End User |
|
Research Methodology
This study followed a structured approach comprising four key phases to assess the size and scope of the electro-oxidation market. The process began with thorough secondary research to collect data on the target market, related markets, and broader industry context. These findings, along with preliminary assumptions and estimates, were then validated through extensive primary research involving industry experts from across the value chain. To calculate the overall market size, both top-down and bottom-up methodologies were employed. Finally, market segmentation and data triangulation techniques were applied to refine and validate segment-level estimations.
Secondary Research
The secondary research phase involved gathering data from a wide range of credible and published sources. This step helped in identifying industry trends, defining market segmentation, and understanding the market landscape and value chain.
Sources consulted during this phase included:
- Company annual reports, investor presentations, and press releases
- Industry white papers and certified publications
- Trade directories and market-recognized databases
- Articles from authoritative authors and reputable journals
- Gold and silver standard websites
Secondary research was critical in mapping out the industry's value chain and monetary flow, identifying key market segments, understanding regional variations, and tracking significant industry developments.
Other key sources:
- Financial disclosures
- Industry associations and trade bodies
- News outlets and business magazines
- Academic journals and research studies
- Paid industry databases
Primary Research
To validate secondary data and gain deeper market insights, primary research was conducted with key stakeholders across both the supply and demand sides of the market.
On the demand side, participants included decision-makers and influencers from end-user industries—such as CIOs, CTOs, and CSOs—who provided first-hand perspectives on market needs, product usage, and future expectations.
On the supply side, interviews were conducted with manufacturers, industry associations, and institutional participants to gather insights into current offerings, product pipelines, and market challenges.
Primary interviews provided critical inputs such as:
- Market size and revenue data
- Product and service breakdowns
- Market forecasts
- Regional and application-specific trends
Stakeholders consulted included:
- Leading OEM and solution providers
- Channel and distribution partners
- End users across various applications
- Independent consultants and industry specialists
Market Size Estimation and Data Triangulation
- Identifying Key Market Participants (Secondary Research)
- Goal: To identify the major players or companies in the target market. This typically involves using publicly available data sources such as industry reports, market research publications, and financial statements of companies.
- Tools: Reports from firms like Gartner, Forrester, Euromonitor, Statista, IBISWorld, and others. Public financial statements, news articles, and press releases from top market players.
- Extracting Earnings of Key Market Participants
- Goal: To estimate the earnings generated from the product or service being analyzed. This step helps in understanding the revenue potential of each market player in a specific geography.
- Methods: Earnings data can be gathered from:
- Publicly available financial reports (for listed companies).
- Interviews and primary data sources from professionals, such as Directors, VPs, SVPs, etc. This is especially useful for understanding more nuanced, internal data that isn't publicly disclosed.
- Annual reports and investor presentations of key players.
- Data Collation and Development of a Relevant Data Model
- Goal: To collate inputs from both primary and secondary sources into a structured, data-driven model for market estimation. This model will incorporate key market KPIs and any independent variables relevant to the market.
- Key KPIs: These could include:
- Market size, growth rate, and demand drivers.
- Industry-specific metrics like market share, average revenue per customer (ARPC), or average deal size.
- External variables, such as economic growth rates, inflation rates, or commodity prices, that could affect the market.
- Data Modeling: Based on this data, the market forecasts are developed for the next 5 years. A combination of trend analysis, scenario modeling, and statistical regression might be used to generate projections.
- Scenario Analysis
- Goal: To test different assumptions and validate how sensitive the market is to changes in key variables (e.g., market demand, regulatory changes, technological disruptions).
- Types of Scenarios:
- Base Case: Based on current assumptions and historical data.
- Best-Case Scenario: Assuming favorable market conditions, regulatory environments, and technological advancements.
- Worst-Case Scenario: Accounting for adverse factors, such as economic downturns, stricter regulations, or unexpected disruptions.


