Chile Sports Nutrition Market Report: Trends, Growth and Forecast (2026-2032)
Product Type (Sports Protein Products (Protein/Energy Bars, Sports Protein Powder, Sports Protein RTD), Sports Non-Protein Products), Sales Channel (Retail Offline, Retail Online), Ingredients (Vitamins and Minerals, Proteins and Amino Acids, Carbohydrates, Probiotics, Botanicals/Herbals, Others), Functionality (Energy, Muscle growth, Hydration, Weight Management, Others), End User (Bodybuilders, Athletes, Lifestyle Users) ... Read more
|
Major Players
|
Chile Sports Nutrition Market Statistics and Insights, 2026
- Market Size Statistics
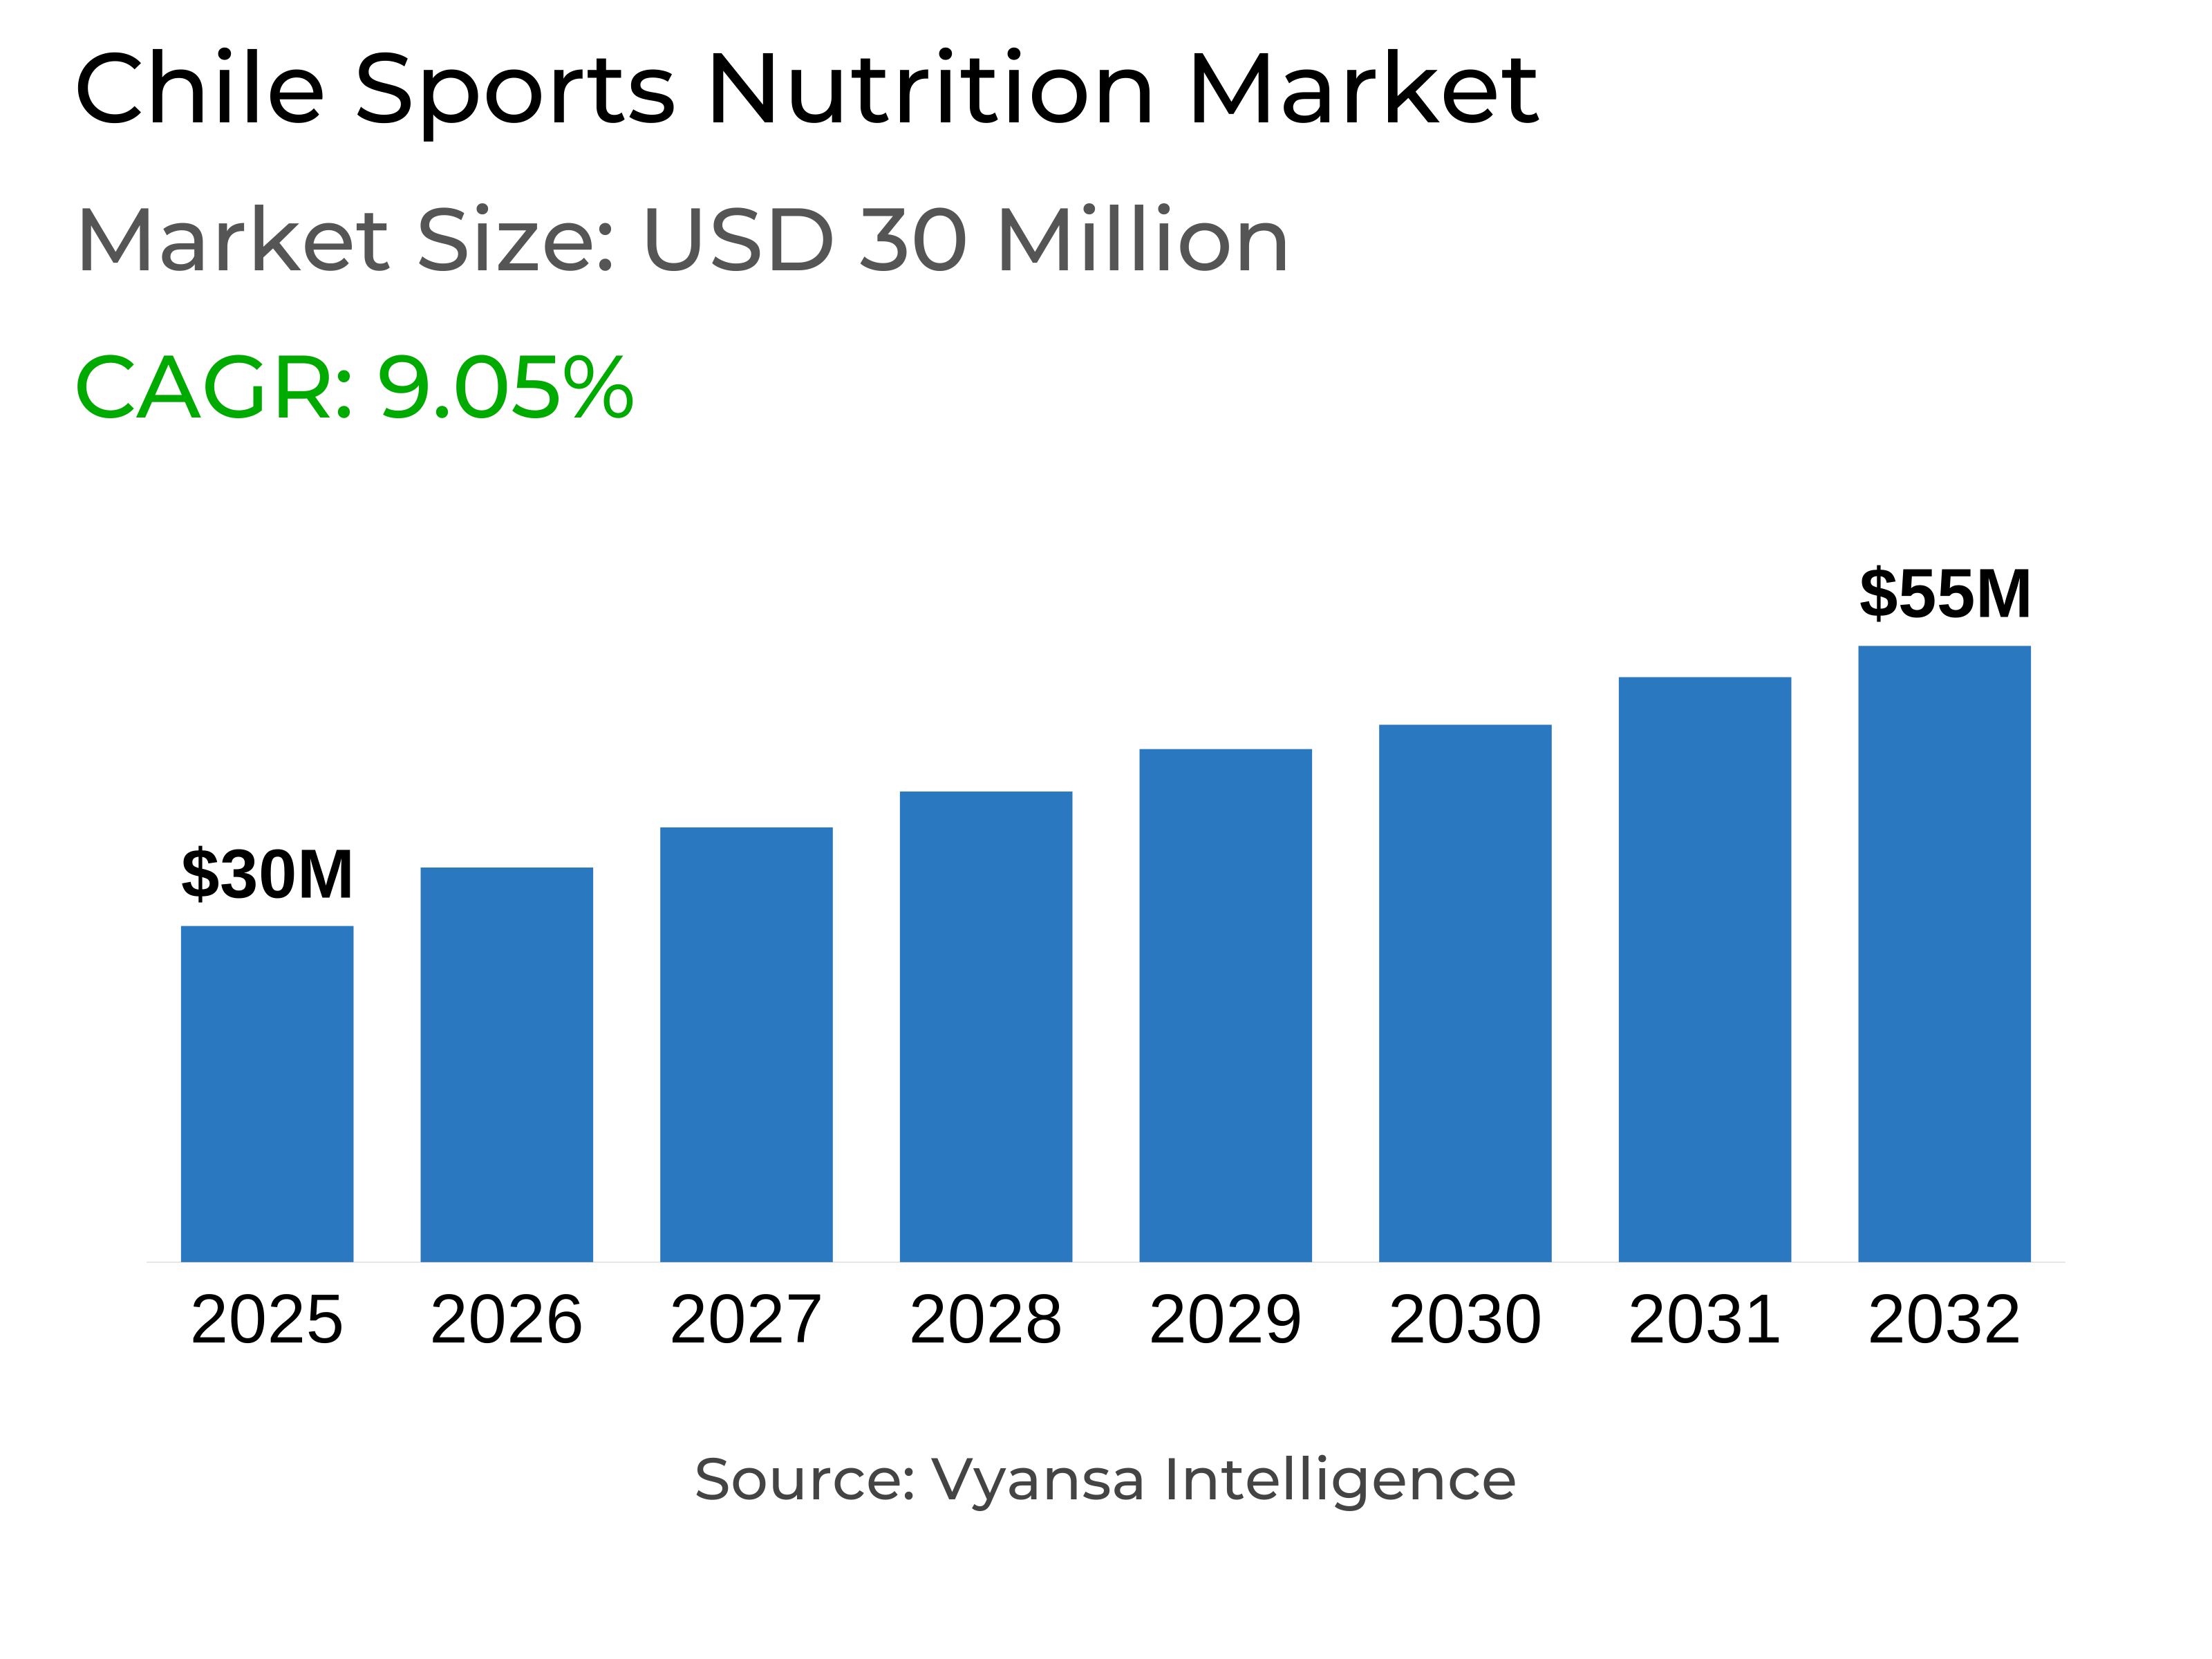
- Sports nutrition in chile is estimated at USD 30 million.
- The market size is expected to grow to USD 55 million by 2032.
- Market to register a cagr of around 9.05% during 2026-32.
- Product Type Shares
- Sports protein products grabbed market share of 70%.
- Competition
- More than 10 companies are actively engaged in producing sports nutrition in chile.
- Top 5 companies acquired around 70% of the market share.
- Orizon SA, Herbalife Chile Ltda, Omnilife de Chile SA, Soc Com NLS Nutraline Suplement Ltda, Nutrimarket SA etc., are few of the top companies.
- Sales Channel
- Retail offline grabbed 55% of the market.
Chile Sports Nutrition Market Outlook
The sports nutrition market in Chile is forecasted to reach around $30 million in 2025 and rise to around $55 million by 2032, at a CAGR of about 9.05% during 2026-32. This demand is being fueled by rising interest in wellness and daily fitness, with more end users adopting healthy living and including regular sports activity into their daily routines. Sports nutrition products are becoming integral part of daily diets among athletes and wellness oriented end users, supporting muscle growth, energy, and recovery.
Sporting protein products are the leading segment, holding about 70% market share. Protein powders and energy/protein bars remain the most popular formats because they are convenient, versatile, and very effective at addressing nutritional requirements. They continue to be at the core of the market's growth as end users value practical and high quality products for both training and overall wellbeing.
The retail offline channel has the greatest share of sales, around 55% market share. Supermarkets, pharmacies, and specialty nutrition stores remain the most popular option for end users, giving the option to inspect products in person, get expert knowledge, and make an immediate purchase. Though retail online channels are becoming more popular, retail offline is still the most popular channel for the majority of end users.
Overall, the market will grow gradually with higher adoption of plant based and convenient forms. End users are looking for ready-to-use, clean-label alternatives such as protein bars and shakes, which offer both healthy benefits and convenience. This movement along with the dominance of sports protein products and strong retail offline presence will continue the growth of the market in 2026-2032.

Chile Sports Nutrition Market Growth DriverGrowing Interest in Wellness and Everyday Fitness Fueling Demand
The demand for sports nutrition is growing with the rising interest in wellness and daily fitness. End users are incorporating physical exercise into their lifestyle and using nutritional products to enhance overall well-being. Sports nutrition is not limited to end users such as high performance sportsmen and women but has also become popular among sports enthusiasts and other end users who need a healthier lifestyle but have limited time.
Products protein/energy bars and sports protein powders are becoming preferred choices among end users because of their convenience, low fat, and easy to consume nature. The segment has become more specialized, providing multiple formats, flavors. End users nowadays research brands and ingredients and seek personalised advice before buying, highlighting the significance of health conscious and informed end users.
Chile Sports Nutrition Market ChallengeRising Raw Material Costs Placing Pressure on Market Performance
Increased raw material costs have raised production costs, resulting in noticeable price increase in many sports nutrition products. This has put pressure on manufacturers and retailers as it became hard to stay profitable without losing end users. The problem became apparent following the 2022 inflation crisis, which reduced end users spending power and made them more careful with their expenditures. Additionally, companies are struggling to keep prices affordable while protecting their profit margins.
Moreover, this increase in expenses has also been slowing down the launch of new products and innovation since most brands are now concentrating on how to control and improve efficiency.Promotional efforts have been cut down, and marketing budgets are reduced, making it difficult to win over new end users This continuous cost is restricting overall market growth and giving companies with fewer options to deal with future price hikes.
Unlock Market Intelligence
Explore the market potential with our data-driven report
Chile Sports Nutrition Market TrendIncreasing Demand for Personalised Nutrition
End users are seeking nutrition products that align with their own health and fitness objectives. They want personalised ingredients, right doses, and formats that work for them, rather than just generic products. This indicates that individuals are becoming more focused on personalised wellbeing and desire products that really align with their way of life and fitness routines.
Moreover, end users prefer professional guidance while making product choices because it helps them make smart and educated decisions for their health and performance. This shift indicates that the customers are becoming cautious, which is shaping the sports nutrition market. Brands are now encouraged to introduce more personalized products to meet the needs of these health conscious end users.
Chile Sports Nutrition Market OpportunityGrowth in Plant-Based and Convenient Sports Nutrition Products
There is increasing demand for plant-based and convenient sports nutrition products. End users are seeking healthier, easy to consume options such as protein bars, ready to drink shakes, and snacks that can be incorporated into busy daily routines. These forms are easier for individuals to incorporate protein and other nutrients into their diet, thus aiding in maintaining muscle, recovery, and well-being without being utterly dependent on powders or capsules. Further, their convenience and mobility make them particularly attractive for active individuals with less time spent on meal preparation.
Moreover, plant based formulations add additional appeal by attracting end users who value natural, sustainable ingredients. By offering clean label products with basic, familiar ingredients, companies can successfully target athletes and wellness oriented end users. In turn, this enables sports nutrition products to penetrate further, create more occasions of consumption, and strenthen the development of traditional protein based foods in the market.
Unlock Market Intelligence
Explore the market potential with our data-driven report
Chile Sports Nutrition Market Segmentation Analysis

By Product Type
- Sports Protein Products
- Sports Non-Protein Products
Sports proteins lead the market and represent around 70% of all sports nutrition sales. This include sports protein powders and protein/energy bars, which are the most popular format choices among end users because they offer effectiveness in supporting muscle maintenance, recovery, and energy. Protein powders lead the category, with bars following, which is driven by high demand for versatile and convenient sources of protein.
Moreover, ready-to-drink protein products have not yet achieved meaningful traction but hold potential for future growth in this category. The dominance of sports protein products indicates the role of these products in the overall sports nutrition market. End users continue to favor these products for training and overall wellness, positioning protein products as the prime segment driving market growth and innovation.
By Sales Channel
- Retail Offline
- Retail Online
The retail offline channel is the largest in the segment for sports nutrition, holding around 55% share of the market. Sports protein products account for the majority of sales, covering powders and bars, which are the most favored among end users. Physical outlets such as supermarkets, pharmacies, and specialty nutrition stores continue to be favored since end users can inspect products, consult with staff, and purchase instantly without ordering for home delivery. These reasons make the offline channel one of the primary drivers of the market's performance.
The retail online channel is growing, particularly among young end users, yet the retail offline channel remains the preferred option. Its convenience, reliability, and one-to-one interaction make it a popular choice. This channel is likely to maintain its robust position, supporting steady sales and fueling the development of sports protein products.
Top Companies in Chile Sports Nutrition Market
The top companies operating in the market include Orizon SA, Herbalife Chile Ltda, Omnilife de Chile SA, Soc Com NLS Nutraline Suplement Ltda, Nutrimarket SA, Cía de Nutrición General SA, Importadora Universal Nutrition Chile Ltda, Socofar SA, Amway Chile SA, Comercializadora Novaverde SA, etc., are the top players operating in the chile sports nutrition market.
Frequently Asked Questions
Related Report
1. Market Segmentation
1.1. Research Scope
1.2. Research Methodology
1.3. Definitions and Assumptions
2. Executive Summary
3. Chile Sports Nutrition Market Policies, Regulations, and Standards
4. Chile Sports Nutrition Market Dynamics
4.1. Growth Factors
4.2. Challenges
4.3. Trends
4.4. Opportunities
5. Chile Sports Nutrition Market Statistics, 2022-2032F
5.1. Market Size & Growth Outlook
5.1.1.By Revenues in US$ Million
5.2. Market Segmentation & Growth Outlook
5.2.1.By Product Type
5.2.1.1. Sports Protein Products- Market Insights and Forecast 2022-2032, USD Million
5.2.1.1.1. Protein/Energy Bars- Market Insights and Forecast 2022-2032, USD Million
5.2.1.1.2. Sports Protein Powder- Market Insights and Forecast 2022-2032, USD Million
5.2.1.1.3. Sports Protein RTD- Market Insights and Forecast 2022-2032, USD Million
5.2.1.2. Sports Non-Protein Products- Market Insights and Forecast 2022-2032, USD Million
5.2.2.By Sales Channel
5.2.2.1. Retail Offline- Market Insights and Forecast 2022-2032, USD Million
5.2.2.2. Retail Online- Market Insights and Forecast 2022-2032, USD Million
5.2.3.By Ingredients
5.2.3.1. Vitamins and Minerals- Market Insights and Forecast 2022-2032, USD Million
5.2.3.2. Proteins and Amino Acids- Market Insights and Forecast 2022-2032, USD Million
5.2.3.3. Carbohydrates- Market Insights and Forecast 2022-2032, USD Million
5.2.3.4. Probiotics- Market Insights and Forecast 2022-2032, USD Million
5.2.3.5. Botanicals/Herbals- Market Insights and Forecast 2022-2032, USD Million
5.2.3.6. Others- Market Insights and Forecast 2022-2032, USD Million
5.2.4.By Functionality
5.2.4.1. Energy- Market Insights and Forecast 2022-2032, USD Million
5.2.4.2. Muscle growth- Market Insights and Forecast 2022-2032, USD Million
5.2.4.3. Hydration- Market Insights and Forecast 2022-2032, USD Million
5.2.4.4. Weight Management- Market Insights and Forecast 2022-2032, USD Million
5.2.4.5. Others- Market Insights and Forecast 2022-2032, USD Million
5.2.5.By End User
5.2.5.1. Bodybuilders- Market Insights and Forecast 2022-2032, USD Million
5.2.5.2. Athletes- Market Insights and Forecast 2022-2032, USD Million
5.2.5.3. Lifestyle Users- Market Insights and Forecast 2022-2032, USD Million
5.2.6.By Competitors
5.2.6.1. Competition Characteristics
5.2.6.2. Market Share & Analysis
6. Chile Protein Products Sports Nutrition Market Statistics, 2022-2032F
6.1. Market Size & Growth Outlook
6.1.1.By Revenues in US$ Million
6.2. Market Segmentation & Growth Outlook
6.2.1.By Sales Channel- Market Insights and Forecast 2022-2032, USD Million
6.2.2.By Ingredients- Market Insights and Forecast 2022-2032, USD Million
6.2.3.By Functionality- Market Insights and Forecast 2022-2032, USD Million
6.2.4.By End User- Market Insights and Forecast 2022-2032, USD Million
7. Chile Non-Protein Products Sports Nutrition Market Statistics, 2022-2032F
7.1. Market Size & Growth Outlook
7.1.1.By Revenues in US$ Million
7.2. Market Segmentation & Growth Outlook
7.2.1.By Sales Channel- Market Insights and Forecast 2022-2032, USD Million
7.2.2.By Ingredients- Market Insights and Forecast 2022-2032, USD Million
7.2.3.By Functionality- Market Insights and Forecast 2022-2032, USD Million
7.2.4.By End User- Market Insights and Forecast 2022-2032, USD Million
8. Competitive Outlook
8.1. Company Profiles
8.1.1.Soc Com NLS Nutraline Suplement Ltda
8.1.1.1. Business Description
8.1.1.2. Product Portfolio
8.1.1.3. Collaborations & Alliances
8.1.1.4. Recent Developments
8.1.1.5. Financial Details
8.1.1.6. Others
8.1.2.Nutrimarket SA
8.1.2.1. Business Description
8.1.2.2. Product Portfolio
8.1.2.3. Collaborations & Alliances
8.1.2.4. Recent Developments
8.1.2.5. Financial Details
8.1.2.6. Others
8.1.3.Cía de Nutrición General SA
8.1.3.1. Business Description
8.1.3.2. Product Portfolio
8.1.3.3. Collaborations & Alliances
8.1.3.4. Recent Developments
8.1.3.5. Financial Details
8.1.3.6. Others
8.1.4.Importadora Universal Nutrition Chile Ltda
8.1.4.1. Business Description
8.1.4.2. Product Portfolio
8.1.4.3. Collaborations & Alliances
8.1.4.4. Recent Developments
8.1.4.5. Financial Details
8.1.4.6. Others
8.1.5.Socofar SA
8.1.5.1. Business Description
8.1.5.2. Product Portfolio
8.1.5.3. Collaborations & Alliances
8.1.5.4. Recent Developments
8.1.5.5. Financial Details
8.1.5.6. Others
8.1.6.Orizon SA
8.1.6.1. Business Description
8.1.6.2. Product Portfolio
8.1.6.3. Collaborations & Alliances
8.1.6.4. Recent Developments
8.1.6.5. Financial Details
8.1.6.6. Others
8.1.7.Herbalife Chile Ltda
8.1.7.1. Business Description
8.1.7.2. Product Portfolio
8.1.7.3. Collaborations & Alliances
8.1.7.4. Recent Developments
8.1.7.5. Financial Details
8.1.7.6. Others
8.1.8.Omnilife de Chile SA
8.1.8.1. Business Description
8.1.8.2. Product Portfolio
8.1.8.3. Collaborations & Alliances
8.1.8.4. Recent Developments
8.1.8.5. Financial Details
8.1.8.6. Others
8.1.9.Amway Chile SA
8.1.9.1. Business Description
8.1.9.2. Product Portfolio
8.1.9.3. Collaborations & Alliances
8.1.9.4. Recent Developments
8.1.9.5. Financial Details
8.1.9.6. Others
8.1.10. Comercializadora Novaverde SA
8.1.10.1. Business Description
8.1.10.2. Product Portfolio
8.1.10.3. Collaborations & Alliances
8.1.10.4. Recent Developments
8.1.10.5. Financial Details
8.1.10.6. Others
9. Disclaimer
| Segment | Sub-Segment |
|---|---|
| By Product Type |
|
| By Sales Channel |
|
| By Ingredients |
|
| By Functionality |
|
| By End User |
|
Research Methodology
This study followed a structured approach comprising four key phases to assess the size and scope of the electro-oxidation market. The process began with thorough secondary research to collect data on the target market, related markets, and broader industry context. These findings, along with preliminary assumptions and estimates, were then validated through extensive primary research involving industry experts from across the value chain. To calculate the overall market size, both top-down and bottom-up methodologies were employed. Finally, market segmentation and data triangulation techniques were applied to refine and validate segment-level estimations.
Secondary Research
The secondary research phase involved gathering data from a wide range of credible and published sources. This step helped in identifying industry trends, defining market segmentation, and understanding the market landscape and value chain.
Sources consulted during this phase included:
- Company annual reports, investor presentations, and press releases
- Industry white papers and certified publications
- Trade directories and market-recognized databases
- Articles from authoritative authors and reputable journals
- Gold and silver standard websites
Secondary research was critical in mapping out the industry's value chain and monetary flow, identifying key market segments, understanding regional variations, and tracking significant industry developments.
Other key sources:
- Financial disclosures
- Industry associations and trade bodies
- News outlets and business magazines
- Academic journals and research studies
- Paid industry databases
Primary Research
To validate secondary data and gain deeper market insights, primary research was conducted with key stakeholders across both the supply and demand sides of the market.
On the demand side, participants included decision-makers and influencers from end-user industries—such as CIOs, CTOs, and CSOs—who provided first-hand perspectives on market needs, product usage, and future expectations.
On the supply side, interviews were conducted with manufacturers, industry associations, and institutional participants to gather insights into current offerings, product pipelines, and market challenges.
Primary interviews provided critical inputs such as:
- Market size and revenue data
- Product and service breakdowns
- Market forecasts
- Regional and application-specific trends
Stakeholders consulted included:
- Leading OEM and solution providers
- Channel and distribution partners
- End users across various applications
- Independent consultants and industry specialists
Market Size Estimation and Data Triangulation
- Identifying Key Market Participants (Secondary Research)
- Goal: To identify the major players or companies in the target market. This typically involves using publicly available data sources such as industry reports, market research publications, and financial statements of companies.
- Tools: Reports from firms like Gartner, Forrester, Euromonitor, Statista, IBISWorld, and others. Public financial statements, news articles, and press releases from top market players.
- Extracting Earnings of Key Market Participants
- Goal: To estimate the earnings generated from the product or service being analyzed. This step helps in understanding the revenue potential of each market player in a specific geography.
- Methods: Earnings data can be gathered from:
- Publicly available financial reports (for listed companies).
- Interviews and primary data sources from professionals, such as Directors, VPs, SVPs, etc. This is especially useful for understanding more nuanced, internal data that isn't publicly disclosed.
- Annual reports and investor presentations of key players.
- Data Collation and Development of a Relevant Data Model
- Goal: To collate inputs from both primary and secondary sources into a structured, data-driven model for market estimation. This model will incorporate key market KPIs and any independent variables relevant to the market.
- Key KPIs: These could include:
- Market size, growth rate, and demand drivers.
- Industry-specific metrics like market share, average revenue per customer (ARPC), or average deal size.
- External variables, such as economic growth rates, inflation rates, or commodity prices, that could affect the market.
- Data Modeling: Based on this data, the market forecasts are developed for the next 5 years. A combination of trend analysis, scenario modeling, and statistical regression might be used to generate projections.
- Scenario Analysis
- Goal: To test different assumptions and validate how sensitive the market is to changes in key variables (e.g., market demand, regulatory changes, technological disruptions).
- Types of Scenarios:
- Base Case: Based on current assumptions and historical data.
- Best-Case Scenario: Assuming favorable market conditions, regulatory environments, and technological advancements.
- Worst-Case Scenario: Accounting for adverse factors, such as economic downturns, stricter regulations, or unexpected disruptions.


