Chile Alcoholic Drinks Market Report: Trends, Growth and Forecast (2026-2032)
By By Type (Beer, Cider/Perry, RTDs, Spirits, Wine), By By Alcohol Content (High, Medium, Low), By By Flavor (Unflavored, Flavored), By By Packaging Type (Glass Bottles, Tins, Plastic Bottles, Others), By By Sales Channel (On-Trade, Off-Trade (Retail Offline, Retail Online)) ... Read more
|
Major Players
|
Chile Alcoholic Drinks Market Statistics and Insights, 2026
- Market Size Statistics
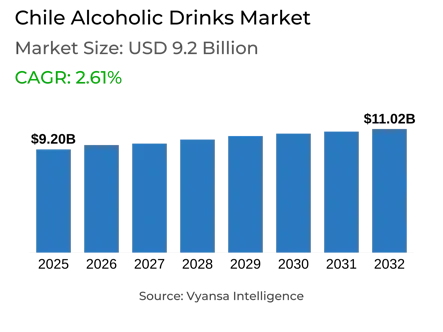
- Alcoholic Drinks in Chile is estimated at $ 9.2 Billion.
- The market size is expected to grow to $ 11.02 Billion by 2032.
- Market to register a CAGR of around 2.61% during 2026-32.
- Type Shares
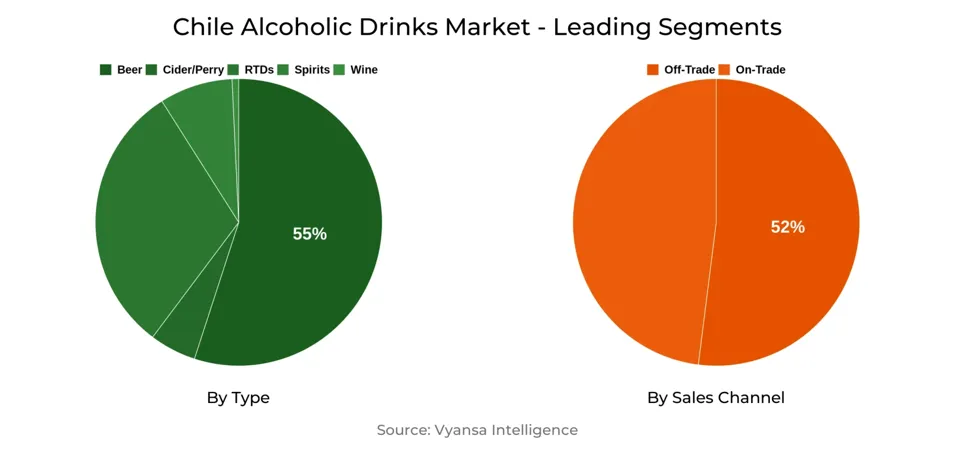
- Beer grabbed market share of 55%.
- Beer to witness a volume CAGR of around 2.47%.
- Competition
- More than 10 companies are actively engaged in producing Alcoholic Drinks in Chile.
- Top 5 companies acquired 80% of the market share.
- Molson Coors Brewing Co, Cooperativa Agrícola Pisquera de Elqui Ltda, Diageo Plc, Cía Cervecerías Unidas SA, Anheuser-Busch InBev NV etc., are few of the top companies.
- Sales Channel
- Off-Trade grabbed 52% of the market.
Chile Alcoholic Drinks Market Outlook
The Chile Alcoholic Drinks Market has a size of USD 9.2 billion and is expected to increase to USD 11.02 billion by 2032. Expansion will be slow because the nation continues to experience sluggish consumption patterns, particularly among young generations who are consuming less alcohol. Even with low average prices for affordability, reduced disposal incomes in recent times have constrained outlay, with changes in social behaviour following the pandemic further influencing demand. People have increasingly chosen to consume alcohol at home, encouraged by attractive prices off-trade.
Beer will still lead the market, but growth will decelerate. The category is forecast to register a volume CAGR of approximately 2.47% over the forecast period. Premium lager has surpassed mid-price brands as the top-selling category, although classic brands such as Cristal and Escudo continue to lead. Financial constraint has pushed some end users to down-trade to economy beers, while others with greater spending power are shifting towards premium options, polarising the market. Developments like flavoured and mixed lager will also contribute to winning over younger end users, going head-to-head with RTDs.
RTDs are poised to be the most vibrant segment. New introductions flavors reminiscent of popular Chile beverages. This move is not just giving wine consumption a new lease on life but also establishing RTDs as a refreshing and affordable option. Spirits, especially gin and bitters, are likely to fare well too, aided by growing demand for cocktails as well as mixology culture.
Off-trade channels will remain the growth driver, with sales made up of about 52%. Drink specialists, supermarkets, and hypermarkets continue to be greatly appealing because of their extensive coverage, active promotional campaigns, and long opening hours. E-commerce, although small, continues to grow and is likely to grow even larger with increased investment in delivery services. Consumption on-trade will bounce back slowly but continues to be hampered by high prices as well as by shorter opening hours. Overall, the Alcoholic Drinks Market in Chile is projected to grow steadily, aided by product innovation, changing end users preferences, and the sustained shift towards low-cost off-trade consumption.

Chile Alcoholic Drinks Market Growth Driver
Increasing Demand for Sweeter and Lighter Beverages
Rising end users preference for sweeter and lighter spirits drives market growth. Younger adults prefer ready-to-drink (RTD) and flavoured or mixed lagers that offer refreshing and accessible drinking experiences. These offerings are attractive due to their lower strength and sweet tastes, making them easier to consume than their stronger counterparts.
Firms dynamically respond to such a shift by broadening their product portfolios to cover new, innovative flavours that keep their target end users interested. The growing demand for such beverages maintains growth momentum across categories, as companies launch interesting options that are aligned with contemporary consumption patterns. Such a developing demand plays a pivotal role in defining the overall trajectory of the Market and spurring producers to concentrate on diversification.
Chile Alcoholic Drinks Market Trend
Polarisation and Premiumisation of Beer Consumption
A key trend shaping the market is the polarisation in beer consumption, with end users increasingly choosing either economy or premium lager options. The diminishing price difference among various segments of beers has led budget-savvy buyers to opt for economy brands, whereas buyers who are ready to spend a bit more prefer premium brands.
This movement indicates an increasing sophistication of drinking behavior, as end users match choices with both lifestyle goals and financial situations. Premium lager now dominates mid-range offerings as the favorite, while economy lagers appeal to those influenced by economic conditions. Both developments are changing the beer profile, emphasizing status consumption as well as price-conscious choices.
Unlock Market Intelligence
Explore the market potential with our data-driven report
Chile Alcoholic Drinks Market Opportunity
Wine-Based RTDs Expansion
A key potential for the market is growth in wine-based ready-to-drinks. Large wineries are launching new products based on classic Chile flavors, including Terremoto and Melón con Vino, to appeal to young adult end users. These developments offer familiarity blended with a contemporary edge, enabling manufacturers to refresh wine's appeal in a changing market.
Over the next few years, this strategy will assist wineries in appealing to a wider end users base, especially young adults who prefer sweeter and lighter drinks. By framing wine RTDs as enjoyable, taste-driven, and convenient, manufacturers can build stronger ties with new end users and promote long-term growth. The opportunity will also enable wineries to adjust to evolving drinking habits while reinvigorating the traditional wine segment.
Unlock Market Intelligence
Explore the market potential with our data-driven report
Chile Alcoholic Drinks Market Segmentation Analysis
By Type
- Beer
- Cider/Perry
- RTDs
- Spirits
- Wine
The segment with highest market share under Type category is Beer, which accounted for approximately 55% of the Chile Alcoholic Drinks Market in 2025. Beer was the choice of Chiles, aided by its extensive product range and ongoing innovations. Flavoured and mixed lagers like Sol Mix gained popularity as they resonated with young end users who demanded refreshing drinks with a sweeter character. Lager remained the leading category in total beer sales, with the premium range taking over mid-price as the favorite.
In the future, Beer is set to grow more, with a volume CAGR of approximately 2.47% between 2026-32. There has been end users polarisation in the market where some move towards economy lagers under economic constraint, and others move to premium brands. This double trend illustrates the increasing sophistication in beer consumption in Chile.
By Sales Channel
- On-Trade
- Off-Trade
The segment with highest market share under Sales Channel is off trade with 52% of the Chile Alcoholic Drinks Market. The locally referred to botillerías, or traditional drink specialists, were at the heart of this achievement. Their wide coverage, compelling promotions, and long opening hours made them the preferred channel for economic and convenient buying. Supermarkets and hypermarkets also performed very well, with high-profile promotions like substantial beer price cuts on multi-packs.
E-commerce, which began from a small level, has been the most active channel of sales. Internet sites like labarra.cl and miCoca-Cola.cl reinforced their hold by investing in quicker and more efficient delivery. Off-trade will still remain dominant as Chiles increasingly opt for buying alcoholic beverages at discounted prices for consumption at home instead of paying higher premiums for the on-trade channel.
Top Companies in Chile Alcoholic Drinks Market
The top companies operating in the market include Molson Coors Brewing Co, Cooperativa Agrícola Pisquera de Elqui Ltda, Diageo Plc, Cía Cervecerías Unidas SA, Anheuser-Busch InBev NV, Heineken NV, Viña Concha y Toro SA, Viña Santa Rita SA, Viña Valdivieso SA, Licores Mitjans SA, etc., are the top players operating in the Chile Alcoholic Drinks Market.
Frequently Asked Questions
Related Report
1. Market Segmentation
1.1. Research Scope
1.2. Research Methodology
1.3. Definitions and Assumptions
2. Executive Summary
3. Chile Alcoholic Drinks Market Policies, Regulations, and Standards
4. Chile Alcoholic Drinks Market Dynamics
4.1. Growth Factors
4.2. Challenges
4.3. Trends
4.4. Opportunities
5. Chile Alcoholic Drinks Market Statistics, 2022-2032F
5.1. Market Size & Growth Outlook
5.1.1. By Revenues in US$ Million
5.1.2. By Quantity Sold in Million Litres
5.2. Market Segmentation & Growth Outlook
5.2.1. By Type
5.2.1.1. Beer- Market Insights and Forecast 2022-2032, USD Million
5.2.1.2. Cider/Perry- Market Insights and Forecast 2022-2032, USD Million
5.2.1.3. RTDs- Market Insights and Forecast 2022-2032, USD Million
5.2.1.4. Spirits- Market Insights and Forecast 2022-2032, USD Million
5.2.1.5. Wine- Market Insights and Forecast 2022-2032, USD Million
5.2.2. By Alcohol Content
5.2.2.1. High- Market Insights and Forecast 2022-2032, USD Million
5.2.2.2. Medium- Market Insights and Forecast 2022-2032, USD Million
5.2.2.3. Low- Market Insights and Forecast 2022-2032, USD Million
5.2.3. By Flavor
5.2.3.1. Unflavored- Market Insights and Forecast 2022-2032, USD Million
5.2.3.2. Flavored- Market Insights and Forecast 2022-2032, USD Million
5.2.4. By Packaging Type
5.2.4.1. Glass Bottles- Market Insights and Forecast 2022-2032, USD Million
5.2.4.2. Tins- Market Insights and Forecast 2022-2032, USD Million
5.2.4.3. Plastic Bottles- Market Insights and Forecast 2022-2032, USD Million
5.2.4.4. Others- Market Insights and Forecast 2022-2032, USD Million
5.2.5. By Sales Channel
5.2.5.1. On-Trade- Market Insights and Forecast 2022-2032, USD Million
5.2.5.2. Off-Trade- Market Insights and Forecast 2022-2032, USD Million
5.2.5.2.1. Retail Offline- Market Insights and Forecast 2022-2032, USD Million
5.2.5.2.2. Retail Online- Market Insights and Forecast 2022-2032, USD Million
5.2.6. By Competitors
5.2.6.1. Competition Characteristics
5.2.6.2. Market Share & Analysis
6. Chile Beer Market Statistics, 2022-2032F
6.1. Market Size & Growth Outlook
6.1.1. By Revenues in US$ Million
6.1.2. By Quantity Sold in Million Litres
6.2. Market Segmentation & Growth Outlook
6.2.1. By Alcohol Content- Market Insights and Forecast 2022-2032, USD Million
6.2.2. By Flavor- Market Insights and Forecast 2022-2032, USD Million
6.2.3. By Packaging Type- Market Insights and Forecast 2022-2032, USD Million
6.2.4. By Sales Channel- Market Insights and Forecast 2022-2032, USD Million
7. Chile Cider/Perry Market Statistics, 2022-2032F
7.1. Market Size & Growth Outlook
7.1.1. By Revenues in US$ Million
7.1.2. By Quantity Sold in Million Litres
7.2. Market Segmentation & Growth Outlook
7.2.1. By Alcohol Content- Market Insights and Forecast 2022-2032, USD Million
7.2.2. By Flavor- Market Insights and Forecast 2022-2032, USD Million
7.2.3. By Packaging Type- Market Insights and Forecast 2022-2032, USD Million
7.2.4. By Sales Channel- Market Insights and Forecast 2022-2032, USD Million
8. Chile Ready-to-Drink Market Statistics, 2022-2032F
8.1. Market Size & Growth Outlook
8.1.1. By Revenues in US$ Million
8.1.2. By Quantity Sold in Million Litres
8.2. Market Segmentation & Growth Outlook
8.2.1. By Alcohol Content- Market Insights and Forecast 2022-2032, USD Million
8.2.2. By Flavor- Market Insights and Forecast 2022-2032, USD Million
8.2.3. By Packaging Type- Market Insights and Forecast 2022-2032, USD Million
8.2.4. By Sales Channel- Market Insights and Forecast 2022-2032, USD Million
9. Chile Spirits Market Statistics, 2022-2032F
9.1. Market Size & Growth Outlook
9.1.1. By Revenues in US$ Million
9.1.2. By Quantity Sold in Million Litres
9.2. Market Segmentation & Growth Outlook
9.2.1. By Alcohol Content- Market Insights and Forecast 2022-2032, USD Million
9.2.2. By Flavor- Market Insights and Forecast 2022-2032, USD Million
9.2.3. By Packaging Type- Market Insights and Forecast 2022-2032, USD Million
9.2.4. By Sales Channel- Market Insights and Forecast 2022-2032, USD Million
10. Chile Wine Market Statistics, 2022-2032F
10.1.Market Size & Growth Outlook
10.1.1. By Revenues in US$ Million
10.1.2. By Quantity Sold in Million Litres
10.2.Market Segmentation & Growth Outlook
10.2.1. By Alcohol Content- Market Insights and Forecast 2022-2032, USD Million
10.2.2. By Flavor- Market Insights and Forecast 2022-2032, USD Million
10.2.3. By Packaging Type- Market Insights and Forecast 2022-2032, USD Million
10.2.4. By Sales Channel- Market Insights and Forecast 2022-2032, USD Million
11. Competitive Outlook
11.1.Company Profiles
11.1.1. Cía Cervecerías Unidas SA
11.1.1.1. Business Description
11.1.1.2. Product Portfolio
11.1.1.3. Collaborations & Alliances
11.1.1.4. Recent Developments
11.1.1.5. Financial Details
11.1.1.6. Others
11.1.2. Anheuser-Busch InBev NV
11.1.2.1. Business Description
11.1.2.2. Product Portfolio
11.1.2.3. Collaborations & Alliances
11.1.2.4. Recent Developments
11.1.2.5. Financial Details
11.1.2.6. Others
11.1.3. Heineken NV
11.1.3.1. Business Description
11.1.3.2. Product Portfolio
11.1.3.3. Collaborations & Alliances
11.1.3.4. Recent Developments
11.1.3.5. Financial Details
11.1.3.6. Others
11.1.4. Viña Concha y Toro SA
11.1.4.1. Business Description
11.1.4.2. Product Portfolio
11.1.4.3. Collaborations & Alliances
11.1.4.4. Recent Developments
11.1.4.5. Financial Details
11.1.4.6. Others
11.1.5. Viña Santa Rita SA
11.1.5.1. Business Description
11.1.5.2. Product Portfolio
11.1.5.3. Collaborations & Alliances
11.1.5.4. Recent Developments
11.1.5.5. Financial Details
11.1.5.6. Others
11.1.6. Molson Coors Brewing Co
11.1.6.1. Business Description
11.1.6.2. Product Portfolio
11.1.6.3. Collaborations & Alliances
11.1.6.4. Recent Developments
11.1.6.5. Financial Details
11.1.6.6. Others
11.1.7. Cooperativa Agrícola Pisquera de Elqui Ltda
11.1.7.1. Business Description
11.1.7.2. Product Portfolio
11.1.7.3. Collaborations & Alliances
11.1.7.4. Recent Developments
11.1.7.5. Financial Details
11.1.7.6. Others
11.1.8. Diageo Plc
11.1.8.1. Business Description
11.1.8.2. Product Portfolio
11.1.8.3. Collaborations & Alliances
11.1.8.4. Recent Developments
11.1.8.5. Financial Details
11.1.8.6. Others
11.1.9. Viña Valdivieso SA
11.1.9.1. Business Description
11.1.9.2. Product Portfolio
11.1.9.3. Collaborations & Alliances
11.1.9.4. Recent Developments
11.1.9.5. Financial Details
11.1.9.6. Others
11.1.10. Licores Mitjans SA
11.1.10.1. Business Description
11.1.10.2. Product Portfolio
11.1.10.3. Collaborations & Alliances
11.1.10.4. Recent Developments
11.1.10.5. Financial Details
11.1.10.6. Others
12. Disclaimer
| Segment | Sub-Segment |
|---|---|
| By Type |
|
| By Alcohol Content |
|
| By Flavor |
|
| By Packaging Type |
|
| By Sales Channel |
|
Research Methodology
This study followed a structured approach comprising four key phases to assess the size and scope of the electro-oxidation market. The process began with thorough secondary research to collect data on the target market, related markets, and broader industry context. These findings, along with preliminary assumptions and estimates, were then validated through extensive primary research involving industry experts from across the value chain. To calculate the overall market size, both top-down and bottom-up methodologies were employed. Finally, market segmentation and data triangulation techniques were applied to refine and validate segment-level estimations.
Secondary Research
The secondary research phase involved gathering data from a wide range of credible and published sources. This step helped in identifying industry trends, defining market segmentation, and understanding the market landscape and value chain.
Sources consulted during this phase included:
- Company annual reports, investor presentations, and press releases
- Industry white papers and certified publications
- Trade directories and market-recognized databases
- Articles from authoritative authors and reputable journals
- Gold and silver standard websites
Secondary research was critical in mapping out the industry's value chain and monetary flow, identifying key market segments, understanding regional variations, and tracking significant industry developments.
Other key sources:
- Financial disclosures
- Industry associations and trade bodies
- News outlets and business magazines
- Academic journals and research studies
- Paid industry databases
Primary Research
To validate secondary data and gain deeper market insights, primary research was conducted with key stakeholders across both the supply and demand sides of the market.
On the demand side, participants included decision-makers and influencers from end-user industries—such as CIOs, CTOs, and CSOs—who provided first-hand perspectives on market needs, product usage, and future expectations.
On the supply side, interviews were conducted with manufacturers, industry associations, and institutional participants to gather insights into current offerings, product pipelines, and market challenges.
Primary interviews provided critical inputs such as:
- Market size and revenue data
- Product and service breakdowns
- Market forecasts
- Regional and application-specific trends
Stakeholders consulted included:
- Leading OEM and solution providers
- Channel and distribution partners
- End users across various applications
- Independent consultants and industry specialists
Market Size Estimation and Data Triangulation
- Identifying Key Market Participants (Secondary Research)
- Goal: To identify the major players or companies in the target market. This typically involves using publicly available data sources such as industry reports, market research publications, and financial statements of companies.
- Tools: Reports from firms like Gartner, Forrester, Euromonitor, Statista, IBISWorld, and others. Public financial statements, news articles, and press releases from top market players.
- Extracting Earnings of Key Market Participants
- Goal: To estimate the earnings generated from the product or service being analyzed. This step helps in understanding the revenue potential of each market player in a specific geography.
- Methods: Earnings data can be gathered from:
- Publicly available financial reports (for listed companies).
- Interviews and primary data sources from professionals, such as Directors, VPs, SVPs, etc. This is especially useful for understanding more nuanced, internal data that isn't publicly disclosed.
- Annual reports and investor presentations of key players.
- Data Collation and Development of a Relevant Data Model
- Goal: To collate inputs from both primary and secondary sources into a structured, data-driven model for market estimation. This model will incorporate key market KPIs and any independent variables relevant to the market.
- Key KPIs: These could include:
- Market size, growth rate, and demand drivers.
- Industry-specific metrics like market share, average revenue per customer (ARPC), or average deal size.
- External variables, such as economic growth rates, inflation rates, or commodity prices, that could affect the market.
- Data Modeling: Based on this data, the market forecasts are developed for the next 5 years. A combination of trend analysis, scenario modeling, and statistical regression might be used to generate projections.
- Scenario Analysis
- Goal: To test different assumptions and validate how sensitive the market is to changes in key variables (e.g., market demand, regulatory changes, technological disruptions).
- Types of Scenarios:
- Base Case: Based on current assumptions and historical data.
- Best-Case Scenario: Assuming favorable market conditions, regulatory environments, and technological advancements.
- Worst-Case Scenario: Accounting for adverse factors, such as economic downturns, stricter regulations, or unexpected disruptions.


