Canada Sports Nutrition Market Report: Trends, Growth and Forecast (2026-2032)
Product Type (Sports Protein Products (Protein/Energy Bars, Sports Protein Powder, Sports Protein RTD), Sports Non-Protein Products), Sales Channel (Retail Offline, Retail Online), Ingredients (Vitamins and Minerals, Proteins and Amino Acids, Carbohydrates, Probiotics, Botanicals/Herbals, Others), Functionality (Energy, Muscle growth, Hydration, Weight Management, Others), End User (Bodybuilders, Athletes, Lifestyle Users) ... Read more
|
Major Players
|
Canada Sports Nutrition Market Statistics and Insights, 2026
- Market Size Statistics
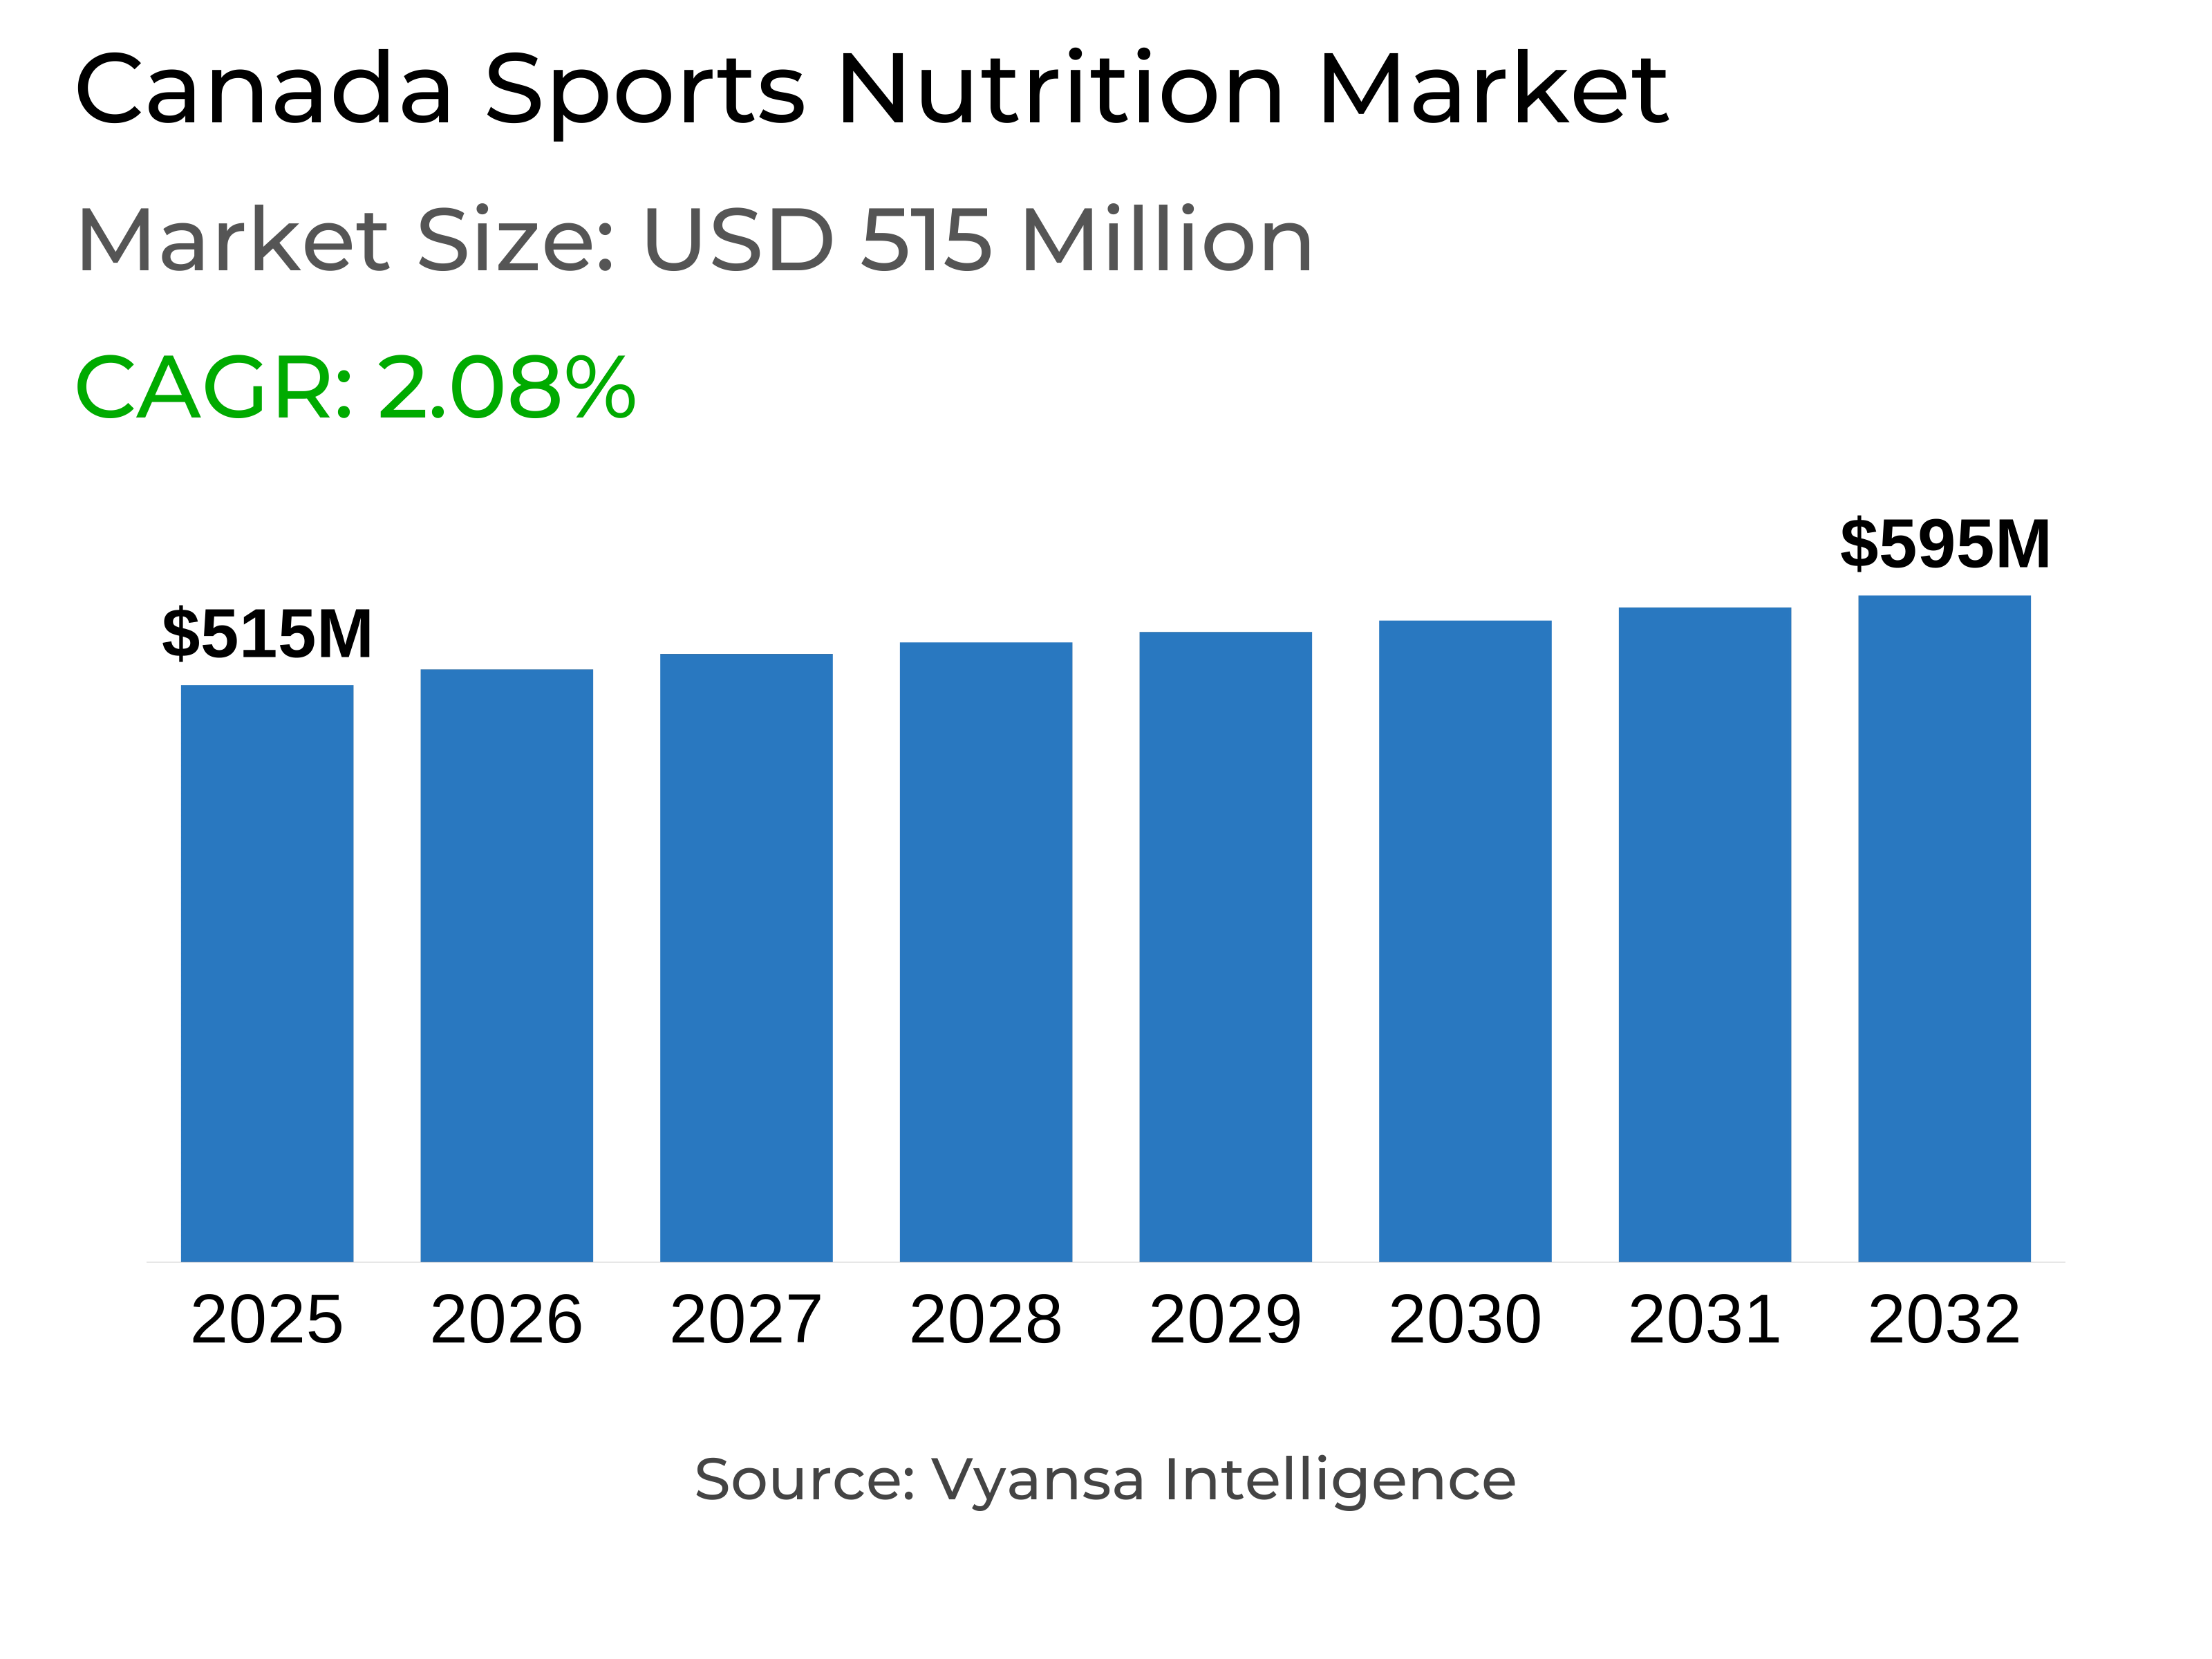
- Sports nutrition in canada is estimated at USD 515 million.
- The market size is expected to grow to USD 595 million by 2032.
- Market to register a cagr of around 2.08% during 2026-32.
- Product Type Shares
- Sports protein products grabbed market share of 90%.
- Competition
- More than 20 companies are actively engaged in producing sports nutrition in canada.
- Top 5 companies acquired around 30% of the market share.
- Nutrabolt Distribution Canada ULC, Kellanova Canada Inc, Nutrition Zone Products Inc, Sports Supplements LLC, Clif Bar & Co etc., are few of the top companies.
- Sales Channel
- Retail online grabbed 60% of the market.
Canada Sports Nutrition Market Outlook
The sports nutrition market in Canada is valued at around USD 515 million in 2025 and is anticipated to reach around USD 595 million by 2032, growing at a CAGR of around 2.08% from 2026-32. This growth is supported by the rising emphasis on health and wellness, as end users continue to priortize physical activity, balanced diet, and overall health. Growing fitness clubs and gyms now provide comprehensive wellness programs that accompany end users active lifestyle, which encourage higher consumption of sports nutrition products.
Sports protein products dominates the market, with around 90% share of sports protein segment. Protein/energy bars, protein powders, and ready-to-drink (RTD) protein products are the most popular, which reflects end users focus on muscle building, performance enhancement, and convenient nutrition solutions. End users prefer solutions that align with their personalized fitness goals and support both daily endurance and active lifestyles.
The segment is competitive, with the industry leaders collectively holding around 30% of the segment share. Dominant and emerging players battle on product innovation, premium products, digital connect, and communication strategies. Small and niche brands continue to aim at specialized niches, making competition intense and improving product quality, assortment, and end user satisfaction.
Retail online is dominating the segment, with around 60% share in the sales channel. End users prefer retail online channels to purchase protein products because of convenience, variety, detailed information, and personal recommendations. Urban areas of the country report high levels of online activity, while retail offline through gyms, specialty stores, and supermarkets holds a smaller share.

Canada Sports Nutrition Market Growth DriverGrowing Focus on Health and Wellness
End users continue to focus on health, wellbeing, and sustaining emotional and mental wellbeing through regular physical fitness, this is fueling growth for sports nutrition. End users integrate sports nutrition into their fitness routines, being a reflection of rising awareness of general well being and an balanced lifestyle. Regular participation in fitness activities inspires end users to adopt products that align with their individual health goals.
Additionally, gyms and fitness clubs are growing and transforming to meet these preferences, providing wider range of fitness and wellness services. Many now provide a mix of services like social areas, spa treatments, cafés, and personal training, providing a more integrated strategy towards health and encouraging long term engagement in physical activity. This further, increases demand for sports nutrition products as end users look for products that align with their active and wellness oriented lifestyles.
Canada Sports Nutrition Market ChallengeRegulatory Compliance and Market Accessibility
Strict government regulations and policies hinder the sports nutrition market in Canada. Companies need to comply with product safety, labeling, and marketing requirements that may increase the costs and delay new product launches. This impacts end users ability to access the latest nutrition solutions quickly.
Such regulatory demands also impact availability of products among various communities. End users such as seniors, the disabled, low income individuals, and indigenous population may face limited availability or higher costs due to the complexity of rules. Companies need to work on managing compliance while ensuring that products remain accessible and usable for all end users. Being able to comply with these requirements on a regular basis is likely to remain a significantconcern for the market since it has direct impact on both product availability and cost.
Unlock Market Intelligence
Explore the market potential with our data-driven report
Canada Sports Nutrition Market TrendGrowing Demand for Non-Protein Pre and Post-Workout Products
End users are being attracted to non-protein pre and post workout products as fitness training becomes more targeted and time efficient. Express workouts and functional fitness are creating interest in products that deliver fast and efficient outcomes. EAA and BCAA-containing products are becoming popular for their ability to improve muscle gain and fat loss, reflecting the growing focus on targeted nutrition.
Additionally, this interest is especially high among older end users, who exercise to support active ageing and maintaining independence. Products that improve physical endurance and daily performance are more in demand, since end users seek nutrition products that will complement their fitness efforts directly. This emphasis on functional, outcome based products continues to influence the market, highlighting the importance of personalized and effective nutrition solutions for a wide range of ages.
Canada Sports Nutrition Market OpportunityRising Demand for Premium and Customized Nutrition Products
With the recovering economy it is anticipated to relieve pressure on end user budgets and enable higher expenditure on health and wellness. End users will be investing more on sports nutrition products that focus on enhancing fitness, general wellbeing, and performance, creating favorable conditions for growth of personalized products. Products that provide added benefits, targeted support, and ease of use are anticipated to get more attention, therefore increasing demand across multiple segments.
Additionally, as end users become selective, cautious, and more aware about their nutritional requirements, demand for premium and customized sports nutrition products will grow. Companies working on providing tailored formulations, high quality ingredients, and specialized solutions will attract interest from health oriented end users. This is likely to encourage introduction of innovative products, more options, and better opportunities in various segments across the market through the forecast period.
Unlock Market Intelligence
Explore the market potential with our data-driven report
Canada Sports Nutrition Market Segmentation Analysis

By Product Type
- Sports Protein Products
- Sports Non-Protein Products
Sports protein products dominate the sports nutrition segment with a share of around 90% of overall market value. In this segment, protein/energy bars are the top choice for end users, followed by sports protein powders and ready-to-drink (RTD) protein products. The high demand for protein based products indicates end users focus on building muscle, enhancing performance, and general fitness.
The growth of sports protein products is supported by convenience and targeted benefits. Protein powders enable end users to customize their intake, bars deliver rapid nutrition support, and RTD products facilitate on the go living. These options address varied end users needs, ensuring protein based solutions remain king of the market and generating most of the revenue in the sports nutrition category.
By Sales Channel
- Retail Offline
- Retail Online
Retail online is the dominating sales channel, accounting for around 60% of the market share. Retail online channels are favored more by end users due to the convenience of ordering products anytime, explore a wide range of protein powders, vitamins, energy bars, and performance enhancers, and view detailed product information, reviews, and comparisons. Subscription services, personalized suggestions, and regular promotions also make repeat purchasing more likely, making retail online the most rapidly growing channel.
Urban areas across the country shows strong online engagement, as tech savvy end users rely on retail online channels for fitness and nutrition requirements. In retail offline, protein products are primarily sold through gyms, specialty health food stores, and supermarkets represents a smaller percentage and adds less to the growth of the market than the fast growing retail online segment, which continues to attract both new and loyal end users.
Top Companies in Canada Sports Nutrition Market
The top companies operating in the market include Nutrabolt Distribution Canada ULC, Kellanova Canada Inc, Nutrition Zone Products Inc, Sports Supplements LLC, Clif Bar & Co, Iovate Health Sciences International Inc, Optimum Nutrition Inc, Allmax Nutrition Inc, Nestlé Canada Inc, General Nutrition Centers Inc, etc., are the top players operating in the canada sports nutrition market.
Frequently Asked Questions
Related Report
1. Market Segmentation
1.1. Research Scope
1.2. Research Methodology
1.3. Definitions and Assumptions
2. Executive Summary
3. Canada Sports Nutrition Market Policies, Regulations, and Standards
4. Canada Sports Nutrition Market Dynamics
4.1. Growth Factors
4.2. Challenges
4.3. Trends
4.4. Opportunities
5. Canada Sports Nutrition Market Statistics, 2022-2032F
5.1. Market Size & Growth Outlook
5.1.1.By Revenues in US$ Million
5.2. Market Segmentation & Growth Outlook
5.2.1.By Product Type
5.2.1.1. Sports Protein Products- Market Insights and Forecast 2022-2032, USD Million
5.2.1.1.1. Protein/Energy Bars- Market Insights and Forecast 2022-2032, USD Million
5.2.1.1.2. Sports Protein Powder- Market Insights and Forecast 2022-2032, USD Million
5.2.1.1.3. Sports Protein RTD- Market Insights and Forecast 2022-2032, USD Million
5.2.1.2. Sports Non-Protein Products- Market Insights and Forecast 2022-2032, USD Million
5.2.2.By Sales Channel
5.2.2.1. Retail Offline- Market Insights and Forecast 2022-2032, USD Million
5.2.2.2. Retail Online- Market Insights and Forecast 2022-2032, USD Million
5.2.3.By Ingredients
5.2.3.1. Vitamins and Minerals- Market Insights and Forecast 2022-2032, USD Million
5.2.3.2. Proteins and Amino Acids- Market Insights and Forecast 2022-2032, USD Million
5.2.3.3. Carbohydrates- Market Insights and Forecast 2022-2032, USD Million
5.2.3.4. Probiotics- Market Insights and Forecast 2022-2032, USD Million
5.2.3.5. Botanicals/Herbals- Market Insights and Forecast 2022-2032, USD Million
5.2.3.6. Others- Market Insights and Forecast 2022-2032, USD Million
5.2.4.By Functionality
5.2.4.1. Energy- Market Insights and Forecast 2022-2032, USD Million
5.2.4.2. Muscle growth- Market Insights and Forecast 2022-2032, USD Million
5.2.4.3. Hydration- Market Insights and Forecast 2022-2032, USD Million
5.2.4.4. Weight Management- Market Insights and Forecast 2022-2032, USD Million
5.2.4.5. Others- Market Insights and Forecast 2022-2032, USD Million
5.2.5.By End User
5.2.5.1. Bodybuilders- Market Insights and Forecast 2022-2032, USD Million
5.2.5.2. Athletes- Market Insights and Forecast 2022-2032, USD Million
5.2.5.3. Lifestyle Users- Market Insights and Forecast 2022-2032, USD Million
5.2.6.By Competitors
5.2.6.1. Competition Characteristics
5.2.6.2. Market Share & Analysis
6. Canada Protein Products Sports Nutrition Market Statistics, 2022-2032F
6.1. Market Size & Growth Outlook
6.1.1.By Revenues in US$ Million
6.2. Market Segmentation & Growth Outlook
6.2.1.By Sales Channel- Market Insights and Forecast 2022-2032, USD Million
6.2.2.By Ingredients- Market Insights and Forecast 2022-2032, USD Million
6.2.3.By Functionality- Market Insights and Forecast 2022-2032, USD Million
6.2.4.By End User- Market Insights and Forecast 2022-2032, USD Million
7. Canada Non-Protein Products Sports Nutrition Market Statistics, 2022-2032F
7.1. Market Size & Growth Outlook
7.1.1.By Revenues in US$ Million
7.2. Market Segmentation & Growth Outlook
7.2.1.By Sales Channel- Market Insights and Forecast 2022-2032, USD Million
7.2.2.By Ingredients- Market Insights and Forecast 2022-2032, USD Million
7.2.3.By Functionality- Market Insights and Forecast 2022-2032, USD Million
7.2.4.By End User- Market Insights and Forecast 2022-2032, USD Million
8. Competitive Outlook
8.1. Company Profiles
8.1.1.Sports Supplements LLC
8.1.1.1. Business Description
8.1.1.2. Product Portfolio
8.1.1.3. Collaborations & Alliances
8.1.1.4. Recent Developments
8.1.1.5. Financial Details
8.1.1.6. Others
8.1.2.Clif Bar & Co
8.1.2.1. Business Description
8.1.2.2. Product Portfolio
8.1.2.3. Collaborations & Alliances
8.1.2.4. Recent Developments
8.1.2.5. Financial Details
8.1.2.6. Others
8.1.3.Iovate Health Sciences International Inc
8.1.3.1. Business Description
8.1.3.2. Product Portfolio
8.1.3.3. Collaborations & Alliances
8.1.3.4. Recent Developments
8.1.3.5. Financial Details
8.1.3.6. Others
8.1.4.Optimum Nutrition Inc
8.1.4.1. Business Description
8.1.4.2. Product Portfolio
8.1.4.3. Collaborations & Alliances
8.1.4.4. Recent Developments
8.1.4.5. Financial Details
8.1.4.6. Others
8.1.5.Allmax Nutrition Inc
8.1.5.1. Business Description
8.1.5.2. Product Portfolio
8.1.5.3. Collaborations & Alliances
8.1.5.4. Recent Developments
8.1.5.5. Financial Details
8.1.5.6. Others
8.1.6.Nutrabolt Distribution Canada ULC
8.1.6.1. Business Description
8.1.6.2. Product Portfolio
8.1.6.3. Collaborations & Alliances
8.1.6.4. Recent Developments
8.1.6.5. Financial Details
8.1.6.6. Others
8.1.7.Kellanova Canada Inc
8.1.7.1. Business Description
8.1.7.2. Product Portfolio
8.1.7.3. Collaborations & Alliances
8.1.7.4. Recent Developments
8.1.7.5. Financial Details
8.1.7.6. Others
8.1.8.Nutrition Zone Products Inc
8.1.8.1. Business Description
8.1.8.2. Product Portfolio
8.1.8.3. Collaborations & Alliances
8.1.8.4. Recent Developments
8.1.8.5. Financial Details
8.1.8.6. Others
8.1.9.Nestlé Canada Inc
8.1.9.1. Business Description
8.1.9.2. Product Portfolio
8.1.9.3. Collaborations & Alliances
8.1.9.4. Recent Developments
8.1.9.5. Financial Details
8.1.9.6. Others
8.1.10. General Nutrition Centers Inc
8.1.10.1. Business Description
8.1.10.2. Product Portfolio
8.1.10.3. Collaborations & Alliances
8.1.10.4. Recent Developments
8.1.10.5. Financial Details
8.1.10.6. Others
9. Disclaimer
| Segment | Sub-Segment |
|---|---|
| By Product Type |
|
| By Sales Channel |
|
| By Ingredients |
|
| By Functionality |
|
| By End User |
|
Research Methodology
This study followed a structured approach comprising four key phases to assess the size and scope of the electro-oxidation market. The process began with thorough secondary research to collect data on the target market, related markets, and broader industry context. These findings, along with preliminary assumptions and estimates, were then validated through extensive primary research involving industry experts from across the value chain. To calculate the overall market size, both top-down and bottom-up methodologies were employed. Finally, market segmentation and data triangulation techniques were applied to refine and validate segment-level estimations.
Secondary Research
The secondary research phase involved gathering data from a wide range of credible and published sources. This step helped in identifying industry trends, defining market segmentation, and understanding the market landscape and value chain.
Sources consulted during this phase included:
- Company annual reports, investor presentations, and press releases
- Industry white papers and certified publications
- Trade directories and market-recognized databases
- Articles from authoritative authors and reputable journals
- Gold and silver standard websites
Secondary research was critical in mapping out the industry's value chain and monetary flow, identifying key market segments, understanding regional variations, and tracking significant industry developments.
Other key sources:
- Financial disclosures
- Industry associations and trade bodies
- News outlets and business magazines
- Academic journals and research studies
- Paid industry databases
Primary Research
To validate secondary data and gain deeper market insights, primary research was conducted with key stakeholders across both the supply and demand sides of the market.
On the demand side, participants included decision-makers and influencers from end-user industries—such as CIOs, CTOs, and CSOs—who provided first-hand perspectives on market needs, product usage, and future expectations.
On the supply side, interviews were conducted with manufacturers, industry associations, and institutional participants to gather insights into current offerings, product pipelines, and market challenges.
Primary interviews provided critical inputs such as:
- Market size and revenue data
- Product and service breakdowns
- Market forecasts
- Regional and application-specific trends
Stakeholders consulted included:
- Leading OEM and solution providers
- Channel and distribution partners
- End users across various applications
- Independent consultants and industry specialists
Market Size Estimation and Data Triangulation
- Identifying Key Market Participants (Secondary Research)
- Goal: To identify the major players or companies in the target market. This typically involves using publicly available data sources such as industry reports, market research publications, and financial statements of companies.
- Tools: Reports from firms like Gartner, Forrester, Euromonitor, Statista, IBISWorld, and others. Public financial statements, news articles, and press releases from top market players.
- Extracting Earnings of Key Market Participants
- Goal: To estimate the earnings generated from the product or service being analyzed. This step helps in understanding the revenue potential of each market player in a specific geography.
- Methods: Earnings data can be gathered from:
- Publicly available financial reports (for listed companies).
- Interviews and primary data sources from professionals, such as Directors, VPs, SVPs, etc. This is especially useful for understanding more nuanced, internal data that isn't publicly disclosed.
- Annual reports and investor presentations of key players.
- Data Collation and Development of a Relevant Data Model
- Goal: To collate inputs from both primary and secondary sources into a structured, data-driven model for market estimation. This model will incorporate key market KPIs and any independent variables relevant to the market.
- Key KPIs: These could include:
- Market size, growth rate, and demand drivers.
- Industry-specific metrics like market share, average revenue per customer (ARPC), or average deal size.
- External variables, such as economic growth rates, inflation rates, or commodity prices, that could affect the market.
- Data Modeling: Based on this data, the market forecasts are developed for the next 5 years. A combination of trend analysis, scenario modeling, and statistical regression might be used to generate projections.
- Scenario Analysis
- Goal: To test different assumptions and validate how sensitive the market is to changes in key variables (e.g., market demand, regulatory changes, technological disruptions).
- Types of Scenarios:
- Base Case: Based on current assumptions and historical data.
- Best-Case Scenario: Assuming favorable market conditions, regulatory environments, and technological advancements.
- Worst-Case Scenario: Accounting for adverse factors, such as economic downturns, stricter regulations, or unexpected disruptions.


