Cambodia Alcoholic Drinks Market Report: Trends, Growth and Forecast (2026-2032)
By Type (Beer, Cider/Perry, RTDs, Spirits, Wine), By Alcohol Content (High, Medium, Low), By Flavor (Unflavored, Flavored), By Packaging Type (Glass Bottles, Tins, Plastic Bottles, Others), By Sales Channel (On-Trade, Off-Trade (Retail Offline, Retail Online)) ... Read more
|
Major Players
|
Cambodia Alcoholic Drinks Market Statistics and Insights, 2026
- Market Size Statistics
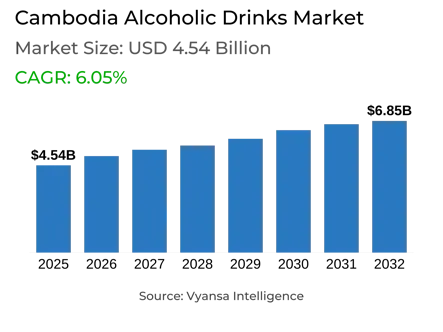
- Alcoholic Drinks in Cambodia is estimated at $ 4.54 Billion.
- The market size is expected to grow to $ 6.85 Billion by 2032.
- Market to register a CAGR of around 6.05% during 2026-32.
- Type Shares
- Beer grabbed market share of 90%.
- Beer to witness a volume CAGR of around 4.8%.
- Competition
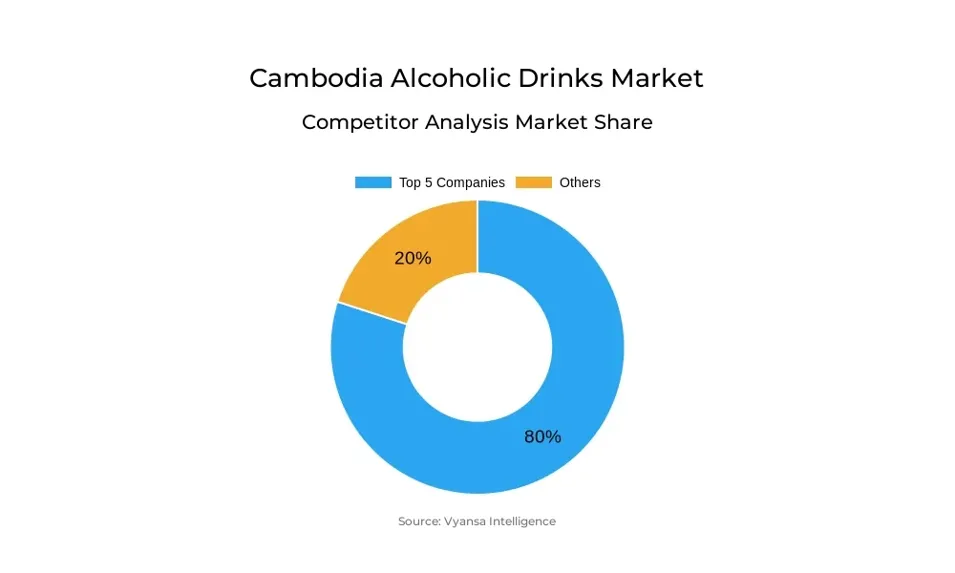
- More than 5 companies are actively engaged in producing Alcoholic Drinks in Cambodia.
- Top 5 companies acquired 80% of the market share.
- Diageo Plc, Pernod Ricard Groupe, Heineken NV, Khmer Beverages Co Ltd, Ganzberg Brewery Co etc., are few of the top companies.
- Sales Channel
- Off-Trade grabbed 65% of the market.
Cambodia Alcoholic Drinks Market Outlook
The Cambodia Alcoholic Drinks market is forecast at $4.54 billion and is likely to reach $6.85 billion by 2032. This growth finds support in increasing disposable income, urbanization, and changing social lifestyle that promotes alcohol use among the youth. Beer is also going to be the leading category, with volume sales growing at a CAGR of approximately 4.8% over the forecast period. Local and international players are going to continue luring end users, with local brands providing affordability and international brands having premium appeal.
Off-trade sales will dominate the market, taking some 65% of sales, fueled by convenience, value, and pervasive cover in both urban and rural areas. Small local stores will remain at the heart of the market, as supermarkets and modern grocery stores are likely to increase their share, enhancing convenience and providing a broader product range. On-trade will be important in urban areas and tourist destinations, backed by bars, restaurants, and nightspots.
Premiumisation and craft beer are also expected to gain pace as end users increasingly demand distinctive flavours, artisanal brewing styles, and better-quality experiences. Although more costly, craft beer will attract tourists, expatriates, and urban dwellers, creating support for its niche growth. Concurrently, non/low alcohol beers are expected to expand from a low base, driven by growing health awareness and end user desire for moderation.
Innovation will be a major driver, with manufacturers experimenting with new tastes, natural ingredients, and eco-friendly packaging. Marketing campaigns, especially in social media and experiential promotions, will continue to play a central role in shaping end users' buying behaviour. Overall, the market will see steady growth, driven by economic growth, broadening distribution networks, and changing end user preferences.
Cambodia Alcoholic Drinks Market Growth Driver
Increased Disposable Income and Urbanisation
Increasing disposable income and urbanisation are propelling growth in Cambodia Alcoholic Drinks market. With more people migrating to urban areas, their exposure to urban lifestyles and social drinking situations rises, leading to greater consumption of beer, spirits, and premium drinks.
Economic growth is also making end users upgrade to more premium alcoholic drinks. Urban dwellers, especially young adults, are looking for novelty, socialising in restaurants and bars, and trying different Alcoholic Drinks. The combination of rising incomes and changing lifestyles drives market growth and offers opportunities for brands to connect with aspirational end users.
Cambodia Alcoholic Drinks Market Trend
Increased Demand for Craft and Premium Beers
The Cambodia Alcoholic Drinks market is witnessing an upward trend in the consumption of premium and craft beers. End users are increasingly in search of distinctive flavors, artisanal brewing methods, and quality offerings that are indicative of their changing lifestyles and tastes.
This trend is underpinned by the increase in microbreweries and specialty bars in city centers, frequented by locals as well as tourists. The premiumisation trend reflects a desire for unique drinking experiences rather than mass-market products. Brands are reacting with new-age flavors and premium packs to grab this increasing end user segment of sophisticated end users.
Unlock Market Intelligence
Explore the market potential with our data-driven report
Cambodia Alcoholic Drinks Market Opportunity
Growth of Low- and Non-Alcoholic Drinks
The market offers a distinct opportunity in low- and non-alcoholic drinks. End users are becoming more interested in lower-Alcoholic Drinkss, demonstrating an interest in moderation and healthy living while preserving social alcohol use.
This trend stimulates innovation from producers to come up with new, revitalizing, and palatable alternatives. By launching items that blend reduced alcohol content with distinctive flavors, manufacturers are able to address healthy-conscious end users and increase their market share. This segment has high-growth prospects and enables brands to differentiate themselves while adapting to changing end user tastes.
Unlock Market Intelligence
Explore the market potential with our data-driven report
Cambodia Alcoholic Drinks Market Segmentation Analysis

By Type
- Beer
- Cider/Perry
- RTDs
- Spirits
- Wine
The segment with highest market share under Type is Beer, taking a commanding 90% of the Cambodia Alcoholic Drinks market. Beer is still highly popular with all segments of the population because of its flavor, price, and tradition. Local brands and foreign brands are equally popular, with local brands being sought for their price and foreign brands for their quality. The expansion of craft beers and heightened marketing activities, including social media promotions and prize promotions, remain to favor the segment's robust performance.
Beer should continue to grow, with volume sales expanding at a CAGR of approximately 4.8% throughout the forecast period. Increasing disposable incomes, urbanization, and wider distribution by small local food stores, supermarkets, and on-trade channels are expected to drive consumption further, while increasing premiumization and interest in craft will allow for further market growth.
By Sales Channel
- On-Trade
- Off-Trade
The segment with highest market share under Sales Channel segment is Off-Trade, 65% of the market. Off-trade maintains its leadership because it has extensive coverage in urban and rural environments, with small local stores as the most favored outlets. The convenience of local stores, reasonable prices, and the proximity to beer make them the most sought-out choice for buying the beverage in bulk during festivals, weddings, and parties. Supermarkets and new food discount stores are also gaining market share, increasing access to a greater range of products.
On-trade still retains significance in city hubs like Phnom Penh, Siem Reap, and Sihanoukville, fueled by tourism, eating out, and nightlife. Although off-trade continues to be the biggest driver of volume, the growth in young and aspirational end users in cities is set to generate moderate on-trade sales growth, especially for premium beers and social drinking occasions.
Top Companies in Cambodia Alcoholic Drinks Market
The top companies operating in the market include Diageo Plc, Pernod Ricard Groupe, Heineken NV, Khmer Beverages Co Ltd, Ganzberg Brewery Co, Carlsberg A/S, Hite Jinro Co Ltd, etc., are the top players operating in the Cambodia Alcoholic Drinks Market.
Frequently Asked Questions
Related Report
1. Market Segmentation
1.1. Research Scope
1.2. Research Methodology
1.3. Definitions and Assumptions
2. Executive Summary
3. Cambodia Alcoholic Drinks Market Policies, Regulations, and Standards
4. Cambodia Alcoholic Drinks Market Dynamics
4.1. Growth Factors
4.2. Challenges
4.3. Trends
4.4. Opportunities
5. Cambodia Alcoholic Drinks Market Statistics, 2022-2032F
5.1. Market Size & Growth Outlook
5.1.1. By Revenues in US$ Million
5.1.2. By Quantity Sold in Million Litres
5.2. Market Segmentation & Growth Outlook
5.2.1. By Type
5.2.1.1. Beer- Market Insights and Forecast 2022-2032, USD Million
5.2.1.2. Cider/Perry- Market Insights and Forecast 2022-2032, USD Million
5.2.1.3. RTDs- Market Insights and Forecast 2022-2032, USD Million
5.2.1.4. Spirits- Market Insights and Forecast 2022-2032, USD Million
5.2.1.5. Wine- Market Insights and Forecast 2022-2032, USD Million
5.2.2. By Alcohol Content
5.2.2.1. High- Market Insights and Forecast 2022-2032, USD Million
5.2.2.2. Medium- Market Insights and Forecast 2022-2032, USD Million
5.2.2.3. Low- Market Insights and Forecast 2022-2032, USD Million
5.2.3. By Flavor
5.2.3.1. Unflavored- Market Insights and Forecast 2022-2032, USD Million
5.2.3.2. Flavored- Market Insights and Forecast 2022-2032, USD Million
5.2.4. By Packaging Type
5.2.4.1. Glass Bottles- Market Insights and Forecast 2022-2032, USD Million
5.2.4.2. Tins- Market Insights and Forecast 2022-2032, USD Million
5.2.4.3. Plastic Bottles- Market Insights and Forecast 2022-2032, USD Million
5.2.4.4. Others- Market Insights and Forecast 2022-2032, USD Million
5.2.5. By Sales Channel
5.2.5.1. On-Trade- Market Insights and Forecast 2022-2032, USD Million
5.2.5.2. Off-Trade- Market Insights and Forecast 2022-2032, USD Million
5.2.5.2.1. Retail Offline- Market Insights and Forecast 2022-2032, USD Million
5.2.5.2.2. Retail Online- Market Insights and Forecast 2022-2032, USD Million
5.2.6. By Competitors
5.2.6.1. Competition Characteristics
5.2.6.2. Market Share & Analysis
6. Cambodia Beer Market Statistics, 2022-2032F
6.1. Market Size & Growth Outlook
6.1.1. By Revenues in US$ Million
6.1.2. By Quantity Sold in Million Litres
6.2. Market Segmentation & Growth Outlook
6.2.1. By Alcohol Content- Market Insights and Forecast 2022-2032, USD Million
6.2.2. By Flavor- Market Insights and Forecast 2022-2032, USD Million
6.2.3. By Packaging Type- Market Insights and Forecast 2022-2032, USD Million
6.2.4. By Sales Channel- Market Insights and Forecast 2022-2032, USD Million
7. Cambodia Cider/Perry Market Statistics, 2022-2032F
7.1. Market Size & Growth Outlook
7.1.1. By Revenues in US$ Million
7.1.2. By Quantity Sold in Million Litres
7.2. Market Segmentation & Growth Outlook
7.2.1. By Alcohol Content- Market Insights and Forecast 2022-2032, USD Million
7.2.2. By Flavor- Market Insights and Forecast 2022-2032, USD Million
7.2.3. By Packaging Type- Market Insights and Forecast 2022-2032, USD Million
7.2.4. By Sales Channel- Market Insights and Forecast 2022-2032, USD Million
8. Cambodia Ready-to-Drink Market Statistics, 2022-2032F
8.1. Market Size & Growth Outlook
8.1.1. By Revenues in US$ Million
8.1.2. By Quantity Sold in Million Litres
8.2. Market Segmentation & Growth Outlook
8.2.1. By Alcohol Content- Market Insights and Forecast 2022-2032, USD Million
8.2.2. By Flavor- Market Insights and Forecast 2022-2032, USD Million
8.2.3. By Packaging Type- Market Insights and Forecast 2022-2032, USD Million
8.2.4. By Sales Channel- Market Insights and Forecast 2022-2032, USD Million
9. Cambodia Spirits Market Statistics, 2022-2032F
9.1. Market Size & Growth Outlook
9.1.1. By Revenues in US$ Million
9.1.2. By Quantity Sold in Million Litres
9.2. Market Segmentation & Growth Outlook
9.2.1. By Alcohol Content- Market Insights and Forecast 2022-2032, USD Million
9.2.2. By Flavor- Market Insights and Forecast 2022-2032, USD Million
9.2.3. By Packaging Type- Market Insights and Forecast 2022-2032, USD Million
9.2.4. By Sales Channel- Market Insights and Forecast 2022-2032, USD Million
10. Cambodia Wine Market Statistics, 2022-2032F
10.1.Market Size & Growth Outlook
10.1.1. By Revenues in US$ Million
10.1.2. By Quantity Sold in Million Litres
10.2.Market Segmentation & Growth Outlook
10.2.1. By Alcohol Content- Market Insights and Forecast 2022-2032, USD Million
10.2.2. By Flavor- Market Insights and Forecast 2022-2032, USD Million
10.2.3. By Packaging Type- Market Insights and Forecast 2022-2032, USD Million
10.2.4. By Sales Channel- Market Insights and Forecast 2022-2032, USD Million
11. Competitive Outlook
11.1.Company Profiles
11.1.1. Khmer Beverages Co Ltd
11.1.1.1. Business Description
11.1.1.2. Product Portfolio
11.1.1.3. Collaborations & Alliances
11.1.1.4. Recent Developments
11.1.1.5. Financial Details
11.1.1.6. Others
11.1.2. Ganzberg Brewery Co
11.1.2.1. Business Description
11.1.2.2. Product Portfolio
11.1.2.3. Collaborations & Alliances
11.1.2.4. Recent Developments
11.1.2.5. Financial Details
11.1.2.6. Others
11.1.3. Heineken NV
11.1.3.1. Business Description
11.1.3.2. Product Portfolio
11.1.3.3. Collaborations & Alliances
11.1.3.4. Recent Developments
11.1.3.5. Financial Details
11.1.3.6. Others
11.1.4. Carlsberg A/S
11.1.4.1. Business Description
11.1.4.2. Product Portfolio
11.1.4.3. Collaborations & Alliances
11.1.4.4. Recent Developments
11.1.4.5. Financial Details
11.1.4.6. Others
11.1.5. Hite Jinro Co Ltd
11.1.5.1. Business Description
11.1.5.2. Product Portfolio
11.1.5.3. Collaborations & Alliances
11.1.5.4. Recent Developments
11.1.5.5. Financial Details
11.1.5.6. Others
11.1.6. Diageo Plc
11.1.6.1. Business Description
11.1.6.2. Product Portfolio
11.1.6.3. Collaborations & Alliances
11.1.6.4. Recent Developments
11.1.6.5. Financial Details
11.1.6.6. Others
11.1.7. Pernod Ricard Groupe
11.1.7.1. Business Description
11.1.7.2. Product Portfolio
11.1.7.3. Collaborations & Alliances
11.1.7.4. Recent Developments
11.1.7.5. Financial Details
11.1.7.6. Others
12. Disclaimer
| Segment | Sub-Segment |
|---|---|
| By Type |
|
| By Alcohol Content |
|
| By Flavor |
|
| By Packaging Type |
|
| By Sales Channel |
|
Research Methodology
This study followed a structured approach comprising four key phases to assess the size and scope of the electro-oxidation market. The process began with thorough secondary research to collect data on the target market, related markets, and broader industry context. These findings, along with preliminary assumptions and estimates, were then validated through extensive primary research involving industry experts from across the value chain. To calculate the overall market size, both top-down and bottom-up methodologies were employed. Finally, market segmentation and data triangulation techniques were applied to refine and validate segment-level estimations.
Secondary Research
The secondary research phase involved gathering data from a wide range of credible and published sources. This step helped in identifying industry trends, defining market segmentation, and understanding the market landscape and value chain.
Sources consulted during this phase included:
- Company annual reports, investor presentations, and press releases
- Industry white papers and certified publications
- Trade directories and market-recognized databases
- Articles from authoritative authors and reputable journals
- Gold and silver standard websites
Secondary research was critical in mapping out the industry's value chain and monetary flow, identifying key market segments, understanding regional variations, and tracking significant industry developments.
Other key sources:
- Financial disclosures
- Industry associations and trade bodies
- News outlets and business magazines
- Academic journals and research studies
- Paid industry databases
Primary Research
To validate secondary data and gain deeper market insights, primary research was conducted with key stakeholders across both the supply and demand sides of the market.
On the demand side, participants included decision-makers and influencers from end-user industries—such as CIOs, CTOs, and CSOs—who provided first-hand perspectives on market needs, product usage, and future expectations.
On the supply side, interviews were conducted with manufacturers, industry associations, and institutional participants to gather insights into current offerings, product pipelines, and market challenges.
Primary interviews provided critical inputs such as:
- Market size and revenue data
- Product and service breakdowns
- Market forecasts
- Regional and application-specific trends
Stakeholders consulted included:
- Leading OEM and solution providers
- Channel and distribution partners
- End users across various applications
- Independent consultants and industry specialists
Market Size Estimation and Data Triangulation
- Identifying Key Market Participants (Secondary Research)
- Goal: To identify the major players or companies in the target market. This typically involves using publicly available data sources such as industry reports, market research publications, and financial statements of companies.
- Tools: Reports from firms like Gartner, Forrester, Euromonitor, Statista, IBISWorld, and others. Public financial statements, news articles, and press releases from top market players.
- Extracting Earnings of Key Market Participants
- Goal: To estimate the earnings generated from the product or service being analyzed. This step helps in understanding the revenue potential of each market player in a specific geography.
- Methods: Earnings data can be gathered from:
- Publicly available financial reports (for listed companies).
- Interviews and primary data sources from professionals, such as Directors, VPs, SVPs, etc. This is especially useful for understanding more nuanced, internal data that isn't publicly disclosed.
- Annual reports and investor presentations of key players.
- Data Collation and Development of a Relevant Data Model
- Goal: To collate inputs from both primary and secondary sources into a structured, data-driven model for market estimation. This model will incorporate key market KPIs and any independent variables relevant to the market.
- Key KPIs: These could include:
- Market size, growth rate, and demand drivers.
- Industry-specific metrics like market share, average revenue per customer (ARPC), or average deal size.
- External variables, such as economic growth rates, inflation rates, or commodity prices, that could affect the market.
- Data Modeling: Based on this data, the market forecasts are developed for the next 5 years. A combination of trend analysis, scenario modeling, and statistical regression might be used to generate projections.
- Scenario Analysis
- Goal: To test different assumptions and validate how sensitive the market is to changes in key variables (e.g., market demand, regulatory changes, technological disruptions).
- Types of Scenarios:
- Base Case: Based on current assumptions and historical data.
- Best-Case Scenario: Assuming favorable market conditions, regulatory environments, and technological advancements.
- Worst-Case Scenario: Accounting for adverse factors, such as economic downturns, stricter regulations, or unexpected disruptions.


