Brazil Vacuum Cleaner Market Report: Trends, Growth and Forecast (2025-2030)
By Product (Standard, Robotic), By Smart Appliances (Smart, Non-Smart), By Power Source (Corded, Cordless), By Sales Channel (Retail Offline, Retail E-Commerce), By End User (Industrial, Residential, Commercial) ... Read more

|
Major Players
|
Brazil Vacuum Cleaner Market Statistics, 2025
- Market Size Statistics
- Vacuum Cleaner in Brazil is estimated at $ 190 Million.
- The market size is expected to grow to $ 210 Million by 2030.
- Market to register a CAGR of around 1.68% during 2025-30.
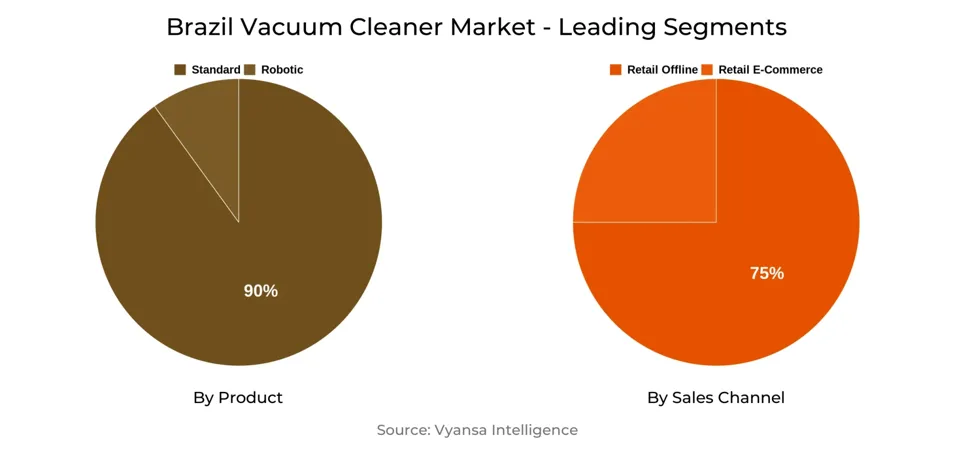
- Product Shares
- Standard Vacuum Cleaners grabbed market share of 90%.
- Standard Vacuum Cleaners to witness a volume CAGR of around 3.18%.
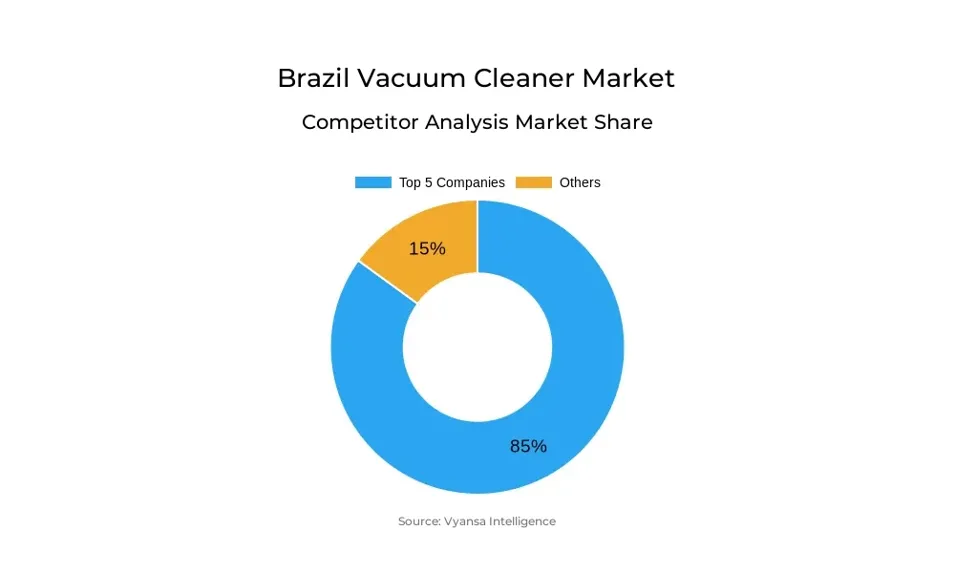
- Competition
- More than 10 companies are actively engaged in producing Vacuum Cleaner in Brazil.
- Top 5 companies acquired 85% of the market share.
- Arno SA, Polimport Comércio & Exportação Ltda, Agf Import Ltda, Electrolux do Brasil SA, Britânia Eletrodomésticos SA etc., are few of the top companies.
- Sales Channel
- Retail Offline grabbed 75% of the market.
Brazil Vacuum Cleaner Market Outlook
The Brazil Vacuum Cleaner Market is on track for solid growth in 2024, fueled mainly by falling prices and increasing competition between domestic and international makers. Relief from inflation and a surge in the number of cheap models available should spur retail volume sales across nearly all segments, with stick and robot vacuum cleaners dominating the pack. Stick models are gaining popularity due to their practicality and suitability for smaller living spaces, while the high inventory of robotic vacuum cleaners is prompting heavy discounting, making them more accessible to both first-time buyers and tech-savvy consumers seeking upgrades.
In spite of this expansion, the market still suffers from constraints within lower socioeconomic groups. These consumers tend to use lower-cost cleaning methods such as brooms and possess limited access to e-commerce websites based on low bancarisation and the absence of credit cards, limiting exposure to bargains and choice.
Traditional vacuum cleaners, particularly cylinder models, should continue to dominate, capturing almost three-quarters of volume sales in 2024. Electrolux do Brasil SA continues to be the dominant player in the market, with ambitions to increase Paraná plant output by 2026 to localize production and ward off increasing competition from brands such as Midea.
At the same time, canister vacuum cleaners still fall because of low-power, legacy models, although higher-power versions may gradually turn this trend around for high-end consumers. Robot vacuum cleaners, although promising, are constrained by price pressures and consumer skepticism because of spotty product quality and subpar first-use experiences. To survive, companies need to emphasize product differentiation and help educate consumers on value-added features.
Brazil Vacuum Cleaner Market Growth Driver
The Brazil Vacuum Cleaner Market is anticipated to record good retail volume growth over the forecast period, due to decreasing prices and intensifying competition. Prices are expected to decrease at constant 2024 prices as inflation eases and new players enter the market. The decrease in price is expected to drive demand in all categories except upright vacuum cleaners.
Robot vacuum cleaners will be driving growth in terms of volume; however, the arrival of Chinese and low-cost brands could continue to compress retailers' and manufacturers' margins. Stick vacuum cleaners are also expected to grow strongly, with advancing household penetration underpinned by convenience of use and fit in with smaller flats.
Brazil Vacuum Cleaner Market Challenge
One of the major issues for the Brazil Vacuum Cleaner Market is low penetration in lower socioeconomic segments because of cost and access issues. While vacuum cleaners are widespread among AB socioeconomic homes, adoption is relatively low in lower-income households. Such customers do not necessarily consider vacuum cleaners to be standard household appliances, particularly in comparison to fundamental appliances such as cookers or fridge-freezers.
The perceived high price of vacuum cleaners, compared to low-cost substitutes such as brooms, discourages buying. Also, restricted access to e-commerce creates another hindrance. Most poor consumers do not have credit cards and enjoy low levels of bancarisation, making it hard for them to leverage the competitive pricing, discounts, and brand choices made available on the internet. These barriers in combination discourage the market from expanding to more income segments.
Unlock Market Intelligence
Explore the market potential with our data-driven report
Brazil Vacuum Cleaner Market Opportunity
The Brazilian Vacuum Cleaner Market offers immense growth opportunities, driven by falling prices and increased competition. As vacuum cleaner prices are likely to decrease at constant 2024 prices—with falling inflation and a higher number of market players—retail volume growth is likely in most categories. Robotic vacuum cleaners provide the highest volume growth opportunity, while the invasion of Chinese and low-price brands threatens to squeeze profit margins.
Conversely, stick vacuum cleaners are set to increase their market share with the increasing number of small apartments and ease of use of the product. With the exception of upright vacuum cleaners, all segments will benefit, and hence it is a good scenario for brands that emphasize low costs, innovation, and convenience.
| Report Coverage | Details |
|---|---|
| Market Forecast | 2025-30 |
| USD Value 2024 | $ 190 Million |
| USD Value 2030 | $ 210 Million |
| CAGR 2025-2030 | 1.68% |
| Largest Category | Standard Vacuum Cleaners segment leads with 90% market share |
| Top Drivers | Falling Prices & Rising Competition to Propel Market Growth |
| Top Challenges | Limited Adoption Among Lower Socioeconomic Segments |
| Top Opportunities | Market Expansion Driven by Price Decline & Competitive Landscape |
| Key Players | Arno SA, Polimport Comércio & Exportação Ltda, Agf Import Ltda, Electrolux do Brasil SA, Britânia Eletrodomésticos SA, Mondial Eletrodomésticos SA, Black & Decker do Brasil Ltda, Midea do Brasil Ltda Arno SA, In This Way Importacao e Comercializacao de Produtos Eletronicos Ltda, Tacony Corporation and Others. |
Unlock Market Intelligence
Explore the market potential with our data-driven report
Brazil Vacuum Cleaner Market Segmentation Analysis
Standard vacuum cleaners command the largest market share in the Brazil Vacuum Cleaner Market. Robotic vacuum cleaners, although yet to lose their novelty label, exhibit great room for penetration in household spaces. But they are unlikely to resume the value growth levels of 2019 during the forecast period. The category is hindered by issues of overstock for retailers and manufacturers, as well as a broad range of brands of varying quality standards, which is compressing prices.
As consumers become more comfortable with the use of robotic vacuum cleaners and comparing many models and functions, most first-time experiences have been disappointing—especially with lower-end units selling short. With this competitive landscape, brands need to highlight distinctive, value-added attributes to enable consumers to identify the virtues of their products and distinguish themselves from the increasing number of SKUs entering the market.
Top Companies in Brazil Vacuum Cleaner Market
The top companies operating in the market include Arno SA, Polimport Comércio & Exportação Ltda, Agf Import Ltda, Electrolux do Brasil SA, Britânia Eletrodomésticos SA, Mondial Eletrodomésticos SA, Black & Decker do Brasil Ltda, Midea do Brasil Ltda Arno SA, In This Way Importacao e Comercializacao de Produtos Eletronicos Ltda, Tacony Corporation, etc., are the top players operating in the Brazil Vacuum Cleaner Market.
Frequently Asked Questions
Related Report
1. Market Segmentation
1.1. Research Scope
1.2. Research Methodology
1.3. Definitions and Assumptions
2. Executive Summary
3. Brazil Vacuum Cleaner Market Policies, Regulations, and Standards
4. Brazil Vacuum Cleaner Market Dynamics
4.1. Growth Factors
4.2. Challenges
4.3. Trends
4.4. Opportunities
5. Brazil Vacuum Cleaner Market Statistics, 2020-2030F
5.1. Market Size & Growth Outlook
5.1.1.By Revenues in US$ Million
5.1.2.By Unit Sold in Thousand Units
5.2. Market Segmentation & Growth Outlook
5.2.1.By Product
5.2.1.1. Standard- Market Insights and Forecast, 2020-2030, USD Million
5.2.1.1.1. Cylinder- Market Insights and Forecast, 2020-2030, USD Million
5.2.1.1.2. Handheld- Market Insights and Forecast, 2020-2030, USD Million
5.2.1.1.3. Stick- Market Insights and Forecast, 2020-2030, USD Million
5.2.1.1.4. Upright- Market Insights and Forecast, 2020-2030, USD Million
5.2.1.1.5. Steam- Market Insights and Forecast, 2020-2030, USD Million
5.2.1.2. Robotic- Market Insights and Forecast, 2020-2030, USD Million
5.2.2.By Smart Appliances
5.2.2.1. Smart- Market Insights and Forecast, 2020-2030, USD Million
5.2.2.2. Non-Smart- Market Insights and Forecast, 2020-2030, USD Million
5.2.3.By Power Source
5.2.3.1. Corded- Market Insights and Forecast, 2020-2030, USD Million
5.2.3.2. Cordless- Market Insights and Forecast, 2020-2030, USD Million
5.2.4.By Sales Channel
5.2.4.1. Retail Offline- Market Insights and Forecast, 2020-2030, USD Million
5.2.4.1.1. Grocery Retailers- Market Insights and Forecast, 2020-2030, USD Million
5.2.4.1.1.1. Hypermarkets- Market Insights and Forecast, 2020-2030, USD Million
5.2.4.1.2. Non-Grocery Retailers- Market Insights and Forecast, 2020-2030, USD Million
5.2.4.1.2.1. General Merchandise Stores- Market Insights and Forecast, 2020-2030, USD Million
5.2.4.1.2.1.1. Department Stores- Market Insights and Forecast, 2020-2030, USD Million
5.2.4.1.2.1.2. Variety Stores- Market Insights and Forecast, 2020-2030, USD Million
5.2.4.1.2.2. Appliances and Electronics Specialists- Market Insights and Forecast, 2020-2030, USD Million
5.2.4.1.2.3. Home Products Specialists- Market Insights and Forecast, 2020-2030, USD Million
5.2.4.2. Retail E-Commerce- Market Insights and Forecast, 2020-2030, USD Million
5.2.5.By End User
5.2.5.1. Industrial- Market Insights and Forecast, 2020-2030, USD Million
5.2.5.2. Residential- Market Insights and Forecast, 2020-2030, USD Million
5.2.5.3. Commercial- Market Insights and Forecast, 2020-2030, USD Million
5.2.6.By Competitors
5.2.6.1. Competition Characteristics
5.2.6.2. Market Share & Analysis
6. Brazil Standard Vacuum Cleaner Market Outlook, 2020-2030F
6.1. Market Size & Growth Outlook
6.1.1.By Revenues in US$ Million
6.1.2.By Unit Sold in Thousand Units
6.2. Market Segmentation & Growth Outlook
6.2.1.By Product - Market Insights and Forecast, 2020-2030, USD Million
6.2.2.By Smart Appliances- Market Insights and Forecast, 2020-2030, USD Million
6.2.3.By Power Source- Market Insights and Forecast, 2020-2030, USD Million
6.2.4.By Sales Channel- Market Insights and Forecast, 2020-2030, USD Million
6.2.5.By End User- Market Insights and Forecast, 2020-2030, USD Million
7. Brazil Robotic Vacuum Cleaner Market Outlook, 2020-2030F
7.1. Market Size & Growth Outlook
7.1.1.By Revenues in US$ Million
7.1.2.By Unit Sold in Thousand Units
7.2. Market Segmentation & Growth Outlook
7.2.1.By Smart Appliances- Market Insights and Forecast, 2020-2030, USD Million
7.2.2.By Power Source- Market Insights and Forecast, 2020-2030, USD Million
7.2.3.By Sales Channel- Market Insights and Forecast, 2020-2030, USD Million
7.2.4.By End User- Market Insights and Forecast, 2020-2030, USD Million
8. Competitive Outlook
8.1. Company Profiles
8.1.1.Polimport Comércio & Exportação Ltda
8.1.1.1. Business Description
8.1.1.2. Product Portfolio
8.1.1.3. Collaborations & Alliances
8.1.1.4. Recent Developments
8.1.1.5. Financial Details
8.1.1.6. Others
8.1.2.Agf Import Ltda
8.1.2.1. Business Description
8.1.2.2. Product Portfolio
8.1.2.3. Collaborations & Alliances
8.1.2.4. Recent Developments
8.1.2.5. Financial Details
8.1.2.6. Others
8.1.3.In This Way Importacao e Comercializacao de Produtos Eletronicos Ltda
8.1.3.1. Business Description
8.1.3.2. Product Portfolio
8.1.3.3. Collaborations & Alliances
8.1.3.4. Recent Developments
8.1.3.5. Financial Details
8.1.3.6. Others
8.1.4.Electrolux do Brasil SA
8.1.4.1. Business Description
8.1.4.2. Product Portfolio
8.1.4.3. Collaborations & Alliances
8.1.4.4. Recent Developments
8.1.4.5. Financial Details
8.1.4.6. Others
8.1.5.Britânia Eletrodomésticos SA
8.1.5.1. Business Description
8.1.5.2. Product Portfolio
8.1.5.3. Collaborations & Alliances
8.1.5.4. Recent Developments
8.1.5.5. Financial Details
8.1.5.6. Others
8.1.6.Mondial Eletrodomésticos SA
8.1.6.1. Business Description
8.1.6.2. Product Portfolio
8.1.6.3. Collaborations & Alliances
8.1.6.4. Recent Developments
8.1.6.5. Financial Details
8.1.6.6. Others
8.1.7.Black & Decker do Brasil Ltda
8.1.7.1. Business Description
8.1.7.2. Product Portfolio
8.1.7.3. Collaborations & Alliances
8.1.7.4. Recent Developments
8.1.7.5. Financial Details
8.1.7.6. Others
8.1.8.Midea do Brasil Ltda Arno SA
8.1.8.1. Business Description
8.1.8.2. Product Portfolio
8.1.8.3. Collaborations & Alliances
8.1.8.4. Recent Developments
8.1.8.5. Financial Details
8.1.8.6. Others
8.1.9.Arno SA
8.1.9.1. Business Description
8.1.9.2. Product Portfolio
8.1.9.3. Collaborations & Alliances
8.1.9.4. Recent Developments
8.1.9.5. Financial Details
8.1.9.6. Others
8.1.10. Tacony Corporation
8.1.10.1. Business Description
8.1.10.2. Product Portfolio
8.1.10.3. Collaborations & Alliances
8.1.10.4. Recent Developments
8.1.10.5. Financial Details
8.1.10.6. Others
9. Disclaimer
| Segment | Sub-Segment |
|---|---|
| By Product |
|
| By Smart Appliances |
|
| By Power Source |
|
| By Sales Channel |
|
| By End User |
|
Research Methodology
This study followed a structured approach comprising four key phases to assess the size and scope of the electro-oxidation market. The process began with thorough secondary research to collect data on the target market, related markets, and broader industry context. These findings, along with preliminary assumptions and estimates, were then validated through extensive primary research involving industry experts from across the value chain. To calculate the overall market size, both top-down and bottom-up methodologies were employed. Finally, market segmentation and data triangulation techniques were applied to refine and validate segment-level estimations.
Secondary Research
The secondary research phase involved gathering data from a wide range of credible and published sources. This step helped in identifying industry trends, defining market segmentation, and understanding the market landscape and value chain.
Sources consulted during this phase included:
- Company annual reports, investor presentations, and press releases
- Industry white papers and certified publications
- Trade directories and market-recognized databases
- Articles from authoritative authors and reputable journals
- Gold and silver standard websites
Secondary research was critical in mapping out the industry's value chain and monetary flow, identifying key market segments, understanding regional variations, and tracking significant industry developments.
Other key sources:
- Financial disclosures
- Industry associations and trade bodies
- News outlets and business magazines
- Academic journals and research studies
- Paid industry databases
Primary Research
To validate secondary data and gain deeper market insights, primary research was conducted with key stakeholders across both the supply and demand sides of the market.
On the demand side, participants included decision-makers and influencers from end-user industries—such as CIOs, CTOs, and CSOs—who provided first-hand perspectives on market needs, product usage, and future expectations.
On the supply side, interviews were conducted with manufacturers, industry associations, and institutional participants to gather insights into current offerings, product pipelines, and market challenges.
Primary interviews provided critical inputs such as:
- Market size and revenue data
- Product and service breakdowns
- Market forecasts
- Regional and application-specific trends
Stakeholders consulted included:
- Leading OEM and solution providers
- Channel and distribution partners
- End users across various applications
- Independent consultants and industry specialists
Market Size Estimation and Data Triangulation
- Identifying Key Market Participants (Secondary Research)
- Goal: To identify the major players or companies in the target market. This typically involves using publicly available data sources such as industry reports, market research publications, and financial statements of companies.
- Tools: Reports from firms like Gartner, Forrester, Euromonitor, Statista, IBISWorld, and others. Public financial statements, news articles, and press releases from top market players.
- Extracting Earnings of Key Market Participants
- Goal: To estimate the earnings generated from the product or service being analyzed. This step helps in understanding the revenue potential of each market player in a specific geography.
- Methods: Earnings data can be gathered from:
- Publicly available financial reports (for listed companies).
- Interviews and primary data sources from professionals, such as Directors, VPs, SVPs, etc. This is especially useful for understanding more nuanced, internal data that isn't publicly disclosed.
- Annual reports and investor presentations of key players.
- Data Collation and Development of a Relevant Data Model
- Goal: To collate inputs from both primary and secondary sources into a structured, data-driven model for market estimation. This model will incorporate key market KPIs and any independent variables relevant to the market.
- Key KPIs: These could include:
- Market size, growth rate, and demand drivers.
- Industry-specific metrics like market share, average revenue per customer (ARPC), or average deal size.
- External variables, such as economic growth rates, inflation rates, or commodity prices, that could affect the market.
- Data Modeling: Based on this data, the market forecasts are developed for the next 5 years. A combination of trend analysis, scenario modeling, and statistical regression might be used to generate projections.
- Scenario Analysis
- Goal: To test different assumptions and validate how sensitive the market is to changes in key variables (e.g., market demand, regulatory changes, technological disruptions).
- Types of Scenarios:
- Base Case: Based on current assumptions and historical data.
- Best-Case Scenario: Assuming favorable market conditions, regulatory environments, and technological advancements.
- Worst-Case Scenario: Accounting for adverse factors, such as economic downturns, stricter regulations, or unexpected disruptions.


