Brazil Sports Nutrition Market Report: Trends, Growth and Forecast (2026-2032)
Product Type (Sports Protein Products (Protein/Energy Bars, Sports Protein Powder, Sports Protein RTD), Sports Non-Protein Products), Sales Channel (Retail Offline, Retail Online), Ingredients (Vitamins and Minerals, Proteins and Amino Acids, Carbohydrates, Probiotics, Botanicals/Herbals, Others), Functionality (Energy, Muscle growth, Hydration, Weight Management, Others), End User (Bodybuilders, Athletes, Lifestyle Users) ... Read more
|
Major Players
|
Brazil Sports Nutrition Market Statistics and Insights, 2026
- Market Size Statistics
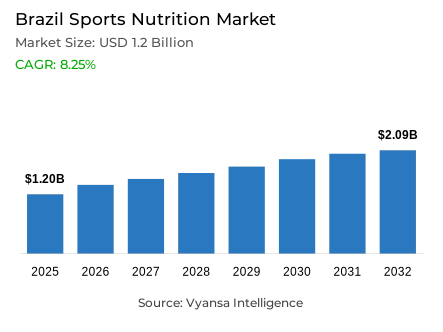
- Sports nutrition in Brazil is estimated at USD 1.2 billion.
- The market size is expected to grow to USD 2.09 billion by 2032.
- Market to register a cagr of around 8.25% during 2026-32.
- Product Type Shares
- Sports protein products grabbed market share of 65%.
- Competition
- More than 20 companies are actively engaged in producing sports nutrition in Brazil.
- Top 5 companies acquired around 60% of the market share.
- ADS Laboratório Nutricional Ltda; Barrind Industria & Comercio De Alimentos LTDA; Vida Forte Nutrientes Indústria e Comércio de Produtos Naturais Ltda; Integralmédica Suplementos Nutricionais Ltda; Growth Supplements Produtos Alimentícios Ltda etc., are few of the top companies.
- Sales Channel
- Retail offline grabbed 65% of the market.
Brazil Sports Nutrition Market Outlook
Sports nutrition in Brazil is expanding, with its market projected around $1.2 billion in 2025 and rising around $2.09 billion in 2032, clocking a CAGR of roughly around 8.25% during 2026-32. Increased incomes and awareness of health are motivating end users to consume protein powders, protein/energy bars, and ready-to-drink products as part of their daily lives. Both frequent gym end users and new end users are fueling the growth.
Sports protein products continues to dominate the market, capturing around 65% of total value sales in sports nutrition segments. Sports protein powder leads, as it is widely used for muscle growth and recovery, while protein/energy bars are becoming popular due to their convenience. At the same time, plant-based, vegan, and lactose-free options are gaining attention, showing a shift toward healthier and more sustainable choices.
The competition in the market is growing, as the top five players captures around 60% of the market. Major big brands stay ahead of this competition with innovative product launches and promotion, while small players concentrate on specialty products and ingredients to attract new end users. Price, variety, and brand loyalty are likely to define the market in coming years.
Retail offline is the largest distribution channel with around 65% of the total value. Supermarkets are the significant driver providing shelf space for protein powders, bars, and ready-to-drink products. Specialized outlets, gyms, and pharmacies support this through counseling, product promotion, and facilitating impulse buying, thus making retail offline the foundation for the distribution of sports protein products.

Brazil Sports Nutrition Market Growth DriverRising Health Awareness and Income Levels Strengthen Sports Nutrition Use
With the rising income levels and a stronger focus on health encourage end users to incorporate sports nutrition products into their lifestyles. As average annual income grew in 2025, now end users have more purchasing power to invest in supplements that support fitness and wellness. The growing interest to stay physically and mentally fit is encouraging end users to try products like protein powders, protein/energy bars, and other performance oriented products.
This lifestyle shift is evident among both experienced end users and new end users who are entering the category. Regular gym-goers still purchase conventional protein powders, but first time end users are more likely to purchase ready-to-drink proteins and bars as an entry point to their health goals. Higher disposable income combined with increased health awareness is turning sports nutrition into a regular purchase among a larger share of end users.
Brazil Sports Nutrition Market ChallengeRising Ingredient Costs and Heavy Dependence on Imports
The industry is dealing with problems due to the lack of enough local sources for major ingredients such as whey and other proteins. The majority of manufacturers rely on imports, which subjects them to international price fluctuations and foreign exchange risks. As international prices go up, the cost of manufacturing rises, and companies struggle to maintain product prices. This situation makes it harder for companies to meet the growing demand while maintaining good quality and fair prices.
Moreover, this affects mostly the small and medium sized brands, as they have less power to deal with rising costs or secure long term supply deals. This limits their ability to offer new products or compete with bigger players. End users are also becoming more price conscious, making affordability a major concern. Unless Brazil increases its domestic ingredient supply and production over the next few years, such cost and import concerns may decelerate market expansion between 2026 and 2032.
Unlock Market Intelligence
Explore the market potential with our data-driven report
Brazil Sports Nutrition Market TrendGrowing Shift Toward Convenient Protein Formats
The end users prefer products that fit their busy lives while supporting their healthy lifestyles. Protein/energy bars are gaining popularity as a convenient alternative to small meals, providing both flavor and nutrition in a convenience package. This change reflects how end users are embracing more active, in-person lifestyles after the pandemic, looking for simple ways to incorporate protein into their daily routines.
Additionally, demand for specialized products for particular dietary needs is on the rise. Natural proteins are gaining attention as end users seek cleaner and more sustainable solutions. With the introduction of innovative formulations blending protein with other functional ingredients indicates how the industry is shifting away from conventional whey based protein products, reflecting a long term movement toward inclusivity and diversity in sports nutrition products.
Brazil Sports Nutrition Market OpportunityRising Scope for Plant-Based Protein Innovation
A revolutionary plant based protein formulation is changing the nutrition landscape with the development of a carioca bean based protein concentrate. With almost 80g protein per 100g, this ingredient is on par with whey in nutritional value but provides additional digestive and cholesterol benefits. Its versatility across product applications such as functional drinks, bakery, and supplements boosts its appeal among end users who prefer natural and nutrient filled products.
Increased production and cost optimisation by 2026–2032 will make this protein source more affordable for mass applications. As volumes are scaled up by manufacturers, its use in sports nutrition may increase substantially, complementing increasing demand for sustainable and plant based options. Moreover, its potential for international trade could strengthen the country's position in the global high protein products segment.
Unlock Market Intelligence
Explore the market potential with our data-driven report
Brazil Sports Nutrition Market Segmentation Analysis

By Product Type
- Sports Protein Products
- Sports Non-Protein Products
Sports protein products dominate the segment, capturing around 65% of value sales in sports nutrition. Among these, sports protein powder continues to lead due to its strong position among end users looking for muscle gain and recovery. Whey protein has become popular as a staple sports nutrition product within the fitness culture thanks to its numerous benefits which are now well known and trusted.
The segment keeps innovating with increased product variety, new flavors, and incorporation of functional ingredients like BCAAs and vitamins. These innovations are contributing to sustaining demand even though the market is maturing. With increasing fitness awareness and movement towards convenient nutrition and protein-based products are expected to maintain leadership and drive the overall growth of the market in the coming years.
By Sales Channel
- Retail Offline
- Retail Online
The segment with the highest market share under sales channel is retail offline. Retail offline, including supermarkets, specialist stores, and pharmacies, accounts for around 65% of total market share in Brazil. Supermarkets are the key players in this channel, providing dedicates shelf space for protein powders, protein/energy bars, and ready-to-drink products. Their visibility makes it easy for end users to discover new products while making regular purchases. Specialty stores and fitness clubs complement this by giving personalized guidance, encouraging loyalty among active end users and promoting targeted use of product like creatine or high protein products.
Pharmacies plays a significantly role in retail offline, especially in impulse buying of protein bars and protein drinks. Their credibility and trusted presence make them a favorite place for end users to buy high quality products. The physical visibility and direct experience with products continue to be major strengths of retail offline channel.
List of Companies Covered in Brazil Sports Nutrition Market
The companies listed below are highly influential in the Brazil sports nutrition market, with a significant market share and a strong impact on industry developments.
- ADS Laboratório Nutricional Ltda
- Barrind Industria & Comercio De Alimentos LTDA
- Vida Forte Nutrientes Indústria e Comércio de Produtos Naturais Ltda
- Integralmédica Suplementos Nutricionais Ltda
- Growth Supplements Produtos Alimentícios Ltda
- Supley Laboratório de Alimentos & Suplementos Nutricionais Ltda
- Probiótica Laboratórios Ltda
- Dux Comercio e Importação Ltda
- INP Indústria de Alimentos Ltda
- GDS Grow Dietary Supplements do Brasil
Frequently Asked Questions
Related Report
1. Market Segmentation
1.1. Research Scope
1.2. Research Methodology
1.3. Definitions and Assumptions
2. Executive Summary
3. Brazil Sports Nutrition Market Policies, Regulations, and Standards
4. Brazil Sports Nutrition Market Dynamics
4.1. Growth Factors
4.2. Challenges
4.3. Trends
4.4. Opportunities
5. Brazil Sports Nutrition Market Statistics, 2022-2032F
5.1. Market Size & Growth Outlook
5.1.1.By Revenues in US$ Million
5.2. Market Segmentation & Growth Outlook
5.2.1.By Product Type
5.2.1.1. Sports Protein Products- Market Insights and Forecast 2022-2032, USD Million
5.2.1.1.1. Protein/Energy Bars- Market Insights and Forecast 2022-2032, USD Million
5.2.1.1.2. Sports Protein Powder- Market Insights and Forecast 2022-2032, USD Million
5.2.1.1.3. Sports Protein RTD- Market Insights and Forecast 2022-2032, USD Million
5.2.1.2. Sports Non-Protein Products- Market Insights and Forecast 2022-2032, USD Million
5.2.2.By Sales Channel
5.2.2.1. Retail Offline- Market Insights and Forecast 2022-2032, USD Million
5.2.2.2. Retail Online- Market Insights and Forecast 2022-2032, USD Million
5.2.3.By Ingredients
5.2.3.1. Vitamins and Minerals- Market Insights and Forecast 2022-2032, USD Million
5.2.3.2. Proteins and Amino Acids- Market Insights and Forecast 2022-2032, USD Million
5.2.3.3. Carbohydrates- Market Insights and Forecast 2022-2032, USD Million
5.2.3.4. Probiotics- Market Insights and Forecast 2022-2032, USD Million
5.2.3.5. Botanicals/Herbals- Market Insights and Forecast 2022-2032, USD Million
5.2.3.6. Others- Market Insights and Forecast 2022-2032, USD Million
5.2.4.By Functionality
5.2.4.1. Energy- Market Insights and Forecast 2022-2032, USD Million
5.2.4.2. Muscle growth- Market Insights and Forecast 2022-2032, USD Million
5.2.4.3. Hydration- Market Insights and Forecast 2022-2032, USD Million
5.2.4.4. Weight Management- Market Insights and Forecast 2022-2032, USD Million
5.2.4.5. Others- Market Insights and Forecast 2022-2032, USD Million
5.2.5.By End User
5.2.5.1. Bodybuilders- Market Insights and Forecast 2022-2032, USD Million
5.2.5.2. Athletes- Market Insights and Forecast 2022-2032, USD Million
5.2.5.3. Lifestyle Users- Market Insights and Forecast 2022-2032, USD Million
5.2.6.By Competitors
5.2.6.1. Competition Characteristics
5.2.6.2. Market Share & Analysis
6. Brazil Protein Products Sports Nutrition Market Statistics, 2022-2032F
6.1. Market Size & Growth Outlook
6.1.1.By Revenues in US$ Million
6.2. Market Segmentation & Growth Outlook
6.2.1.By Sales Channel- Market Insights and Forecast 2022-2032, USD Million
6.2.2.By Ingredients- Market Insights and Forecast 2022-2032, USD Million
6.2.3.By Functionality- Market Insights and Forecast 2022-2032, USD Million
6.2.4.By End User- Market Insights and Forecast 2022-2032, USD Million
7. Brazil Non-Protein Products Sports Nutrition Market Statistics, 2022-2032F
7.1. Market Size & Growth Outlook
7.1.1.By Revenues in US$ Million
7.2. Market Segmentation & Growth Outlook
7.2.1.By Sales Channel- Market Insights and Forecast 2022-2032, USD Million
7.2.2.By Ingredients- Market Insights and Forecast 2022-2032, USD Million
7.2.3.By Functionality- Market Insights and Forecast 2022-2032, USD Million
7.2.4.By End User- Market Insights and Forecast 2022-2032, USD Million
8. Competitive Outlook
8.1. Company Profiles
8.1.1.Integralmédica Suplementos Nutricionais Ltda
8.1.1.1. Business Description
8.1.1.2. Product Portfolio
8.1.1.3. Collaborations & Alliances
8.1.1.4. Recent Developments
8.1.1.5. Financial Details
8.1.1.6. Others
8.1.2.Growth Supplements Produtos Alimentícios Ltda
8.1.2.1. Business Description
8.1.2.2. Product Portfolio
8.1.2.3. Collaborations & Alliances
8.1.2.4. Recent Developments
8.1.2.5. Financial Details
8.1.2.6. Others
8.1.3.Supley Laboratório de Alimentos & Suplementos Nutricionais Ltda
8.1.3.1. Business Description
8.1.3.2. Product Portfolio
8.1.3.3. Collaborations & Alliances
8.1.3.4. Recent Developments
8.1.3.5. Financial Details
8.1.3.6. Others
8.1.4.Probiótica Laboratórios Ltda
8.1.4.1. Business Description
8.1.4.2. Product Portfolio
8.1.4.3. Collaborations & Alliances
8.1.4.4. Recent Developments
8.1.4.5. Financial Details
8.1.4.6. Others
8.1.5.Dux Comercio e Importação Ltda
8.1.5.1. Business Description
8.1.5.2. Product Portfolio
8.1.5.3. Collaborations & Alliances
8.1.5.4. Recent Developments
8.1.5.5. Financial Details
8.1.5.6. Others
8.1.6.ADS Laboratório Nutricional Ltda
8.1.6.1. Business Description
8.1.6.2. Product Portfolio
8.1.6.3. Collaborations & Alliances
8.1.6.4. Recent Developments
8.1.6.5. Financial Details
8.1.6.6. Others
8.1.7.Barrind Indústria & Comércio de Alimentos LTDA
8.1.7.1. Business Description
8.1.7.2. Product Portfolio
8.1.7.3. Collaborations & Alliances
8.1.7.4. Recent Developments
8.1.7.5. Financial Details
8.1.7.6. Others
8.1.8.Vida Forte Nutrientes Indústria e Comércio de Produtos Naturais Ltda
8.1.8.1. Business Description
8.1.8.2. Product Portfolio
8.1.8.3. Collaborations & Alliances
8.1.8.4. Recent Developments
8.1.8.5. Financial Details
8.1.8.6. Others
8.1.9.INP Indústria de Alimentos Ltda
8.1.9.1. Business Description
8.1.9.2. Product Portfolio
8.1.9.3. Collaborations & Alliances
8.1.9.4. Recent Developments
8.1.9.5. Financial Details
8.1.9.6. Others
8.1.10. GDS Grow Dietary Supplements do Brasil
8.1.10.1. Business Description
8.1.10.2. Product Portfolio
8.1.10.3. Collaborations & Alliances
8.1.10.4. Recent Developments
8.1.10.5. Financial Details
8.1.10.6. Others
9. Disclaimer
| Segment | Sub-Segment |
|---|---|
| By Product Type |
|
| By Sales Channel |
|
| By Ingredients |
|
| By Functionality |
|
| By End User |
|
Research Methodology
This study followed a structured approach comprising four key phases to assess the size and scope of the electro-oxidation market. The process began with thorough secondary research to collect data on the target market, related markets, and broader industry context. These findings, along with preliminary assumptions and estimates, were then validated through extensive primary research involving industry experts from across the value chain. To calculate the overall market size, both top-down and bottom-up methodologies were employed. Finally, market segmentation and data triangulation techniques were applied to refine and validate segment-level estimations.
Secondary Research
The secondary research phase involved gathering data from a wide range of credible and published sources. This step helped in identifying industry trends, defining market segmentation, and understanding the market landscape and value chain.
Sources consulted during this phase included:
- Company annual reports, investor presentations, and press releases
- Industry white papers and certified publications
- Trade directories and market-recognized databases
- Articles from authoritative authors and reputable journals
- Gold and silver standard websites
Secondary research was critical in mapping out the industry's value chain and monetary flow, identifying key market segments, understanding regional variations, and tracking significant industry developments.
Other key sources:
- Financial disclosures
- Industry associations and trade bodies
- News outlets and business magazines
- Academic journals and research studies
- Paid industry databases
Primary Research
To validate secondary data and gain deeper market insights, primary research was conducted with key stakeholders across both the supply and demand sides of the market.
On the demand side, participants included decision-makers and influencers from end-user industries—such as CIOs, CTOs, and CSOs—who provided first-hand perspectives on market needs, product usage, and future expectations.
On the supply side, interviews were conducted with manufacturers, industry associations, and institutional participants to gather insights into current offerings, product pipelines, and market challenges.
Primary interviews provided critical inputs such as:
- Market size and revenue data
- Product and service breakdowns
- Market forecasts
- Regional and application-specific trends
Stakeholders consulted included:
- Leading OEM and solution providers
- Channel and distribution partners
- End users across various applications
- Independent consultants and industry specialists
Market Size Estimation and Data Triangulation
- Identifying Key Market Participants (Secondary Research)
- Goal: To identify the major players or companies in the target market. This typically involves using publicly available data sources such as industry reports, market research publications, and financial statements of companies.
- Tools: Reports from firms like Gartner, Forrester, Euromonitor, Statista, IBISWorld, and others. Public financial statements, news articles, and press releases from top market players.
- Extracting Earnings of Key Market Participants
- Goal: To estimate the earnings generated from the product or service being analyzed. This step helps in understanding the revenue potential of each market player in a specific geography.
- Methods: Earnings data can be gathered from:
- Publicly available financial reports (for listed companies).
- Interviews and primary data sources from professionals, such as Directors, VPs, SVPs, etc. This is especially useful for understanding more nuanced, internal data that isn't publicly disclosed.
- Annual reports and investor presentations of key players.
- Data Collation and Development of a Relevant Data Model
- Goal: To collate inputs from both primary and secondary sources into a structured, data-driven model for market estimation. This model will incorporate key market KPIs and any independent variables relevant to the market.
- Key KPIs: These could include:
- Market size, growth rate, and demand drivers.
- Industry-specific metrics like market share, average revenue per customer (ARPC), or average deal size.
- External variables, such as economic growth rates, inflation rates, or commodity prices, that could affect the market.
- Data Modeling: Based on this data, the market forecasts are developed for the next 5 years. A combination of trend analysis, scenario modeling, and statistical regression might be used to generate projections.
- Scenario Analysis
- Goal: To test different assumptions and validate how sensitive the market is to changes in key variables (e.g., market demand, regulatory changes, technological disruptions).
- Types of Scenarios:
- Base Case: Based on current assumptions and historical data.
- Best-Case Scenario: Assuming favorable market conditions, regulatory environments, and technological advancements.
- Worst-Case Scenario: Accounting for adverse factors, such as economic downturns, stricter regulations, or unexpected disruptions.


