Brazil Energy Drink Market Report: Trends, Growth and Forecast (2025-2030)
By Product Type (Alcoholic, Non-Alcoholic), By Consumption (Drinks, Shots, Mixers), By Nature (Conventional, Natural/Organic), By Flavour (Flavoured, Unflavoured), By Packaging (Bottles, Metal Cans, Pouches, Others), By Packaging Size (Small, Medium, Large), By End Users (Teenagers, Adults, Geriatric), By Sales Channel (On-Trade, Off-Trade) ... Read more

|
Major Players
|
Brazil Energy Drink Market Statistics, 2025
- Market Size Statistics
- Energy Drink in Brazil is estimated at $ 2.13 Billion.
- The market size is expected to grow to $ 3.47 Billion by 2030.
- Market to register a CAGR of around 8.47% during 2025-30.
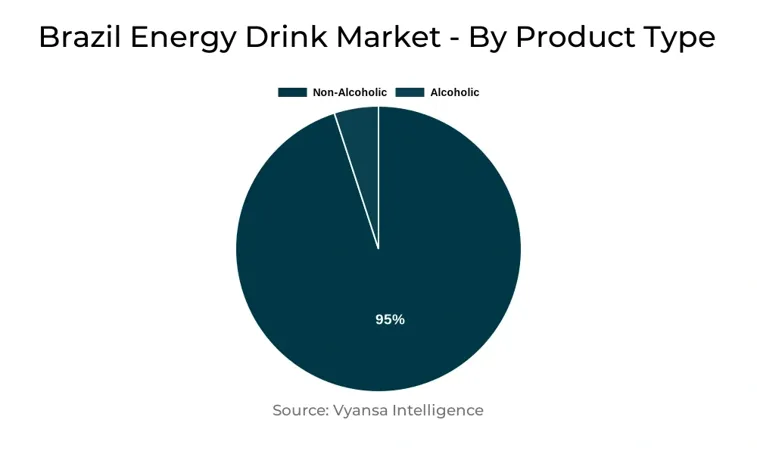
- Product Shares
- Non Alcoholic Energy Drinks grabbed market share of 95%.
- Non Alcoholic Energy Drinks to witness a volume CAGR of around 8.83%.
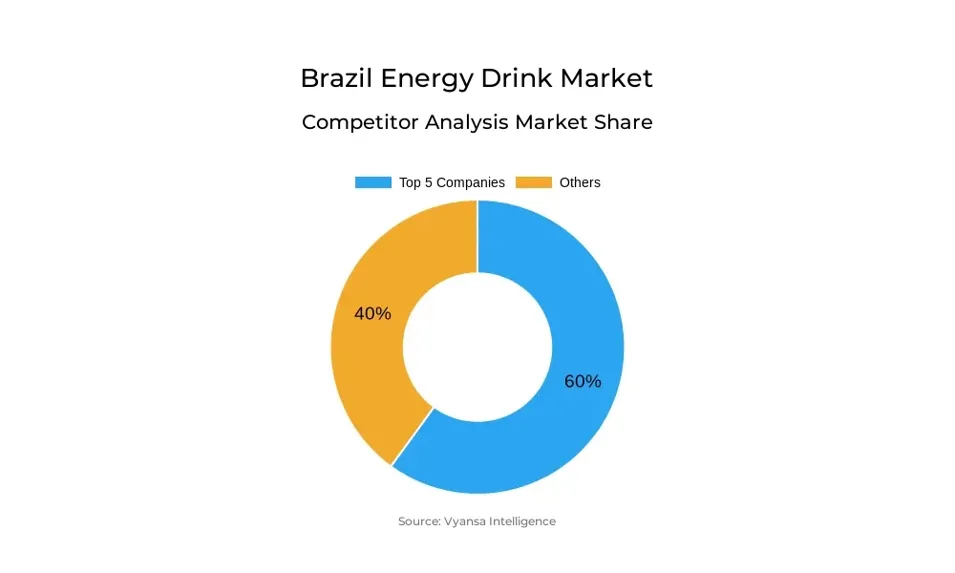
- Competition
- More than 10 companies are actively engaged in producing Energy Drink in Brazil.
- Top 5 companies acquired 60% of the market share.
- Cervejaria Petrópolis SA, NRG Trading Ltda, Cia Brasileira de Bebidas, Coca-Cola Indústrias Ltda, Red Bull do Brasil Ltda etc., are few of the top companies.
- Sales Channel
- Off-Trade grabbed 70% of the market.
Brazil Energy Drink Market Outlook
Brazil energy drinks market is set to maintain its robust pace, with an off-trade volume double-digit CAGR between 2025 and 2030. Standard energy drinks will experience marginally higher growth than the reduced sugar options. Drivers of consumption including the stimulating action of caffeine, linking with social occasions, and calls for productivity increases will be in play. The ascendance of new taste, pack sizes such as PET bottles, and sponsorship initiatives through esports and natural ingredients will encourage more people to try them.
Wellness and health trends are destined to transform the marketplace. Since energy drinks remain perceived as not being as healthy, companies are shifting to natural and functional product development. Beverages with yerba mate, guarana, açai, and local ingredients will gain traction. Companies such as Monster Energy have brought in juice-based product lines, and others such as Real Company emphasize additional benefits like vitamins, hydration, and immune system support. These are likely to encourage overcoming negative attitudes and drive wider everyday consumption.
Distribution will remain dominated by supermarkets, small grocers, and warehouse clubs, but prospects are increasing for drugstores, particularly as health-oriented claims gain popularity. The on-trade channel is significant, notably for social consumption, with a frequent practice of combining energy drinks with alcohol—though raising health concerns for at-risk consumers and potentially capping per capita consumption.
Lastly, packaging innovation will come into play. Though aluminium cans rule, PET bottles—better value and more convenient for group consumption—are gaining traction, particularly among new brands. Their use both in retail and on-trade will be expected to drive market growth and enhance cost-effectiveness for manufacturers.
Brazil Energy Drink Market Growth Driver
Energy drinks remain on the rise in Brazil with another year of double-digit off-trade volume growth in 2024. Behind this high demand is the tasty appeal and energizing effect of caffeine that enhances wakefulness and productivity. Increasingly, the beverages are being consumed while at work, studying, or out with friends. Both regular and low sugar versions are on the rise, although regular remains the bigger share.
In addition, the category is being boosted by product innovation in the form of new flavors, packaging, and formats such as PET bottles, which are increasing energy drinks' availability to more consumers. New players with a focus on esports and plant or natural ingredients are also contributing to expansion. Although Brazil is fourth in the world by total consumption, its per capita consumption is low relative to countries such as Guatemala and Chile, and so has great potential for future growth up to 2025-30.
Brazil Energy Drink Market Trend
The energy drinks market in Brazil is likely to experience a double-digit off-trade volume CAGR over 2025-30, with standard energy drinks recording marginally higher growth than reduced sugar versions. Although energy drinks remain firmly associated with gaming and nightlife, they are rarely viewed as healthy options. There is a slow change, however, with consumers increasingly seeking out brands that provide natural ingredients and claimed health benefits.
While there has been some innovation in recent years, innovation with natural ingredients is still not widespread. A prime example is Monster Energy's Juice brand, which bases its carbonated energy drinks on juice. Yet there is potential for greater diversification to enhance the natural profile of the category. Ingredients such as açai and caffeine derived from guarana are starting to gain traction, responding to local consumer demand for naturally derived products and reinforcing Brazil's credentials and changing consumer attitudes.
Unlock Market Intelligence
Explore the market potential with our data-driven report
Brazil Energy Drink Market Opportunity
Brazilian energy drinks are moving away from traditional caffeine-based beverages to more functional options. Emerging offerings now contain ingredients that facilitate digestion, enhance hydration, and increase immunity. For example, Real Company introduced three flavors of its energy drink—mango passion fruit, pineapple mint, and watermelon lemon—comprising 100mg of yerba mate and guarana caffeine, just 33 calories, and no preservatives or dyes. These beverages provide electrolytes, as well as vitamins C and B, and reflect a more natural, health-driven image.
The future of the energy drink industry is personalisation, with firms using DNA testing and customer information to formulate customized versions. This enables people to select ingredients and dosages from their genetic and lifestyle profiles. With customers wanting increasingly specific benefits, this science and personalised approach is set to become a leading force behind energy drink development in the forecast period.
| Report Coverage | Details |
|---|---|
| Market Forecast | 2025-30 |
| USD Value 2024 | $ 2.13 Billion |
| USD Value 2030 | $ 3.47 Billion |
| CAGR 2025-2030 | 8.47% |
| Largest Category | Non Alcoholic Energy Drinks segment leads with 95% market share |
| Top Drivers | Rising Consumption Driven by Functional Appeal and Innovation |
| Top Trends | Traction Towards Natural and Healthier Energy Drink Variants |
| Top Opportunities | Rising Demand for Functional & Personalised Beverages |
| Key Players | Cervejaria Petrópolis SA, NRG Trading Ltda, Cia Brasileira de Bebidas, Coca-Cola Indústrias Ltda, Red Bull do Brasil Ltda, Bebidas Grassi Do Brasil Ltda, Monster Beverage Corp, Viton 44 Indústria, Comércio e Exportação de Alimentos Ltda, GlobalBev Bebidas & Alimentos SA, Ambev and Others. |
Unlock Market Intelligence
Explore the market potential with our data-driven report
Brazil Energy Drink Market Segmentation Analysis
The highest market share segment in the Brazil Energy Drinks Market is Off-Trade. Supermarkets dominate, and they account for almost half of the off-trade volume sales in 2024. People tend to favor them due to vast availability of well-known brands and the convenience of energy drink buying being done alongside regular shopping for groceries. Even small neighborhood supermarkets are seeing rapid expansion, particularly for impulse purchases, as they provide convenience and easy access to single-serve packages.
Warehouse clubs are also in a good position, due to their bulk purchasing opportunities with improved cost benefit for average consumers. In the meantime, health and beauty specialists, particularly drugstores, are a potential retail venue. Since they expand in urban regions and are attached to health-oriented buying behaviors, product placement of functional or healthy energy drink variants could make them more relevant for this channel. On-trade consumption is still significant, particularly among alcoholic drink mixes.
Top Companies in Brazil Energy Drink Market
The top companies operating in the market include Cervejaria Petrópolis SA, NRG Trading Ltda, Cia Brasileira de Bebidas, Coca-Cola Indústrias Ltda, Red Bull do Brasil Ltda, Bebidas Grassi Do Brasil Ltda, Monster Beverage Corp, Viton 44 Indústria, Comércio e Exportação de Alimentos Ltda, GlobalBev Bebidas & Alimentos SA, Ambev, etc., are the top players operating in the Brazil Energy Drink Market.
Frequently Asked Questions
Related Report
1. Market Segmentation
1.1. Research Scope
1.2. Research Methodology
1.3. Definitions and Assumptions
2. Executive Summary
3. Brazil Energy Drinks Market Policies, Regulations, and Standards
4. Brazil Energy Drinks Market Dynamics
4.1. Growth Factors
4.2. Challenges
4.3. Trends
4.4. Opportunities
5. Brazil Energy Drinks Market Statistics, 2020-2030F
5.1. Market Size & Growth Outlook
5.1.1.By Revenues in US$ Million
5.1.2.By Quantity Sold (Million Liters)
5.2. Market Segmentation & Growth Outlook
5.2.1.By Product Type
5.2.1.1. Alcoholic- Market Insights and Forecast 2020-2030, USD Million
5.2.1.2. Non-Alcoholic- Market Insights and Forecast 2020-2030, USD Million
5.2.2.By Consumption
5.2.2.1. Drinks- Market Insights and Forecast 2020-2030, USD Million
5.2.2.2. Shots- Market Insights and Forecast 2020-2030, USD Million
5.2.2.3. Mixers- Market Insights and Forecast 2020-2030, USD Million
5.2.3.By Nature
5.2.3.1. Conventional- Market Insights and Forecast 2020-2030, USD Million
5.2.3.2. Natural/Organic- Market Insights and Forecast 2020-2030, USD Million
5.2.4.By Flavour
5.2.4.1. Flavoured- Market Insights and Forecast 2020-2030, USD Million
5.2.4.2. Unflavoured- Market Insights and Forecast 2020-2030, USD Million
5.2.5.By Packaging
5.2.5.1. Bottles- Market Insights and Forecast 2020-2030, USD Million
5.2.5.1.1. PET Bottles- Market Insights and Forecast 2020-2030, USD Million
5.2.5.1.2. Glass Bottles- Market Insights and Forecast 2020-2030, USD Million
5.2.5.2. Metal Cans- Market Insights and Forecast 2020-2030, USD Million
5.2.5.3. Pouches- Market Insights and Forecast 2020-2030, USD Million
5.2.5.4. Others- Market Insights and Forecast 2020-2030, USD Million
5.2.6.By Packaging Size
5.2.6.1. Small- Market Insights and Forecast 2020-2030, USD Million
5.2.6.2. Medium- Market Insights and Forecast 2020-2030, USD Million
5.2.6.3. Large- Market Insights and Forecast 2020-2030, USD Million
5.2.7.By End Users
5.2.7.1. Teenagers- Market Insights and Forecast 2020-2030, USD Million
5.2.7.2. Adults- Market Insights and Forecast 2020-2030, USD Million
5.2.7.3. Geriatric- Market Insights and Forecast 2020-2030, USD Million
5.2.8.By Sales Channel
5.2.8.1. On-Trade- Market Insights and Forecast 2020-2030, USD Million
5.2.8.2. Off-Trade- Market Insights and Forecast 2020-2030, USD Million
5.2.9.By Competitors
5.2.9.1. Competition Characteristics
5.2.9.2. Market Share & Analysis
6. Brazil Alcoholic Energy Drinks Market Outlook, 2020-2030F
6.1. Market Size & Growth Outlook
6.1.1.By Revenues in US$ Million
6.1.2.By Quantity Sold (Million Liters)
6.2. Market Segmentation & Growth Outlook
6.2.1.By Consumption- Market Insights and Forecast 2020-2030, USD Million
6.2.2.By Nature- Market Insights and Forecast 2020-2030, USD Million
6.2.3.By Flavour- Market Insights and Forecast 2020-2030, USD Million
6.2.4.By Packaging- Market Insights and Forecast 2020-2030, USD Million
6.2.5.By Packaging Size- Market Insights and Forecast 2020-2030, USD Million
6.2.6.By End Users- Market Insights and Forecast 2020-2030, USD Million
6.2.7.By Sales Channel- Market Insights and Forecast 2020-2030, USD Million
7. Brazil Non-Alcoholic Energy Drinks Market Outlook, 2020-2030F
7.1. Market Size & Growth Outlook
7.1.1.By Revenues in US$ Million
7.1.2.By Quantity Sold (Million Liters)
7.2. Market Segmentation & Growth Outlook
7.2.1.By Consumption- Market Insights and Forecast 2020-2030, USD Million
7.2.2.By Nature- Market Insights and Forecast 2020-2030, USD Million
7.2.3.By Flavour- Market Insights and Forecast 2020-2030, USD Million
7.2.4.By Packaging- Market Insights and Forecast 2020-2030, USD Million
7.2.5.By Packaging Size- Market Insights and Forecast 2020-2030, USD Million
7.2.6.By End Users- Market Insights and Forecast 2020-2030, USD Million
7.2.7.By Sales Channel- Market Insights and Forecast 2020-2030, USD Million
8. Competitive Outlook
8.1. Company Profiles
8.1.1.Red Bull do Brasil Ltda
8.1.1.1. Business Description
8.1.1.2. Product Portfolio
8.1.1.3. Collaborations & Alliances
8.1.1.4. Recent Developments
8.1.1.5. Financial Details
8.1.1.6. Others
8.1.2.Coca-Cola Indústrias Ltda
8.1.2.1. Business Description
8.1.2.2. Product Portfolio
8.1.2.3. Collaborations & Alliances
8.1.2.4. Recent Developments
8.1.2.5. Financial Details
8.1.2.6. Others
8.1.3.Bebidas Grassi Do Brasil Ltda
8.1.3.1. Business Description
8.1.3.2. Product Portfolio
8.1.3.3. Collaborations & Alliances
8.1.3.4. Recent Developments
8.1.3.5. Financial Details
8.1.3.6. Others
8.1.4.Monster Beverage Corp
8.1.4.1. Business Description
8.1.4.2. Product Portfolio
8.1.4.3. Collaborations & Alliances
8.1.4.4. Recent Developments
8.1.4.5. Financial Details
8.1.4.6. Others
8.1.5.GlobalBev Bebidas & Alimentos SA
8.1.5.1. Business Description
8.1.5.2. Product Portfolio
8.1.5.3. Collaborations & Alliances
8.1.5.4. Recent Developments
8.1.5.5. Financial Details
8.1.5.6. Others
8.1.6.Cia Brasileira de Bebidas
8.1.6.1. Business Description
8.1.6.2. Product Portfolio
8.1.6.3. Collaborations & Alliances
8.1.6.4. Recent Developments
8.1.6.5. Financial Details
8.1.6.6. Others
8.1.7.Cervejaria Petrópolis SA
8.1.7.1. Business Description
8.1.7.2. Product Portfolio
8.1.7.3. Collaborations & Alliances
8.1.7.4. Recent Developments
8.1.7.5. Financial Details
8.1.7.6. Others
8.1.8.Viton 44 Indústria, Comércio e Exportação de Alimentos Ltda
8.1.8.1. Business Description
8.1.8.2. Product Portfolio
8.1.8.3. Collaborations & Alliances
8.1.8.4. Recent Developments
8.1.8.5. Financial Details
8.1.8.6. Others
8.1.9.NRG Trading Ltda
8.1.9.1. Business Description
8.1.9.2. Product Portfolio
8.1.9.3. Collaborations & Alliances
8.1.9.4. Recent Developments
8.1.9.5. Financial Details
8.1.9.6. Others
8.1.10. Ambev
8.1.10.1. Business Description
8.1.10.2. Product Portfolio
8.1.10.3. Collaborations & Alliances
8.1.10.4. Recent Developments
8.1.10.5. Financial Details
8.1.10.6. Others
9. Disclaimer
| Segment | Sub-Segment |
|---|---|
| By Product Type |
|
| By Consumption |
|
| By Nature |
|
| By Flavour |
|
| By Packaging |
|
| By Packaging Size |
|
| By End Users |
|
| By Sales Channel |
|
Research Methodology
This study followed a structured approach comprising four key phases to assess the size and scope of the electro-oxidation market. The process began with thorough secondary research to collect data on the target market, related markets, and broader industry context. These findings, along with preliminary assumptions and estimates, were then validated through extensive primary research involving industry experts from across the value chain. To calculate the overall market size, both top-down and bottom-up methodologies were employed. Finally, market segmentation and data triangulation techniques were applied to refine and validate segment-level estimations.
Secondary Research
The secondary research phase involved gathering data from a wide range of credible and published sources. This step helped in identifying industry trends, defining market segmentation, and understanding the market landscape and value chain.
Sources consulted during this phase included:
- Company annual reports, investor presentations, and press releases
- Industry white papers and certified publications
- Trade directories and market-recognized databases
- Articles from authoritative authors and reputable journals
- Gold and silver standard websites
Secondary research was critical in mapping out the industry's value chain and monetary flow, identifying key market segments, understanding regional variations, and tracking significant industry developments.
Other key sources:
- Financial disclosures
- Industry associations and trade bodies
- News outlets and business magazines
- Academic journals and research studies
- Paid industry databases
Primary Research
To validate secondary data and gain deeper market insights, primary research was conducted with key stakeholders across both the supply and demand sides of the market.
On the demand side, participants included decision-makers and influencers from end-user industries—such as CIOs, CTOs, and CSOs—who provided first-hand perspectives on market needs, product usage, and future expectations.
On the supply side, interviews were conducted with manufacturers, industry associations, and institutional participants to gather insights into current offerings, product pipelines, and market challenges.
Primary interviews provided critical inputs such as:
- Market size and revenue data
- Product and service breakdowns
- Market forecasts
- Regional and application-specific trends
Stakeholders consulted included:
- Leading OEM and solution providers
- Channel and distribution partners
- End users across various applications
- Independent consultants and industry specialists
Market Size Estimation and Data Triangulation
- Identifying Key Market Participants (Secondary Research)
- Goal: To identify the major players or companies in the target market. This typically involves using publicly available data sources such as industry reports, market research publications, and financial statements of companies.
- Tools: Reports from firms like Gartner, Forrester, Euromonitor, Statista, IBISWorld, and others. Public financial statements, news articles, and press releases from top market players.
- Extracting Earnings of Key Market Participants
- Goal: To estimate the earnings generated from the product or service being analyzed. This step helps in understanding the revenue potential of each market player in a specific geography.
- Methods: Earnings data can be gathered from:
- Publicly available financial reports (for listed companies).
- Interviews and primary data sources from professionals, such as Directors, VPs, SVPs, etc. This is especially useful for understanding more nuanced, internal data that isn't publicly disclosed.
- Annual reports and investor presentations of key players.
- Data Collation and Development of a Relevant Data Model
- Goal: To collate inputs from both primary and secondary sources into a structured, data-driven model for market estimation. This model will incorporate key market KPIs and any independent variables relevant to the market.
- Key KPIs: These could include:
- Market size, growth rate, and demand drivers.
- Industry-specific metrics like market share, average revenue per customer (ARPC), or average deal size.
- External variables, such as economic growth rates, inflation rates, or commodity prices, that could affect the market.
- Data Modeling: Based on this data, the market forecasts are developed for the next 5 years. A combination of trend analysis, scenario modeling, and statistical regression might be used to generate projections.
- Scenario Analysis
- Goal: To test different assumptions and validate how sensitive the market is to changes in key variables (e.g., market demand, regulatory changes, technological disruptions).
- Types of Scenarios:
- Base Case: Based on current assumptions and historical data.
- Best-Case Scenario: Assuming favorable market conditions, regulatory environments, and technological advancements.
- Worst-Case Scenario: Accounting for adverse factors, such as economic downturns, stricter regulations, or unexpected disruptions.


