Brazil Bottled Water Market Report: Trends, Growth and Forecast (2026-2032)
By Type of Water (Carbonated Bottled Water, Flavoured Bottled Water, Functional Bottled Water, Still Bottled Water), By Sub Types (Purified (Desalinated, Atmospheric Generated, Others), Mineral, Other (Spring, Alkaline, Other)), By Packaging Material (Flexible Packaging (Aluminium, Pouches), Glass, Rigid Plastic (PET Bottles, Thin Wall Plastic Containers, Others)), By Price Category (Budget, Economy, Premium), By Pack Size (100 ml, 125 ml, 200 ml, 250 ml, 330 ml, 370 ml, 450 ml, 500 ml, 591 ml, 750 ml, 1,000 ml, 1,500 ml, 4,000 ml, 5,000 ml, Others), By Sales Channel (On Trade (Restaurants, Hotels, Cafes, Others), Off Trade (Grocery Retailers (Convenience Retail, Supermarkets, Hypermarkets, Small Local Grocer), Non-Grocery Retailers (General Merchandise Stores), Vending, E-commerce)), By Region (North, Center-West, Northeast, Southeast, South) ... Read more
|
Major Players
|
Brazil Bottled Water Market Statistics and Insights, 2026
- Market Size Statistics
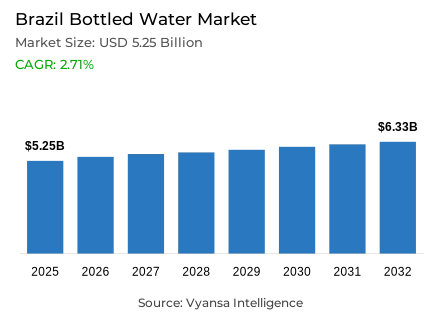
- Bottled water in Brazil is estimated at USD 5.25 billion in 2025.
- The market size is expected to grow to USD 6.33 billion by 2032.
- Market to register a cagr of around 2.71% during 2026-32.
- Type of Water Shares
- Still bottled water grabbed market share of 75%.
- Competition
- Bottled water in Brazil is currently being catered to by more than 5 companies.
- Top 5 companies acquired around 25% of the market share.
- Minalba Brasil; Empresa de Águas Ouro Fino Ltda; Lindoyana de Águas Minerais Ltda; Indaiá Brasil Águas Minerais Ltda; Coca-Cola Indústrias Ltda etc., are few of the top companies.
- Sales Channel
- Off trade grabbed 80% of the market.
Brazil Bottled Water Market Outlook
Brazil bottled water market is projected to reach USD 5.25 billion in 2025 and USD 6.33 billion in 2032, with a compound annual growth rate (CAGR) of about 2.71% in 2026–32. This consistent rise is an indication of the fact that the country is becoming more dependent on bottled water due to climatic stress, infrastructure deficiencies, and health-conscious hydration needs.
The demand of still bottled water which has the highest market share of 75% is a major force in this market. The popularity of the segment can be explained by its neutral flavor and the fact that it can be consumed by people of all ages, which is why it is a staple in cities and towns. The trends of health and wellness also support the stance of still bottled water, which is in line with the recommendations of the population on hydration without the use of sugars or carbonated beverages.
Off-trade sales represent about 80% of the market share. The large number of supermarkets and grocery stores in Brazil makes it easy to access and afford bottled water, especially in areas where tap water is not reliable. The dominance of off-trade is also supported by bulk purchasing behaviour, which makes it the most reliable and convenient medium through which households can find reliable hydration solutions.
Besides these structural trends, sustainability is also influencing packaging and consumer decisions. The pressure of regulations and demand of consumers on environmentally friendly products is pushing bottled water brands to use more sustainable packaging, such as alternatives to single-use plastics. Such changing tastes are likely to influence the direction of the market in the next few years.

Brazil Bottled Water Market Growth Driver
Climate Stress and Drinking Water Reliability
The growing climatic stress and the disproportionate access to tap water that is drinkable remain the basis of the bottled water demand across Brazil. The World Meteorological Organization has verified that the nation has been witnessing increased and severe heat extremes over the past years, thus increasing daily hydration needs and strengthening the dependence on convenient drinking water sources. High temperatures increase the perceived health risks of dehydration, thus keeping bottled water as a necessity drink and not a luxury drink.
This demand is further supported by infrastructure gaps. World Bank data indicate that in 2024, some 89% of the Brazilian population had access to safely managed drinking water services, meaning that some 11% of the population still lacked reliable access, especially in peri-urban areas and in regions distant to large metropolitan centres. Bottled water in these situations continues to be a reliable substitute in situations where there is still doubt about water quality hence maintaining a consistent off-trade consumption.
Brazil Bottled Water Market Challenge
Cost Pressure from Fiscal and Environmental Policies
A structural constraint to bottled water producers is regulatory and fiscal pressures. The indirect tax reforms that are still under discussion in Brazil are still creating confusion on the VAT treatment of basic drinks, such as bottled water. The Brazilian Federal Senate has pointed out that the suggested reforms can decrease tax exemptions on food and beverage types, which will raise compliance costs and burdens on packaged water producers.
The industry is also strained by environmental compliance. The Brazilian Solid Waste Association, Abrelpe, states that the total rate of waste recycling in Brazil is 4%, and that in 2022, only 4% of the 27.7 million tonnes of waste that can be recycled is actually recycled, which puts additional pressure on producers to fund recovery and sustainability efforts. All these cost pressures are a threat of being transferred to retail prices, which may reduce affordability in price-sensitive areas.
Unlock Market Intelligence
Explore the market potential with our data-driven report
Brazil Bottled Water Market Trend
Shift Toward Sustainable and Alternative Packaging
The packaging strategies in the bottled water industry are being affected by sustainability-based purchasing behaviour. The United Nations Environment Programme notes that Brazil is one of the nations that focus on the reduction of single-use plastics in the context of post-2020 national waste policies, which affects the choice of beverage packaging. This social and regulatory pressure is promoting alternatives like aluminium and glass formats.
Sustainability can be measured in terms of consumer alignment. As per OECD environmental data, Brazil has strengthened extended producer responsibility frameworks since 2021, which has enhanced responsibility in the management of packaging lifecycle. Bottled water brands are also reacting by implementing recyclable or reusable packaging, making sustainability not a niche feature but a mainstream expectation that is part of the product identity.
Brazil Bottled Water Market Opportunity
Functional Hydration Addressing Public Health Gaps
The gaps in public health nutrition provide the chances of value-added bottled water products. According to the World Health Organization, micronutrient deficiencies are still a problem in certain regions of Brazil, especially among low-income populations, although the overall dietary situation has improved since 2020. This background justifies the appeal of water products that are fortified with minerals and electrolytes that supplement hydration.
Also, the Pan American Health Organization confirms that non-communicable disease prevention policies in Brazil are gradually discouraging sugar consumption, which further supports the preference of non-sweetened sources of hydration. Functional bottled water can fit these policies by providing perceived wellness benefits without added sugars, making the category expand its applicability in the health-conscious daily routine.
Unlock Market Intelligence
Explore the market potential with our data-driven report
Brazil Bottled Water Market Segmentation Analysis
By Type of Water
- Carbonated Bottled Water
- Flavoured Bottled Water
- Functional Bottled Water
- Still Bottled Water
The segment with the highest share under the Type of Water category is still bottled water, accounting for around 75% of total market share. This dominance reflects its everyday usability, affordability, and broad acceptance across urban and rural areas. Still water remains the default choice for household consumption due to its neutral taste and suitability for all age groups.
Its strong position is further supported by public health guidance encouraging regular hydration without added sugars or carbonation. Still bottled water also benefits from widespread availability in multiple pack sizes, making it adaptable to both individual and family-level consumption patterns, thereby maintaining its leadership within the overall category.

By Sales Channel
- On Trade
- Restaurants
- Hotels
- Cafes
- Others
- Off Trade
- Grocery Retailers
- Convenience Retail
- Supermarkets
- Hypermarkets
- Small Local Grocer
- Non-Grocery Retailers
- General Merchandise Stores
- Vending
- E-commerce
- Grocery Retailers
The segment with the highest share under the Sales Channel category is off-trade, holding approximately 80% of the market share. This channel benefits from Brazil’s extensive supermarket and grocery network, which ensures consistent availability and competitive pricing for essential products like bottled water.
Off-trade dominance is reinforced by bulk purchasing behavior, especially in regions where tap water reliability varies. Households increasingly rely on retail outlets for regular replenishment, positioning off-trade as the most practical and trusted channel for bottled water access, while also enabling brand visibility and packaging variety at scale.
List of Companies Covered in Brazil Bottled Water Market
The companies listed below are highly influential in the Brazil bottled water market, with a significant market share and a strong impact on industry developments.
- Minalba Brasil
- Empresa de Águas Ouro Fino Ltda
- Lindoyana de Águas Minerais Ltda
- Indaiá Brasil Águas Minerais Ltda
- Coca-Cola Indústrias Ltda
- Minalba Alimentos e Bebidas Ltda
- Cia Brasileira de Bebidas
- Heineken do Brasil Comercial Ltda
Competitive Landscape
Brazil’s bottled water market remains highly fragmented, with Indaiá Brasil Águas Minerais, under GBO Minalba Brasil, projected to retain its leading position in both off-trade volume and value terms by the end of the review period. The Indaiá brand continues to benefit from sustained investment in portfolio enhancement and new product development, supporting stable market share. Minalba Brasil strengthens its competitive influence through a diversified brand portfolio spanning multiple price points, including Indaiá, Minalba, São Lourenço, and Nestlé Pureza Vital. The company differentiates itself through innovation, such as inclusive Braille-labelled cans, canned water formats, and limited-edition glass bottles, helping to de-commoditise bottled water and stand out in an intensely competitive environment.
Frequently Asked Questions
Related Report
1. Market Segmentation
1.1. Research Scope
1.2. Research Methodology
1.3. Definitions and Assumptions
2. Executive Summary
3. Brazil Bottled Water Market Policies, Regulations, and Standards
4. Brazil Bottled Water Market Dynamics
4.1. Growth Factors
4.2. Challenges
4.3. Trends
4.4. Opportunities
5. Brazil Bottled Water Market Statistics, 2022-2032F
5.1. Market Size & Growth Outlook
5.1.1.By Revenues in USD Million
5.2. Market Segmentation & Growth Outlook
5.2.1.By Type of Water
5.2.1.1. Carbonated Bottled Water- Market Insights and Forecast 2022-2032, USD Million
5.2.1.2. Flavoured Bottled Water- Market Insights and Forecast 2022-2032, USD Million
5.2.1.3. Functional Bottled Water- Market Insights and Forecast 2022-2032, USD Million
5.2.1.4. Still Bottled Water- Market Insights and Forecast 2022-2032, USD Million
5.2.2.By Sub Types
5.2.2.1. Purified- Market Insights and Forecast 2022-2032, USD Million
5.2.2.1.1. Desalinated- Market Insights and Forecast 2022-2032, USD Million
5.2.2.1.2. Atmospheric Generated- Market Insights and Forecast 2022-2032, USD Million
5.2.2.1.3. Others- Market Insights and Forecast 2022-2032, USD Million
5.2.2.2. Mineral- Market Insights and Forecast 2022-2032, USD Million
5.2.2.3. Other (Spring, Alkaline, Other) - Market Insights and Forecast 2022-2032, USD Million
5.2.3.By Packaging Material
5.2.3.1. Flexible Packaging- Market Insights and Forecast 2022-2032, USD Million
5.2.3.1.1. Aluminium- Market Insights and Forecast 2022-2032, USD Million
5.2.3.1.2. Pouches- Market Insights and Forecast 2022-2032, USD Million
5.2.3.2. Glass- Market Insights and Forecast 2022-2032, USD Million
5.2.3.3. Rigid Plastic- Market Insights and Forecast 2022-2032, USD Million
5.2.3.3.1. PET Bottles- Market Insights and Forecast 2022-2032, USD Million
5.2.3.3.2. Thin Wall Plastic Containers- Market Insights and Forecast 2022-2032, USD Million
5.2.3.3.3. Others- Market Insights and Forecast 2022-2032, USD Million
5.2.4.By Price Category
5.2.4.1. Budget- Market Insights and Forecast 2022-2032, USD Million
5.2.4.2. Economy- Market Insights and Forecast 2022-2032, USD Million
5.2.4.3. Premium- Market Insights and Forecast 2022-2032, USD Million
5.2.5.By Pack Size
5.2.5.1. 100 ml- Market Insights and Forecast 2022-2032, USD Million
5.2.5.2. 125 ml- Market Insights and Forecast 2022-2032, USD Million
5.2.5.3. 200 ml- Market Insights and Forecast 2022-2032, USD Million
5.2.5.4. 250 ml- Market Insights and Forecast 2022-2032, USD Million
5.2.5.5. 330 ml- Market Insights and Forecast 2022-2032, USD Million
5.2.5.6. 370 ml- Market Insights and Forecast 2022-2032, USD Million
5.2.5.7. 450 ml- Market Insights and Forecast 2022-2032, USD Million
5.2.5.8. 500 ml- Market Insights and Forecast 2022-2032, USD Million
5.2.5.9. 591 ml- Market Insights and Forecast 2022-2032, USD Million
5.2.5.10. 750 ml- Market Insights and Forecast 2022-2032, USD Million
5.2.5.11. 1,000 ml- Market Insights and Forecast 2022-2032, USD Million
5.2.5.12. 1,500 ml- Market Insights and Forecast 2022-2032, USD Million
5.2.5.13. 4,000 ml- Market Insights and Forecast 2022-2032, USD Million
5.2.5.14. 5,000 ml- Market Insights and Forecast 2022-2032, USD Million
5.2.5.15. Others- Market Insights and Forecast 2022-2032, USD Million
5.2.6.By Sales Channel
5.2.6.1. On Trade- Market Insights and Forecast 2022-2032, USD Million
5.2.6.1.1. Restaurants- Market Insights and Forecast 2022-2032, USD Million
5.2.6.1.2. Hotels- Market Insights and Forecast 2022-2032, USD Million
5.2.6.1.3. Cafes- Market Insights and Forecast 2022-2032, USD Million
5.2.6.1.4. Others- Market Insights and Forecast 2022-2032, USD Million
5.2.6.2. Off Trade- Market Insights and Forecast 2022-2032, USD Million
5.2.6.2.1. Grocery Retailers- Market Insights and Forecast 2022-2032, USD Million
5.2.6.2.1.1. Convenience Retail- Market Insights and Forecast 2022-2032, USD Million
5.2.6.2.1.2. Supermarkets- Market Insights and Forecast 2022-2032, USD Million
5.2.6.2.1.3. Hypermarkets- Market Insights and Forecast 2022-2032, USD Million
5.2.6.2.1.4. Small Local Grocer- Market Insights and Forecast 2022-2032, USD Million
5.2.6.2.2. Non-Grocery Retailers- Market Insights and Forecast 2022-2032, USD Million
5.2.6.2.2.1. General Merchandise Stores- Market Insights and Forecast 2022-2032, USD Million
5.2.6.2.3. Vending- Market Insights and Forecast 2022-2032, USD Million
5.2.6.2.4. E-commerce- Market Insights and Forecast 2022-2032, USD Million
5.2.7.By Region
5.2.7.1. North
5.2.7.2. Center-West
5.2.7.3. Northeast
5.2.7.4. Southeast
5.2.7.5. South
5.2.8.By Competitors
5.2.8.1. Competition Characteristics
5.2.8.2. Market Share & Analysis
6. Brazil Carbonated Bottled Water Market Statistics, 2022-2032
6.1. Market Size & Growth Outlook
6.1.1.By Revenues in USD Million
6.2. Market Segmentation & Growth Outlook
6.2.1.By Packaging Material- Market Insights and Forecast 2022-2032, USD Million
6.2.2.By Price Point- Market Insights and Forecast 2022-2032, USD Million
6.2.3.By Sales Channel- Market Insights and Forecast 2022-2032, USD Million
6.2.4.By Region- Market Insights and Forecast 2022-2032, USD Million
7. Brazil Flavoured Bottled Water Market Statistics, 2022-2032
7.1. Market Size & Growth Outlook
7.1.1.By Revenues in USD Million
7.2. Market Segmentation & Growth Outlook
7.2.1.By Packaging Material- Market Insights and Forecast 2022-2032, USD Million
7.2.2.By Price Point- Market Insights and Forecast 2022-2032, USD Million
7.2.3.By Sales Channel- Market Insights and Forecast 2022-2032, USD Million
7.2.4.By Region- Market Insights and Forecast 2022-2032, USD Million
8. Brazil Functional Bottled Water Market Statistics, 2022-2032
8.1. Market Size & Growth Outlook
8.1.1.By Revenues in USD Million
8.2. Market Segmentation & Growth Outlook
8.2.1.By Packaging Material- Market Insights and Forecast 2022-2032, USD Million
8.2.2.By Price Point- Market Insights and Forecast 2022-2032, USD Million
8.2.3.By Sales Channel- Market Insights and Forecast 2022-2032, USD Million
8.2.4.By Region- Market Insights and Forecast 2022-2032, USD Million
9. Brazil Still Bottled Water Market Statistics, 2022-2032
9.1. Market Size & Growth Outlook
9.1.1.By Revenues in USD Million
9.2. Market Segmentation & Growth Outlook
9.2.1.By Type of Water- Market Insights and Forecast 2022-2032, USD Million
9.2.2.By Packaging Material- Market Insights and Forecast 2022-2032, USD Million
9.2.3.By Price Point- Market Insights and Forecast 2022-2032, USD Million
9.2.4.By Sales Channel- Market Insights and Forecast 2022-2032, USD Million
9.2.5.By Region- Market Insights and Forecast 2022-2032, USD Million
10. Competitive Outlook
10.1. Company Profiles
10.1.1. Indaiá Brasil Águas Minerais Ltda
10.1.1.1. Business Description
10.1.1.2. Product Portfolio
10.1.1.3. Collaborations & Alliances
10.1.1.4. Recent Developments
10.1.1.5. Financial Details
10.1.1.6. Others
10.1.2. Coca-Cola Indústrias Ltda
10.1.2.1. Business Description
10.1.2.2. Product Portfolio
10.1.2.3. Collaborations & Alliances
10.1.2.4. Recent Developments
10.1.2.5. Financial Details
10.1.2.6. Others
10.1.3. Minalba Alimentos e Bebidas Ltda
10.1.3.1. Business Description
10.1.3.2. Product Portfolio
10.1.3.3. Collaborations & Alliances
10.1.3.4. Recent Developments
10.1.3.5. Financial Details
10.1.3.6. Others
10.1.4. Cia Brasileira de Bebidas
10.1.4.1. Business Description
10.1.4.2. Product Portfolio
10.1.4.3. Collaborations & Alliances
10.1.4.4. Recent Developments
10.1.4.5. Financial Details
10.1.4.6. Others
10.1.5. Heineken do Brasil Comercial Ltda
10.1.5.1. Business Description
10.1.5.2. Product Portfolio
10.1.5.3. Collaborations & Alliances
10.1.5.4. Recent Developments
10.1.5.5. Financial Details
10.1.5.6. Others
10.1.6. Minalba Brasil
10.1.6.1. Business Description
10.1.6.2. Product Portfolio
10.1.6.3. Collaborations & Alliances
10.1.6.4. Recent Developments
10.1.6.5. Financial Details
10.1.6.6. Others
10.1.7. Empresa de Águas Ouro Fino Ltda
10.1.7.1. Business Description
10.1.7.2. Product Portfolio
10.1.7.3. Collaborations & Alliances
10.1.7.4. Recent Developments
10.1.7.5. Financial Details
10.1.7.6. Others
10.1.8. Lindoyana de Águas Minerais Ltda
10.1.8.1. Business Description
10.1.8.2. Product Portfolio
10.1.8.3. Collaborations & Alliances
10.1.8.4. Recent Developments
10.1.8.5. Financial Details
10.1.8.6. Others
11. Disclaimer
| Segment | Sub-Segment |
|---|---|
| By Type of Water |
|
| By Sub Types |
|
| By Packaging Material |
|
| By Price Category |
|
| By Pack Size |
|
| By Sales Channel |
|
| By Region |
|
Research Methodology
This study followed a structured approach comprising four key phases to assess the size and scope of the electro-oxidation market. The process began with thorough secondary research to collect data on the target market, related markets, and broader industry context. These findings, along with preliminary assumptions and estimates, were then validated through extensive primary research involving industry experts from across the value chain. To calculate the overall market size, both top-down and bottom-up methodologies were employed. Finally, market segmentation and data triangulation techniques were applied to refine and validate segment-level estimations.
Secondary Research
The secondary research phase involved gathering data from a wide range of credible and published sources. This step helped in identifying industry trends, defining market segmentation, and understanding the market landscape and value chain.
Sources consulted during this phase included:
- Company annual reports, investor presentations, and press releases
- Industry white papers and certified publications
- Trade directories and market-recognized databases
- Articles from authoritative authors and reputable journals
- Gold and silver standard websites
Secondary research was critical in mapping out the industry's value chain and monetary flow, identifying key market segments, understanding regional variations, and tracking significant industry developments.
Other key sources:
- Financial disclosures
- Industry associations and trade bodies
- News outlets and business magazines
- Academic journals and research studies
- Paid industry databases
Primary Research
To validate secondary data and gain deeper market insights, primary research was conducted with key stakeholders across both the supply and demand sides of the market.
On the demand side, participants included decision-makers and influencers from end-user industries—such as CIOs, CTOs, and CSOs—who provided first-hand perspectives on market needs, product usage, and future expectations.
On the supply side, interviews were conducted with manufacturers, industry associations, and institutional participants to gather insights into current offerings, product pipelines, and market challenges.
Primary interviews provided critical inputs such as:
- Market size and revenue data
- Product and service breakdowns
- Market forecasts
- Regional and application-specific trends
Stakeholders consulted included:
- Leading OEM and solution providers
- Channel and distribution partners
- End users across various applications
- Independent consultants and industry specialists
Market Size Estimation and Data Triangulation
- Identifying Key Market Participants (Secondary Research)
- Goal: To identify the major players or companies in the target market. This typically involves using publicly available data sources such as industry reports, market research publications, and financial statements of companies.
- Tools: Reports from firms like Gartner, Forrester, Euromonitor, Statista, IBISWorld, and others. Public financial statements, news articles, and press releases from top market players.
- Extracting Earnings of Key Market Participants
- Goal: To estimate the earnings generated from the product or service being analyzed. This step helps in understanding the revenue potential of each market player in a specific geography.
- Methods: Earnings data can be gathered from:
- Publicly available financial reports (for listed companies).
- Interviews and primary data sources from professionals, such as Directors, VPs, SVPs, etc. This is especially useful for understanding more nuanced, internal data that isn't publicly disclosed.
- Annual reports and investor presentations of key players.
- Data Collation and Development of a Relevant Data Model
- Goal: To collate inputs from both primary and secondary sources into a structured, data-driven model for market estimation. This model will incorporate key market KPIs and any independent variables relevant to the market.
- Key KPIs: These could include:
- Market size, growth rate, and demand drivers.
- Industry-specific metrics like market share, average revenue per customer (ARPC), or average deal size.
- External variables, such as economic growth rates, inflation rates, or commodity prices, that could affect the market.
- Data Modeling: Based on this data, the market forecasts are developed for the next 5 years. A combination of trend analysis, scenario modeling, and statistical regression might be used to generate projections.
- Scenario Analysis
- Goal: To test different assumptions and validate how sensitive the market is to changes in key variables (e.g., market demand, regulatory changes, technological disruptions).
- Types of Scenarios:
- Base Case: Based on current assumptions and historical data.
- Best-Case Scenario: Assuming favorable market conditions, regulatory environments, and technological advancements.
- Worst-Case Scenario: Accounting for adverse factors, such as economic downturns, stricter regulations, or unexpected disruptions.


