Brazil Alcoholic Drinks Market Report: Trends, Growth and Forecast (2026-2032)
By Type (Beer, Cider/Perry, RTDs, Spirits, Wine), By Alcohol Content (High, Medium, Low), By Flavor (Unflavored, Flavored), By Packaging Type (Glass Bottles, Tins, Plastic Bottles, Others), By Sales Channel (On-Trade, Off-Trade (Retail Offline, Retail Online)) ... Read more
|
Major Players
|
Brazil Alcoholic Drinks Market Statistics and Insights, 2026
- Market Size Statistics
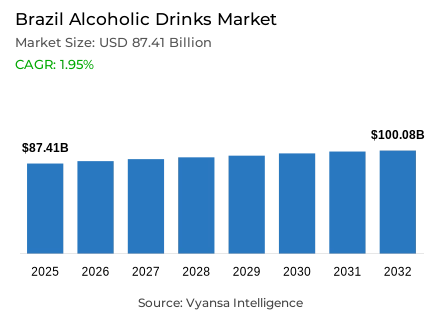
- Alcoholic Drinks in Brazil is estimated at $ 87.41 Billion.
- The market size is expected to grow to $ 100.08 Billion by 2032.
- Market to register a CAGR of around 1.95% during 2026-32.
- Type Shares
- Beer grabbed market share of 75%.
- Beer to witness a volume CAGR of around 0.75%.
- Competition
- More than 10 companies are actively engaged in producing Alcoholic Drinks in Brazil.
- Top 5 companies acquired 85% of the market share.
- Indústrias Reunidas de Bebidas Tatuzinho / 3 Fazendas Ltda, Engarrafamento Pitú Ltda, Arbor Brasil Indústria de Bebidas Ltda, Anheuser-Busch InBev NV, Heineken NV etc., are few of the top companies.
- Sales Channel
- On-Trade grabbed 65% of the market.
Brazil Alcoholic Drinks Market Outlook
The Brazil alcoholic drinks market , worth USD 87.41 billion, is anticipated to reach USD 100.08 billion by 2032. End user demand for Alcoholic Drinks has sustained despite inflationary pressure and muted purchasing power growth. Beer, more than 90% of total volume sales, will lead the market, with a modest volume CAGR of about 0.75%. Premium lager will continue to drive growth, as players such as Cia Brasileira de Bebidas, Heineken, and Cervejaria Petrópolis focus on distribution, brand-building, and product development. Non/low alcohol and health-oriented versions like low-calorie and gluten-free beers are also picking up steam, targeting end users who balance indulgence with well-being.
Spirits are predicted to be helped by cachaça's popularity, underpinned by its low cost and availability in both off-trade and on-trade. Trends in mixology are projected to drive bitters and rum forward, while bourbon is further cementing its position within whisky. Vodka, gin, and blended Scotch whisky, though, could suffer from maturity and constrained innovation. RTDs will continue to grow as exotic fruits and local tastes appeal to younger drinkers, but high costs and competition from strong beverages will limit strong growth.
Wine has blended prospects. Still red wine will find it difficult with supply chain pressures, few drinking occasions, and competition, but sparkling, white, and rosé wines will be on the increase as Brazils increasingly adopt broader drinking occasions. Chilean wines are poised to take advantage of price-sensitive end users because of competitive pricing and broader retail availability.
On-trade sales, at 65% of the market today, will continue to dominate, fueled by the active bar culture and robust demand for beer and cachaça in social environments. Off-trade channels will also make gains, especially for wine and RTDs, as e-commerce grows with participants such as AB InBev and Cia Muller building out direct-to-end user platforms. At large, the market performance remains strong, with growth influenced by premiumisation, wellness trends, innovation, and changing end user tastes.

Brazil Alcoholic Drinks Market Growth Driver
Growth in Local Flavours and Premium
Brazil end users are turning increasingly to premium and locally themed Alcoholic Drinks, especially cachaça, craft beer, and premium lager. This trend is being propelled by an increasing desire for quality over quantity, notably among young adults in urban settings. end users are seeking out local flavors, exotic ingredients, and creative mixes, which promotes product innovation and segmentation throughout the market.
The increasing need for premium choices also fuels investment in production capacity, distribution, and branding. Alcoholic Drinks firms are placed on expanding premium portfolios, building shelf presence, and advertising products that balance indulgence with local and cultural significance, underpinning overall market expansion during the forecast period.
Brazil Alcoholic Drinks Market Trend
Health-Conscious Consumption
Brazil end users are becoming more influenced by health and wellness factors when choosing Alcoholic Drinks. Low-alcohol, low-calorie, gluten-free, and non-alcoholic products are gaining popularity, corresponding with a general trend to moderate alcohol consumption without sacrificing social and recreational activities.
This trend drives product innovation and marketing strategies, as businesses create drinks that appeal to health-focused end users. Premium beers, spirits, and RTDs are taking up lower ABV formats, functional ingredients, and fortifications, allowing end users to be able to drink alcohol responsibly. Health-led positioning continues to drive purchasing decision-making and the overall market evolution.
Unlock Market Intelligence
Explore the market potential with our data-driven report
Brazil Alcoholic Drinks Market Opportunity
Innovation with Exotic and Local Flavours
Exotic flavors and local ingredients increasingly hold out the possibility for alcoholic beverage companies to experiment with spirits and RTDs. End users are receptive to unorthodox taste sensations, and this provides room for brands to innovate through innovative formulations, seasonal products, and culturally influenced offerings.
Small and large-scale manufacturers both are emphasizing launches of products that blend local fruits, herbs, and other ingredients with classic bases like cachaça, gin, and whisky. The strategy appeals to adventurous end users and reinforces brand differentiation and premiumization strategies, thus becoming a major source of future growth through flavor innovation.
Unlock Market Intelligence
Explore the market potential with our data-driven report
Brazil Alcoholic Drinks Market Segmentation Analysis

By Type
- Beer
- Cider/Perry
- RTDs
- Spirits
- Wine
The segment with highest market share under Type is Beer, which commanded a market share of 75% of the Brazil Alcoholic Drinks market. Beer remains the leading player in the market due to high demand, led mainly by lager, with premium lager being the most sustaining over the years. Large players, such as Cia Brasileira de Bebidas, Heineken do Brasil, and Cervejaria Petrópolis, are concentrated on developing more premium products via expanded distribution, advertising campaigns, and product innovations.
Non/low alcohol offerings, gluten-free, and light beers are increasingly popular, particularly with younger end users who are health-conscious. The most resilient category during the forecast period is likely to be beer with a volume CAGR of approximately 0.75%, underpinned by ongoing premiumisation, innovation, and increasing demand for healthier options.
By Sales Channel
- On-Trade
- Off-Trade
The segment with highest market share under Sales Channel is On-Trade with 65% of the Brazil alcoholic beverage market share in 2025. On-trade is the dominant channel because of the high penetration of bars and pubs throughout Brazil, where cachaça and beer are heavily consumed. Although the number of outlets decreased marginally in recent years, on-trade is still the preferred choice among end users for social occasions of drinking and premium experiences.
Off-trade keeps growing steadily, especially among price-conscious end users who favor consumption at home. Mass retailers like supermarket chains and hypermarkets are the largest sellers of spirits, wine, and RTDs in the off-trade, owing to prices and convenience. Internet sales, although still relatively small in volume, are slowly increasing through B2C platforms like Zé Delivery and wine.com and allow for targeted promotion and wider end user access.
Top Companies in Brazil Alcoholic Drinks Market
The top companies operating in the market include Indústrias Reunidas de Bebidas Tatuzinho / 3 Fazendas Ltda, Engarrafamento Pitú Ltda, Arbor Brasil Indústria de Bebidas Ltda, Anheuser-Busch InBev NV, Heineken NV, Cervejaria Petrópolis SA, Diageo Plc, Cia Muller de Bebidas Ltda, Campari Milano SpA, Davide, Pernod Ricard Groupe, etc., are the top players operating in the Brazil Alcoholic Drinks Market.
Frequently Asked Questions
Related Report
1. Market Segmentation
1.1. Research Scope
1.2. Research Methodology
1.3. Definitions and Assumptions
2. Executive Summary
3. Brazil Alcoholic Drinks Market Policies, Regulations, and Standards
4. Brazil Alcoholic Drinks Market Dynamics
4.1. Growth Factors
4.2. Challenges
4.3. Trends
4.4. Opportunities
5. Brazil Alcoholic Drinks Market Statistics, 2022-2032F
5.1. Market Size & Growth Outlook
5.1.1. By Revenues in US$ Million
5.1.2. By Quantity Sold in Million Litres
5.2. Market Segmentation & Growth Outlook
5.2.1. By Type
5.2.1.1. Beer- Market Insights and Forecast 2022-2032, USD Million
5.2.1.2. Cider/Perry- Market Insights and Forecast 2022-2032, USD Million
5.2.1.3. RTDs- Market Insights and Forecast 2022-2032, USD Million
5.2.1.4. Spirits- Market Insights and Forecast 2022-2032, USD Million
5.2.1.5. Wine- Market Insights and Forecast 2022-2032, USD Million
5.2.2. By Alcohol Content
5.2.2.1. High- Market Insights and Forecast 2022-2032, USD Million
5.2.2.2. Medium- Market Insights and Forecast 2022-2032, USD Million
5.2.2.3. Low- Market Insights and Forecast 2022-2032, USD Million
5.2.3. By Flavor
5.2.3.1. Unflavored- Market Insights and Forecast 2022-2032, USD Million
5.2.3.2. Flavored- Market Insights and Forecast 2022-2032, USD Million
5.2.4. By Packaging Type
5.2.4.1. Glass Bottles- Market Insights and Forecast 2022-2032, USD Million
5.2.4.2. Tins- Market Insights and Forecast 2022-2032, USD Million
5.2.4.3. Plastic Bottles- Market Insights and Forecast 2022-2032, USD Million
5.2.4.4. Others- Market Insights and Forecast 2022-2032, USD Million
5.2.5. By Sales Channel
5.2.5.1. On-Trade- Market Insights and Forecast 2022-2032, USD Million
5.2.5.2. Off-Trade- Market Insights and Forecast 2022-2032, USD Million
5.2.5.2.1. Retail Offline- Market Insights and Forecast 2022-2032, USD Million
5.2.5.2.2. Retail Online- Market Insights and Forecast 2022-2032, USD Million
5.2.6. By Competitors
5.2.6.1. Competition Characteristics
5.2.6.2. Market Share & Analysis
6. Brazil Beer Market Statistics, 2022-2032F
6.1. Market Size & Growth Outlook
6.1.1. By Revenues in US$ Million
6.1.2. By Quantity Sold in Million Litres
6.2. Market Segmentation & Growth Outlook
6.2.1. By Alcohol Content- Market Insights and Forecast 2022-2032, USD Million
6.2.2. By Flavor- Market Insights and Forecast 2022-2032, USD Million
6.2.3. By Packaging Type- Market Insights and Forecast 2022-2032, USD Million
6.2.4. By Sales Channel- Market Insights and Forecast 2022-2032, USD Million
7. Brazil Cider/Perry Market Statistics, 2022-2032F
7.1. Market Size & Growth Outlook
7.1.1. By Revenues in US$ Million
7.1.2. By Quantity Sold in Million Litres
7.2. Market Segmentation & Growth Outlook
7.2.1. By Alcohol Content- Market Insights and Forecast 2022-2032, USD Million
7.2.2. By Flavor- Market Insights and Forecast 2022-2032, USD Million
7.2.3. By Packaging Type- Market Insights and Forecast 2022-2032, USD Million
7.2.4. By Sales Channel- Market Insights and Forecast 2022-2032, USD Million
8. Brazil Ready-to-Drink Market Statistics, 2022-2032F
8.1. Market Size & Growth Outlook
8.1.1. By Revenues in US$ Million
8.1.2. By Quantity Sold in Million Litres
8.2. Market Segmentation & Growth Outlook
8.2.1. By Alcohol Content- Market Insights and Forecast 2022-2032, USD Million
8.2.2. By Flavor- Market Insights and Forecast 2022-2032, USD Million
8.2.3. By Packaging Type- Market Insights and Forecast 2022-2032, USD Million
8.2.4. By Sales Channel- Market Insights and Forecast 2022-2032, USD Million
9. Brazil Spirits Market Statistics, 2022-2032F
9.1. Market Size & Growth Outlook
9.1.1. By Revenues in US$ Million
9.1.2. By Quantity Sold in Million Litres
9.2. Market Segmentation & Growth Outlook
9.2.1. By Alcohol Content- Market Insights and Forecast 2022-2032, USD Million
9.2.2. By Flavor- Market Insights and Forecast 2022-2032, USD Million
9.2.3. By Packaging Type- Market Insights and Forecast 2022-2032, USD Million
9.2.4. By Sales Channel- Market Insights and Forecast 2022-2032, USD Million
10. Brazil Wine Market Statistics, 2022-2032F
10.1.Market Size & Growth Outlook
10.1.1. By Revenues in US$ Million
10.1.2. By Quantity Sold in Million Litres
10.2.Market Segmentation & Growth Outlook
10.2.1. By Alcohol Content- Market Insights and Forecast 2022-2032, USD Million
10.2.2. By Flavor- Market Insights and Forecast 2022-2032, USD Million
10.2.3. By Packaging Type- Market Insights and Forecast 2022-2032, USD Million
10.2.4. By Sales Channel- Market Insights and Forecast 2022-2032, USD Million
11. Competitive Outlook
11.1.Company Profiles
11.1.1. Anheuser-Busch InBev NV
11.1.1.1. Business Description
11.1.1.2. Product Portfolio
11.1.1.3. Collaborations & Alliances
11.1.1.4. Recent Developments
11.1.1.5. Financial Details
11.1.1.6. Others
11.1.2. Heineken NV
11.1.2.1. Business Description
11.1.2.2. Product Portfolio
11.1.2.3. Collaborations & Alliances
11.1.2.4. Recent Developments
11.1.2.5. Financial Details
11.1.2.6. Others
11.1.3. Cervejaria Petrópolis SA
11.1.3.1. Business Description
11.1.3.2. Product Portfolio
11.1.3.3. Collaborations & Alliances
11.1.3.4. Recent Developments
11.1.3.5. Financial Details
11.1.3.6. Others
11.1.4. Diageo Plc
11.1.4.1. Business Description
11.1.4.2. Product Portfolio
11.1.4.3. Collaborations & Alliances
11.1.4.4. Recent Developments
11.1.4.5. Financial Details
11.1.4.6. Others
11.1.5. Cia Muller de Bebidas Ltda
11.1.5.1. Business Description
11.1.5.2. Product Portfolio
11.1.5.3. Collaborations & Alliances
11.1.5.4. Recent Developments
11.1.5.5. Financial Details
11.1.5.6. Others
11.1.6. Indústrias Reunidas de Bebidas Tatuzinho / 3 Fazendas Ltda
11.1.6.1. Business Description
11.1.6.2. Product Portfolio
11.1.6.3. Collaborations & Alliances
11.1.6.4. Recent Developments
11.1.6.5. Financial Details
11.1.6.6. Others
11.1.7. Engarrafamento Pitú Ltda
11.1.7.1. Business Description
11.1.7.2. Product Portfolio
11.1.7.3. Collaborations & Alliances
11.1.7.4. Recent Developments
11.1.7.5. Financial Details
11.1.7.6. Others
11.1.8. Arbor Brasil Indústria de Bebidas Ltda
11.1.8.1. Business Description
11.1.8.2. Product Portfolio
11.1.8.3. Collaborations & Alliances
11.1.8.4. Recent Developments
11.1.8.5. Financial Details
11.1.8.6. Others
11.1.9. Campari Milano SpA, Davide
11.1.9.1. Business Description
11.1.9.2. Product Portfolio
11.1.9.3. Collaborations & Alliances
11.1.9.4. Recent Developments
11.1.9.5. Financial Details
11.1.9.6. Others
11.1.10. Pernod Ricard Groupe
11.1.10.1. Business Description
11.1.10.2. Product Portfolio
11.1.10.3. Collaborations & Alliances
11.1.10.4. Recent Developments
11.1.10.5. Financial Details
11.1.10.6. Others
12. Disclaimer
| Segment | Sub-Segment |
|---|---|
| By Type |
|
| By Alcohol Content |
|
| By Flavor |
|
| By Packaging Type |
|
| By Sales Channel |
|
Research Methodology
This study followed a structured approach comprising four key phases to assess the size and scope of the electro-oxidation market. The process began with thorough secondary research to collect data on the target market, related markets, and broader industry context. These findings, along with preliminary assumptions and estimates, were then validated through extensive primary research involving industry experts from across the value chain. To calculate the overall market size, both top-down and bottom-up methodologies were employed. Finally, market segmentation and data triangulation techniques were applied to refine and validate segment-level estimations.
Secondary Research
The secondary research phase involved gathering data from a wide range of credible and published sources. This step helped in identifying industry trends, defining market segmentation, and understanding the market landscape and value chain.
Sources consulted during this phase included:
- Company annual reports, investor presentations, and press releases
- Industry white papers and certified publications
- Trade directories and market-recognized databases
- Articles from authoritative authors and reputable journals
- Gold and silver standard websites
Secondary research was critical in mapping out the industry's value chain and monetary flow, identifying key market segments, understanding regional variations, and tracking significant industry developments.
Other key sources:
- Financial disclosures
- Industry associations and trade bodies
- News outlets and business magazines
- Academic journals and research studies
- Paid industry databases
Primary Research
To validate secondary data and gain deeper market insights, primary research was conducted with key stakeholders across both the supply and demand sides of the market.
On the demand side, participants included decision-makers and influencers from end-user industries—such as CIOs, CTOs, and CSOs—who provided first-hand perspectives on market needs, product usage, and future expectations.
On the supply side, interviews were conducted with manufacturers, industry associations, and institutional participants to gather insights into current offerings, product pipelines, and market challenges.
Primary interviews provided critical inputs such as:
- Market size and revenue data
- Product and service breakdowns
- Market forecasts
- Regional and application-specific trends
Stakeholders consulted included:
- Leading OEM and solution providers
- Channel and distribution partners
- End users across various applications
- Independent consultants and industry specialists
Market Size Estimation and Data Triangulation
- Identifying Key Market Participants (Secondary Research)
- Goal: To identify the major players or companies in the target market. This typically involves using publicly available data sources such as industry reports, market research publications, and financial statements of companies.
- Tools: Reports from firms like Gartner, Forrester, Euromonitor, Statista, IBISWorld, and others. Public financial statements, news articles, and press releases from top market players.
- Extracting Earnings of Key Market Participants
- Goal: To estimate the earnings generated from the product or service being analyzed. This step helps in understanding the revenue potential of each market player in a specific geography.
- Methods: Earnings data can be gathered from:
- Publicly available financial reports (for listed companies).
- Interviews and primary data sources from professionals, such as Directors, VPs, SVPs, etc. This is especially useful for understanding more nuanced, internal data that isn't publicly disclosed.
- Annual reports and investor presentations of key players.
- Data Collation and Development of a Relevant Data Model
- Goal: To collate inputs from both primary and secondary sources into a structured, data-driven model for market estimation. This model will incorporate key market KPIs and any independent variables relevant to the market.
- Key KPIs: These could include:
- Market size, growth rate, and demand drivers.
- Industry-specific metrics like market share, average revenue per customer (ARPC), or average deal size.
- External variables, such as economic growth rates, inflation rates, or commodity prices, that could affect the market.
- Data Modeling: Based on this data, the market forecasts are developed for the next 5 years. A combination of trend analysis, scenario modeling, and statistical regression might be used to generate projections.
- Scenario Analysis
- Goal: To test different assumptions and validate how sensitive the market is to changes in key variables (e.g., market demand, regulatory changes, technological disruptions).
- Types of Scenarios:
- Base Case: Based on current assumptions and historical data.
- Best-Case Scenario: Assuming favorable market conditions, regulatory environments, and technological advancements.
- Worst-Case Scenario: Accounting for adverse factors, such as economic downturns, stricter regulations, or unexpected disruptions.


