Austria Alcoholic Drinks Market Report: Trends, Growth and Forecast (2026-2032)
By Type (Beer, Cider/Perry, RTDs, Spirits, Wine), By Alcohol Content (High, Medium, Low), By Flavor (Unflavored, Flavored), By Packaging Type (Glass Bottles, Tins, Plastic Bottles, Others), By Sales Channel (On-Trade, Off-Trade (Retail Offline, Retail Online)) ... Read more
|
Major Players
|
Austria Alcoholic Drinks Market Statistics and Insights, 2026
- Market Size Statistics
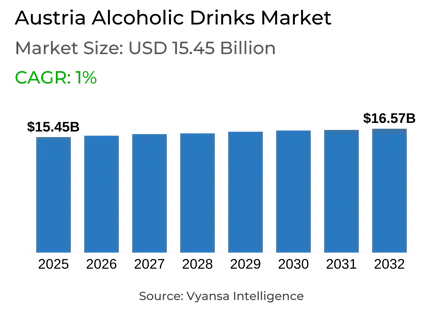
- Alcoholic Drinks in Austria is estimated at $ 15.45 Billion.
- The market size is expected to grow to $ 16.57 Billion by 2032.
- Market to register a CAGR of around 1% during 2026-32.
- Type Shares
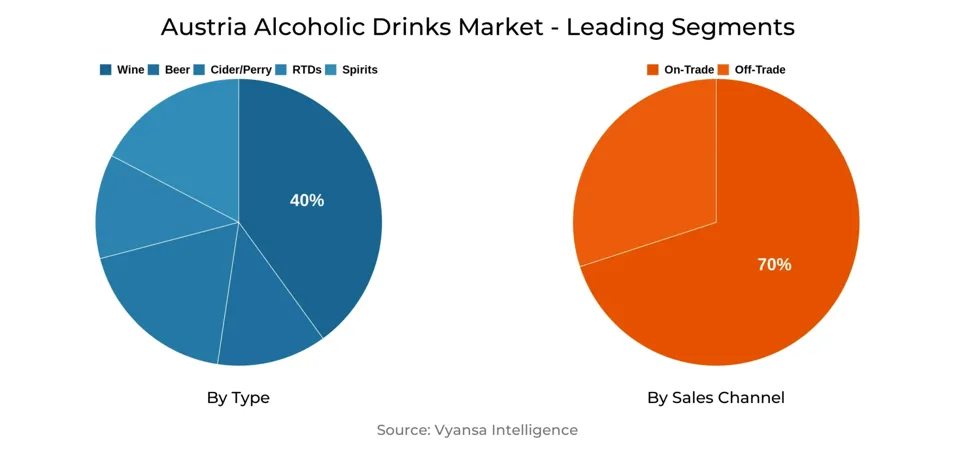
- Wine grabbed market share of 40%.
- Competition
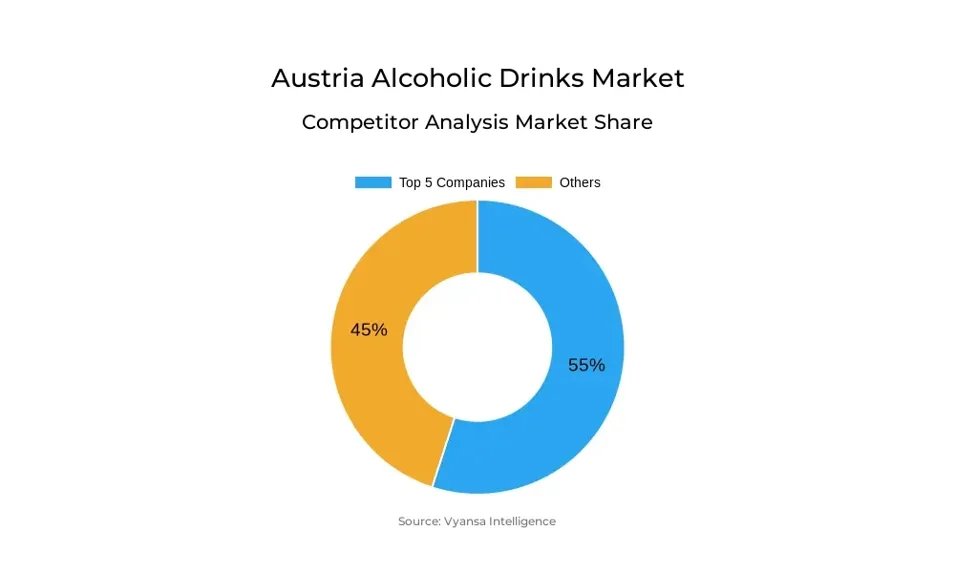
- More than 10 companies are actively engaged in producing Alcoholic Drinks in Austria.
- Top 5 companies acquired 55% of the market share.
- Zwettl, Privatbrauerei, Weinkellerei Lenz Moser AG, Hirt GmbH, Brauerei, Heineken NV, Stieglbrauerei zu Riedenburg, Franz Huemer & Co etc., are few of the top companies.
- Sales Channel
- On-Trade grabbed 70% of the market.
Austria Alcoholic Drinks Market Outlook
The Austria Alcoholic Drinks market is estimated to be worth USD 15.45 billion and is projected to grow to USD 16.57 billion by 2032, representing moderate growth during the forecast period. Total volume sales are set to be under pressure as a result of the long-term trend of decreasing alcohol consumption, fueled by increased health consciousness and diminishing social acceptability of heavy drinking, especially among young adults. Although off-trade sales will still encounter difficulties, on-trade sales, which have a 70% market share at the moment, should benefit from sustained post-pandemic recovery and increased tourism.
Beer is expected to continue to be the largest category but will experience slow growth with stagnation in on-trade sales and poor off-trade performance. Conversely, RTDs will continue to be dynamic with end users favoring lighter, easy-drinking products with greater convenience. Non-alcoholic drinks, including beer, wine, and spirits, are expected to gain increasing popularity driven by innovation in low-alcohol, low-calorie, and innovative flavours.
Spirits and light wines will be moderately pressured by health-aware lifestyles that push end users to seek out alternatives. Opportunities for growth lie in sparkling wine and non-alcoholic versions, which are increasingly popular for celebrations and social gatherings. Retailers will also be expected to adjust to regulatory shifts like the deposit scheme, which will impact product ranges and infrastructure spending in off-trade channels.
In total, the Austria alcoholic beverage market will develop according to changing end user tastes, with innovation, convenience, and health-based products defining future growth. Traditional categories are challenged, but the market will remain robust, fueled by on-trade recovery, RTD popularity, and the widening array of non-alcoholic options.
Austria Alcoholic Drinks Market Growth Driver
Increased Demand for Healthier Options
End users in Austria prefer lower-strength drinks or non-Alcoholic Drinks more and more. The reason for this trend is increased health consciousness and the need for lighter, easy-drinking products. RTDs and new-generation non-alcoholic spirits, wines, and beers are gaining popularity because end users are prepared to pay a premium for convenience and healthiness.
The market is served by this changing preference, with new product introductions closely following these trends. Manufacturers specializing in non-alcoholic and low-alcohol drinks can capitalize on this trend to reach younger end users and continue steady growth even as conventional alcohol consumption slowly subsides.
Austria Alcoholic Drinks Market Trend
Health-Conscious Drinking Patterns
Austria end users continue to cut back on alcohol consumption, consistent with a long-term trend towards healthier lifestyles. Younger adults especially prefer low- or non-alcoholic drinks, which drive product development and marketing plans throughout the sector.
This is evident in several categories, ranging from beer to spirits and RTDs. The market meets with innovative flavors, low-calorie versions, and convenient packaging, responding to changing end user expectations. Health consciousness and social norms regarding excessive drinking continue to transform consumption patterns.
Unlock Market Intelligence
Explore the market potential with our data-driven report
Austria Alcoholic Drinks Market Opportunity
Innovation in Ready-to-Drink and Non-Alcoholic Products
The increasing popularity of RTDs and non-beverage alcohol offers Austria producers a considerable opportunity. End users are becoming more adventurous to experiment with new tastes and convenient packaging, fueling growth in these new categories.
Manufacturers specialized in low-alcohol and non-alcoholic innovations can engage young and health-aware end users. Increasing the diversity of imaginative flavors and convenient packaging assists brands in differentiating themselves, accommodating changing end user needs, and gaining more market share in spite of slower overall alcohol drinking.
Unlock Market Intelligence
Explore the market potential with our data-driven report
Austria Alcoholic Drinks Market Segmentation Analysis
By Type
- Beer
- Cider/Perry
- RTDs
- Spirits
- Wine
The segment with highest market share under category type is Wine, which captured about 40% of the market. Wine remains a favorite among Austria end users, holding good value despite the general trend of declining alcohol consumption. end users are slowly investigating non-alcoholic and lower-strength beverages, but classic wine still tops the list owing to set drinking habits and the extensive range of products on offer.
The increased demand for wine alternatives like non-alcoholic Mionetto 0.0% demonstrates that end users seek to have healthier alternatives without compromising on the wine experience. Nevertheless, regular wine remains the market leader, a testament to its lasting popularity and firm grip on both the on-trade and retail sectors of Austria.
By Sales Channel
- On-Trade
- Off-Trade
The segment with highest market share under sales channel is On-Trade with a market share of approximately 70%. On-trade sales are bouncing back from the pandemic-driven move to home consumption with increased tourism and the slow return of normal lifestyles. Bars, pubs, and restaurants continue to be significant places for Alcoholic Drinks, notwithstanding continued pressure from high operating costs and inflation.
Off-trade routes like supermarkets, discounters, and hypermarkets continue to maintain a consistent share, with retail e-commerce recording dynamic development. Supermarkets are the leaders with their extensive coverage and convenient weekly shopping. In the meantime, the deposit system introduced in 2025 is expected to have an influence on product ranges in discounters and hypermarkets, shaping end user choice and distribution of sales over the next few years.
Top Companies in Austria Alcoholic Drinks Market
The top companies operating in the market include Zwettl, Privatbrauerei, Weinkellerei Lenz Moser AG, Hirt GmbH, Brauerei, Heineken NV, Stieglbrauerei zu Riedenburg, Franz Huemer & Co, Ottakringer Getränke AG, Egger Privatbrauerei, Brauerei Murau eGen, Oetker-Gruppe, Schlumberger AG, etc., are the top players operating in the Austria Alcoholic Drinks Market.
Frequently Asked Questions
Related Report
1. Market Segmentation
1.1. Research Scope
1.2. Research Methodology
1.3. Definitions and Assumptions
2. Executive Summary
3. Austria Alcoholic Drinks Market Policies, Regulations, and Standards
4. Austria Alcoholic Drinks Market Dynamics
4.1. Growth Factors
4.2. Challenges
4.3. Trends
4.4. Opportunities
5. Austria Alcoholic Drinks Market Statistics, 2022-2032F
5.1. Market Size & Growth Outlook
5.1.1. By Revenues in US$ Million
5.1.2. By Quantity Sold in Million Litres
5.2. Market Segmentation & Growth Outlook
5.2.1. By Type
5.2.1.1. Beer- Market Insights and Forecast 2022-2032, USD Million
5.2.1.2. Cider/Perry- Market Insights and Forecast 2022-2032, USD Million
5.2.1.3. RTDs- Market Insights and Forecast 2022-2032, USD Million
5.2.1.4. Spirits- Market Insights and Forecast 2022-2032, USD Million
5.2.1.5. Wine- Market Insights and Forecast 2022-2032, USD Million
5.2.2. By Alcohol Content
5.2.2.1. High- Market Insights and Forecast 2022-2032, USD Million
5.2.2.2. Medium- Market Insights and Forecast 2022-2032, USD Million
5.2.2.3. Low- Market Insights and Forecast 2022-2032, USD Million
5.2.3. By Flavor
5.2.3.1. Unflavored- Market Insights and Forecast 2022-2032, USD Million
5.2.3.2. Flavored- Market Insights and Forecast 2022-2032, USD Million
5.2.4. By Packaging Type
5.2.4.1. Glass Bottles- Market Insights and Forecast 2022-2032, USD Million
5.2.4.2. Tins- Market Insights and Forecast 2022-2032, USD Million
5.2.4.3. Plastic Bottles- Market Insights and Forecast 2022-2032, USD Million
5.2.4.4. Others- Market Insights and Forecast 2022-2032, USD Million
5.2.5. By Sales Channel
5.2.5.1. On-Trade- Market Insights and Forecast 2022-2032, USD Million
5.2.5.2. Off-Trade- Market Insights and Forecast 2022-2032, USD Million
5.2.5.2.1. Retail Offline- Market Insights and Forecast 2022-2032, USD Million
5.2.5.2.2. Retail Online- Market Insights and Forecast 2022-2032, USD Million
5.2.6. By Competitors
5.2.6.1. Competition Characteristics
5.2.6.2. Market Share & Analysis
6. Austria Beer Market Statistics, 2022-2032F
6.1. Market Size & Growth Outlook
6.1.1. By Revenues in US$ Million
6.1.2. By Quantity Sold in Million Litres
6.2. Market Segmentation & Growth Outlook
6.2.1. By Alcohol Content- Market Insights and Forecast 2022-2032, USD Million
6.2.2. By Flavor- Market Insights and Forecast 2022-2032, USD Million
6.2.3. By Packaging Type- Market Insights and Forecast 2022-2032, USD Million
6.2.4. By Sales Channel- Market Insights and Forecast 2022-2032, USD Million
7. Austria Cider/Perry Market Statistics, 2022-2032F
7.1. Market Size & Growth Outlook
7.1.1. By Revenues in US$ Million
7.1.2. By Quantity Sold in Million Litres
7.2. Market Segmentation & Growth Outlook
7.2.1. By Alcohol Content- Market Insights and Forecast 2022-2032, USD Million
7.2.2. By Flavor- Market Insights and Forecast 2022-2032, USD Million
7.2.3. By Packaging Type- Market Insights and Forecast 2022-2032, USD Million
7.2.4. By Sales Channel- Market Insights and Forecast 2022-2032, USD Million
8. Austria Ready-to-Drink Market Statistics, 2022-2032F
8.1. Market Size & Growth Outlook
8.1.1. By Revenues in US$ Million
8.1.2. By Quantity Sold in Million Litres
8.2. Market Segmentation & Growth Outlook
8.2.1. By Alcohol Content- Market Insights and Forecast 2022-2032, USD Million
8.2.2. By Flavor- Market Insights and Forecast 2022-2032, USD Million
8.2.3. By Packaging Type- Market Insights and Forecast 2022-2032, USD Million
8.2.4. By Sales Channel- Market Insights and Forecast 2022-2032, USD Million
9. Austria Spirits Market Statistics, 2022-2032F
9.1. Market Size & Growth Outlook
9.1.1. By Revenues in US$ Million
9.1.2. By Quantity Sold in Million Litres
9.2. Market Segmentation & Growth Outlook
9.2.1. By Alcohol Content- Market Insights and Forecast 2022-2032, USD Million
9.2.2. By Flavor- Market Insights and Forecast 2022-2032, USD Million
9.2.3. By Packaging Type- Market Insights and Forecast 2022-2032, USD Million
9.2.4. By Sales Channel- Market Insights and Forecast 2022-2032, USD Million
10. Austria Wine Market Statistics, 2022-2032F
10.1.Market Size & Growth Outlook
10.1.1. By Revenues in US$ Million
10.1.2. By Quantity Sold in Million Litres
10.2.Market Segmentation & Growth Outlook
10.2.1. By Alcohol Content- Market Insights and Forecast 2022-2032, USD Million
10.2.2. By Flavor- Market Insights and Forecast 2022-2032, USD Million
10.2.3. By Packaging Type- Market Insights and Forecast 2022-2032, USD Million
10.2.4. By Sales Channel- Market Insights and Forecast 2022-2032, USD Million
11. Competitive Outlook
11.1.Company Profiles
11.1.1. Heineken NV
11.1.1.1. Business Description
11.1.1.2. Product Portfolio
11.1.1.3. Collaborations & Alliances
11.1.1.4. Recent Developments
11.1.1.5. Financial Details
11.1.1.6. Others
11.1.2. Stieglbrauerei zu Riedenburg, Franz Huemer & Co
11.1.2.1. Business Description
11.1.2.2. Product Portfolio
11.1.2.3. Collaborations & Alliances
11.1.2.4. Recent Developments
11.1.2.5. Financial Details
11.1.2.6. Others
11.1.3. Ottakringer Getränke AG
11.1.3.1. Business Description
11.1.3.2. Product Portfolio
11.1.3.3. Collaborations & Alliances
11.1.3.4. Recent Developments
11.1.3.5. Financial Details
11.1.3.6. Others
11.1.4. Egger Privatbrauerei
11.1.4.1. Business Description
11.1.4.2. Product Portfolio
11.1.4.3. Collaborations & Alliances
11.1.4.4. Recent Developments
11.1.4.5. Financial Details
11.1.4.6. Others
11.1.5. Brauerei Murau eGen
11.1.5.1. Business Description
11.1.5.2. Product Portfolio
11.1.5.3. Collaborations & Alliances
11.1.5.4. Recent Developments
11.1.5.5. Financial Details
11.1.5.6. Others
11.1.6. Zwettl, Privatbrauerei
11.1.6.1. Business Description
11.1.6.2. Product Portfolio
11.1.6.3. Collaborations & Alliances
11.1.6.4. Recent Developments
11.1.6.5. Financial Details
11.1.6.6. Others
11.1.7. Weinkellerei Lenz Moser AG
11.1.7.1. Business Description
11.1.7.2. Product Portfolio
11.1.7.3. Collaborations & Alliances
11.1.7.4. Recent Developments
11.1.7.5. Financial Details
11.1.7.6. Others
11.1.8. Hirt GmbH, Brauerei
11.1.8.1. Business Description
11.1.8.2. Product Portfolio
11.1.8.3. Collaborations & Alliances
11.1.8.4. Recent Developments
11.1.8.5. Financial Details
11.1.8.6. Others
11.1.9. Oetker-Gruppe
11.1.9.1. Business Description
11.1.9.2. Product Portfolio
11.1.9.3. Collaborations & Alliances
11.1.9.4. Recent Developments
11.1.9.5. Financial Details
11.1.9.6. Others
11.1.10. Schlumberger AG
11.1.10.1. Business Description
11.1.10.2. Product Portfolio
11.1.10.3. Collaborations & Alliances
11.1.10.4. Recent Developments
11.1.10.5. Financial Details
11.1.10.6. Others
12. Disclaimer
| Segment | Sub-Segment |
|---|---|
| By Type |
|
| By Alcohol Content |
|
| By Flavor |
|
| By Packaging Type |
|
| By Sales Channel |
|
Research Methodology
This study followed a structured approach comprising four key phases to assess the size and scope of the electro-oxidation market. The process began with thorough secondary research to collect data on the target market, related markets, and broader industry context. These findings, along with preliminary assumptions and estimates, were then validated through extensive primary research involving industry experts from across the value chain. To calculate the overall market size, both top-down and bottom-up methodologies were employed. Finally, market segmentation and data triangulation techniques were applied to refine and validate segment-level estimations.
Secondary Research
The secondary research phase involved gathering data from a wide range of credible and published sources. This step helped in identifying industry trends, defining market segmentation, and understanding the market landscape and value chain.
Sources consulted during this phase included:
- Company annual reports, investor presentations, and press releases
- Industry white papers and certified publications
- Trade directories and market-recognized databases
- Articles from authoritative authors and reputable journals
- Gold and silver standard websites
Secondary research was critical in mapping out the industry's value chain and monetary flow, identifying key market segments, understanding regional variations, and tracking significant industry developments.
Other key sources:
- Financial disclosures
- Industry associations and trade bodies
- News outlets and business magazines
- Academic journals and research studies
- Paid industry databases
Primary Research
To validate secondary data and gain deeper market insights, primary research was conducted with key stakeholders across both the supply and demand sides of the market.
On the demand side, participants included decision-makers and influencers from end-user industries—such as CIOs, CTOs, and CSOs—who provided first-hand perspectives on market needs, product usage, and future expectations.
On the supply side, interviews were conducted with manufacturers, industry associations, and institutional participants to gather insights into current offerings, product pipelines, and market challenges.
Primary interviews provided critical inputs such as:
- Market size and revenue data
- Product and service breakdowns
- Market forecasts
- Regional and application-specific trends
Stakeholders consulted included:
- Leading OEM and solution providers
- Channel and distribution partners
- End users across various applications
- Independent consultants and industry specialists
Market Size Estimation and Data Triangulation
- Identifying Key Market Participants (Secondary Research)
- Goal: To identify the major players or companies in the target market. This typically involves using publicly available data sources such as industry reports, market research publications, and financial statements of companies.
- Tools: Reports from firms like Gartner, Forrester, Euromonitor, Statista, IBISWorld, and others. Public financial statements, news articles, and press releases from top market players.
- Extracting Earnings of Key Market Participants
- Goal: To estimate the earnings generated from the product or service being analyzed. This step helps in understanding the revenue potential of each market player in a specific geography.
- Methods: Earnings data can be gathered from:
- Publicly available financial reports (for listed companies).
- Interviews and primary data sources from professionals, such as Directors, VPs, SVPs, etc. This is especially useful for understanding more nuanced, internal data that isn't publicly disclosed.
- Annual reports and investor presentations of key players.
- Data Collation and Development of a Relevant Data Model
- Goal: To collate inputs from both primary and secondary sources into a structured, data-driven model for market estimation. This model will incorporate key market KPIs and any independent variables relevant to the market.
- Key KPIs: These could include:
- Market size, growth rate, and demand drivers.
- Industry-specific metrics like market share, average revenue per customer (ARPC), or average deal size.
- External variables, such as economic growth rates, inflation rates, or commodity prices, that could affect the market.
- Data Modeling: Based on this data, the market forecasts are developed for the next 5 years. A combination of trend analysis, scenario modeling, and statistical regression might be used to generate projections.
- Scenario Analysis
- Goal: To test different assumptions and validate how sensitive the market is to changes in key variables (e.g., market demand, regulatory changes, technological disruptions).
- Types of Scenarios:
- Base Case: Based on current assumptions and historical data.
- Best-Case Scenario: Assuming favorable market conditions, regulatory environments, and technological advancements.
- Worst-Case Scenario: Accounting for adverse factors, such as economic downturns, stricter regulations, or unexpected disruptions.


