Australia Alcoholic Drinks Market Report: Trends, Growth and Forecast (2026-2032)
By Type (Beer, Cider/Perry, RTDs, Spirits, Wine), By Alcohol Content (High, Medium, Low), By Flavor (Unflavored, Flavored), By Packaging Type (Glass Bottles, Tins, Plastic Bottles, Others), By Sales Channel (On-Trade, Off-Trade (Retail Offline, Retail Online)) ... Read more
|
Major Players
|
Australia Alcoholic Drinks Market Statistics and Insights, 2026
- Market Size Statistics
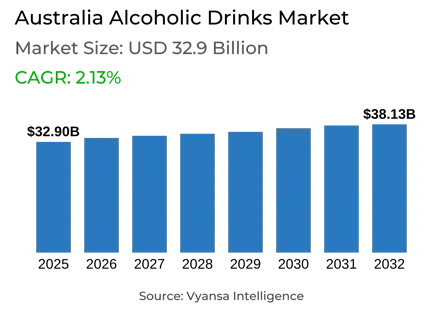
- Alcoholic Drinks in Australia is estimated at $ 32.9 Billion.
- The market size is expected to grow to $ 38.13 Billion by 2032.
- Market to register a CAGR of around 2.13% during 2026-32.
- Type Shares
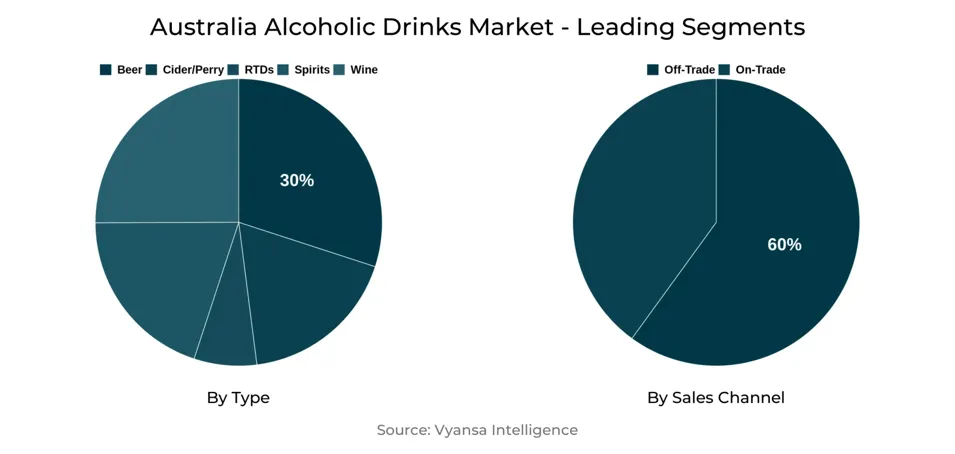
- Beer grabbed market share of 30%.
- Beer to witness a volume CAGR of around 1.24%.
- Competition
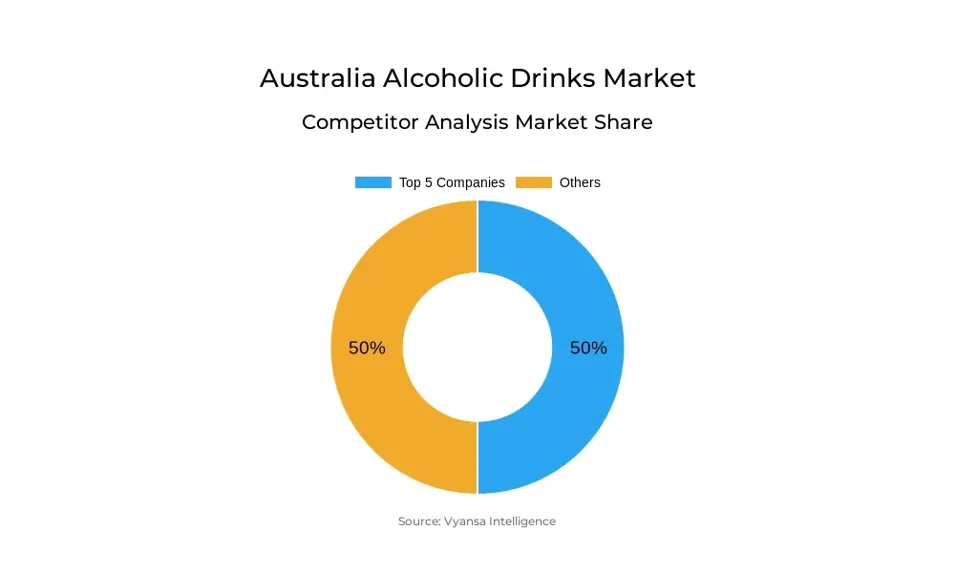
- More than 10 companies are actively engaged in producing Alcoholic Drinks in Australia.
- Top 5 companies acquired 50% of the market share.
- Accolade Wines Ltd, Diageo Plc, Coopers Brewery Ltd, Asahi Group Holdings Ltd, Kirin Holdings Co Ltd etc., are few of the top companies.
- Sales Channel
- Off-Trade grabbed 60% of the market.
Australia Alcoholic Drinks Market Outlook
The Australia Alcoholic Drinks market is forecast at AUD 32.9 billion and is projected to reach AUD 38.13 billion in 2032, constituting moderate growth during the forecast period. This growth is likely to be curbed by market maturity, increasing health-consciousness, and a continued move towards responsible consumption. Younger end users are increasingly reducing alcohol intake or opting for low- and non-alcoholic alternatives, while older end users continue to drive demand for premium products in the off-trade channel. Off-trade sales currently hold a 60% share of the market, highlighting the importance of retail channels and home consumption in overall market performance.
Beer is to experience a consistent volume CAGR of approximately 1.24% owing to its popularity as an everyday, affordable drink. The category is supported by on-trade and off-trade consumption, although premium beer can experience slower growth as a result of inflation and value-led end users. RTDs are likely to be the most dynamic category among younger end users owing to their convenience, lower ABV, and numerous flavour variations. Innovations like low-sugar or higher-ABV versions would be likely to retain end user interest in this category.
Spirits and wine will see more subdued growth, with lighter, healthier alternatives capturing end users' preference. Suppliers will keep innovating, bringing low-alcohol, non-alcoholic, and health-focused versions to the market to maintain interest and keep pace with changing consumption patterns. Government policy changes in New South Wales and Victoria to revitalize nightlife and relax business limitations will likely spur on-trade development, promoting social consumption occasions and investment in on-trade sites.
Overall, the market will be influenced by evolving lifestyles, health trends, and end user preferences. Although premiumisation will encounter some headwinds, growth opportunities lie through innovation, on-trade experiences, and appealing to younger, health-aware end users who want easy-drinking, convenient, and enjoyable alcoholic drinks.
Australia Alcoholic Drinks Market Growth Driver
Rising Health and Wellness Awareness
Health and wellbeing consciousness is a major motivator of the Alcoholic Drinks industry. Australia are moderating alcohol consumption increasingly, looking for lower-strength and non-alcoholic drinks. This trend spurs innovation across beer, RTDs, and spirits categories, providing end users with improved-for-you products without sacrificing taste or social convenience.
end users are especially attracted to products that support active lifestyles, e.g., low-sugar, low-carb, or functional drinks. Brands with easy-drinking, great-tasting, and health-driven offerings can gain new end users while keeping existing ones. Increasing demand for healthier options is increasing the size of the total market by creating demand for both traditional and non-traditional alcoholic beverage categories, keeping growth going even in the midst of conservative end user expenditure.
Australia Alcoholic Drinks Market Trend
Rise of Low- and No-Alcoholic Drinks
The market for Alcoholic Drinks is seeing a distinct trend towards low- and no-alcohol drinks. Australia, and particularly young adult end users, are lowering their alcohol consumption and looking for products that deliver taste, social pleasure, and convenience without adverse health consequences.
The trend fuels innovation, with companies launching low-carb beers, spirits-free beverages, and non-alcoholic RTDs. All these products are becoming mainstream, disrupting old categories and resonating with health-aware end users. The trend has also impacted product innovation and marketing efforts, motivating companies to place greater emphasis on health-focused and socially conscious offerings. In the long term, the growth of low- and no-Alcoholic Drinkss is likely to redefine end user aspirations and open up new opportunities for Alcoholic Drinks in Australia.
Unlock Market Intelligence
Explore the market potential with our data-driven report
Australia Alcoholic Drinks Market Opportunity
Local and Flavoured Spirits Innovation
Australia distilleries are seizing creative opportunities by using local materials and cultural heritage to produce flavoured spirits. Items which emphasize authenticity, classic recipes, or familiar local tastes resonate with end users who are looking for novelty and a sense of belonging.
This approach enables brands to differentiate themselves in a crowded market and address traditional drinkers as well as new end users. Locally inspired and flavoured spirits offer the potential for premiumisation while sparking interest in niche areas. Innovating in flavour and storytelling enables companies to build deeper end user connections, develop brand loyalty, and drive growth throughout the spirits sector. This is consistent with changing end user demand for products that are authentic, creative, and deliver a distinctive drinking experience.
Unlock Market Intelligence
Explore the market potential with our data-driven report
Australia Alcoholic Drinks Market Segmentation Analysis
By Type
- Beer
- Cider/Perry
- RTDs
- Spirits
- Wine
The segment with highest market share under Type is Beer, and it accounts for approximately 30% of the Australia alcoholic beverage market. Beer continues to be favored because of its affordability and popularity as a daily drink, particularly in times of economic strain. People prefer beer as opposed to high-value drinks such as spirits or champagne, mirroring the persisting cost-cutting attitude in the market. In spite of moderate expansion, beer continues to prove to be robust relative to other categories.
Beer is anticipated to see a volume CAGR of approximately 1.24% during the forecast period. This is driven by innovation in low-carb and healthier beer variants, tapping into the growing health-conscious end user base. On-trade and off-trade channels are both driving its consistent demand, with off-trade continuing to be dominant because of convenience and price sensitivity in purchases. Beer is a stable, high-volume driver overall in the Australia alcoholic beverage market.
By Sales Channel
- On-Trade
- Off-Trade
The segment with highest market share under Sales Channel is Off-Trade, accounting for 60% of the market. Off-trade purchasing involves purchases made from liquor stores, supermarkets, and internet sites, providing convenience and value for money. People increasingly use off-trade channels for consumption at home, particularly when there is economic insecurity, constraining discretionary expenditure on social events. This trend is bolstered by online services such as click-and-collect and home delivery, and off-trade becomes more convenient.
Off-trade is also fuelled by aged end users with greater disposable incomes and a desire for premium products bought for consumption at home. Retailers like Liquorland and Thirsty Camel are consolidating their positions through loyalty schemes and online engagement, further enabling repeat buying. The synergy of convenience, value for money, and service innovation makes off-trade Australia's largest and most durable alcoholic beverage sales channel.
Top Companies in Australia Alcoholic Drinks Market
The top companies operating in the market include Accolade Wines Ltd, Diageo Plc, Coopers Brewery Ltd, Asahi Group Holdings Ltd, Kirin Holdings Co Ltd, Anheuser-Busch InBev NV, Suntory Holdings Ltd, Treasury Wine Estates Ltd, Pernod Ricard Groupe, Brown-Forman Corp, etc., are the top players operating in the Australia Alcoholic Drinks Market.
Frequently Asked Questions
Related Report
1. Market Segmentation
1.1. Research Scope
1.2. Research Methodology
1.3. Definitions and Assumptions
2. Executive Summary
3. Australia Alcoholic Drinks Market Policies, Regulations, and Standards
4. Australia Alcoholic Drinks Market Dynamics
4.1. Growth Factors
4.2. Challenges
4.3. Trends
4.4. Opportunities
5. Australia Alcoholic Drinks Market Statistics, 2022-2032F
5.1. Market Size & Growth Outlook
5.1.1. By Revenues in US$ Million
5.1.2. By Quantity Sold in Million Litres
5.2. Market Segmentation & Growth Outlook
5.2.1. By Type
5.2.1.1. Beer- Market Insights and Forecast 2022-2032, USD Million
5.2.1.2. Cider/Perry- Market Insights and Forecast 2022-2032, USD Million
5.2.1.3. RTDs- Market Insights and Forecast 2022-2032, USD Million
5.2.1.4. Spirits- Market Insights and Forecast 2022-2032, USD Million
5.2.1.5. Wine- Market Insights and Forecast 2022-2032, USD Million
5.2.2. By Alcohol Content
5.2.2.1. High- Market Insights and Forecast 2022-2032, USD Million
5.2.2.2. Medium- Market Insights and Forecast 2022-2032, USD Million
5.2.2.3. Low- Market Insights and Forecast 2022-2032, USD Million
5.2.3. By Flavor
5.2.3.1. Unflavored- Market Insights and Forecast 2022-2032, USD Million
5.2.3.2. Flavored- Market Insights and Forecast 2022-2032, USD Million
5.2.4. By Packaging Type
5.2.4.1. Glass Bottles- Market Insights and Forecast 2022-2032, USD Million
5.2.4.2. Tins- Market Insights and Forecast 2022-2032, USD Million
5.2.4.3. Plastic Bottles- Market Insights and Forecast 2022-2032, USD Million
5.2.4.4. Others- Market Insights and Forecast 2022-2032, USD Million
5.2.5. By Sales Channel
5.2.5.1. On-Trade- Market Insights and Forecast 2022-2032, USD Million
5.2.5.2. Off-Trade- Market Insights and Forecast 2022-2032, USD Million
5.2.5.2.1. Retail Offline- Market Insights and Forecast 2022-2032, USD Million
5.2.5.2.2. Retail Online- Market Insights and Forecast 2022-2032, USD Million
5.2.6. By Competitors
5.2.6.1. Competition Characteristics
5.2.6.2. Market Share & Analysis
6. Australia Beer Market Statistics, 2022-2032F
6.1. Market Size & Growth Outlook
6.1.1. By Revenues in US$ Million
6.1.2. By Quantity Sold in Million Litres
6.2. Market Segmentation & Growth Outlook
6.2.1. By Alcohol Content- Market Insights and Forecast 2022-2032, USD Million
6.2.2. By Flavor- Market Insights and Forecast 2022-2032, USD Million
6.2.3. By Packaging Type- Market Insights and Forecast 2022-2032, USD Million
6.2.4. By Sales Channel- Market Insights and Forecast 2022-2032, USD Million
7. Australia Cider/Perry Market Statistics, 2022-2032F
7.1. Market Size & Growth Outlook
7.1.1. By Revenues in US$ Million
7.1.2. By Quantity Sold in Million Litres
7.2. Market Segmentation & Growth Outlook
7.2.1. By Alcohol Content- Market Insights and Forecast 2022-2032, USD Million
7.2.2. By Flavor- Market Insights and Forecast 2022-2032, USD Million
7.2.3. By Packaging Type- Market Insights and Forecast 2022-2032, USD Million
7.2.4. By Sales Channel- Market Insights and Forecast 2022-2032, USD Million
8. Australia Ready-to-Drink Market Statistics, 2022-2032F
8.1. Market Size & Growth Outlook
8.1.1. By Revenues in US$ Million
8.1.2. By Quantity Sold in Million Litres
8.2. Market Segmentation & Growth Outlook
8.2.1. By Alcohol Content- Market Insights and Forecast 2022-2032, USD Million
8.2.2. By Flavor- Market Insights and Forecast 2022-2032, USD Million
8.2.3. By Packaging Type- Market Insights and Forecast 2022-2032, USD Million
8.2.4. By Sales Channel- Market Insights and Forecast 2022-2032, USD Million
9. Australia Spirits Market Statistics, 2022-2032F
9.1. Market Size & Growth Outlook
9.1.1. By Revenues in US$ Million
9.1.2. By Quantity Sold in Million Litres
9.2. Market Segmentation & Growth Outlook
9.2.1. By Alcohol Content- Market Insights and Forecast 2022-2032, USD Million
9.2.2. By Flavor- Market Insights and Forecast 2022-2032, USD Million
9.2.3. By Packaging Type- Market Insights and Forecast 2022-2032, USD Million
9.2.4. By Sales Channel- Market Insights and Forecast 2022-2032, USD Million
10. Australia Wine Market Statistics, 2022-2032F
10.1.Market Size & Growth Outlook
10.1.1. By Revenues in US$ Million
10.1.2. By Quantity Sold in Million Litres
10.2.Market Segmentation & Growth Outlook
10.2.1. By Alcohol Content- Market Insights and Forecast 2022-2032, USD Million
10.2.2. By Flavor- Market Insights and Forecast 2022-2032, USD Million
10.2.3. By Packaging Type- Market Insights and Forecast 2022-2032, USD Million
10.2.4. By Sales Channel- Market Insights and Forecast 2022-2032, USD Million
11. Competitive Outlook
11.1.Company Profiles
11.1.1. Asahi Group Holdings Ltd
11.1.1.1. Business Description
11.1.1.2. Product Portfolio
11.1.1.3. Collaborations & Alliances
11.1.1.4. Recent Developments
11.1.1.5. Financial Details
11.1.1.6. Others
11.1.2. Kirin Holdings Co Ltd
11.1.2.1. Business Description
11.1.2.2. Product Portfolio
11.1.2.3. Collaborations & Alliances
11.1.2.4. Recent Developments
11.1.2.5. Financial Details
11.1.2.6. Others
11.1.3. Anheuser-Busch InBev NV
11.1.3.1. Business Description
11.1.3.2. Product Portfolio
11.1.3.3. Collaborations & Alliances
11.1.3.4. Recent Developments
11.1.3.5. Financial Details
11.1.3.6. Others
11.1.4. Suntory Holdings Ltd
11.1.4.1. Business Description
11.1.4.2. Product Portfolio
11.1.4.3. Collaborations & Alliances
11.1.4.4. Recent Developments
11.1.4.5. Financial Details
11.1.4.6. Others
11.1.5. Treasury Wine Estates Ltd
11.1.5.1. Business Description
11.1.5.2. Product Portfolio
11.1.5.3. Collaborations & Alliances
11.1.5.4. Recent Developments
11.1.5.5. Financial Details
11.1.5.6. Others
11.1.6. Accolade Wines Ltd
11.1.6.1. Business Description
11.1.6.2. Product Portfolio
11.1.6.3. Collaborations & Alliances
11.1.6.4. Recent Developments
11.1.6.5. Financial Details
11.1.6.6. Others
11.1.7. Diageo Plc
11.1.7.1. Business Description
11.1.7.2. Product Portfolio
11.1.7.3. Collaborations & Alliances
11.1.7.4. Recent Developments
11.1.7.5. Financial Details
11.1.7.6. Others
11.1.8. Coopers Brewery Ltd
11.1.8.1. Business Description
11.1.8.2. Product Portfolio
11.1.8.3. Collaborations & Alliances
11.1.8.4. Recent Developments
11.1.8.5. Financial Details
11.1.8.6. Others
11.1.9. Pernod Ricard Groupe
11.1.9.1. Business Description
11.1.9.2. Product Portfolio
11.1.9.3. Collaborations & Alliances
11.1.9.4. Recent Developments
11.1.9.5. Financial Details
11.1.9.6. Others
11.1.10. Brown-Forman Corp
11.1.10.1. Business Description
11.1.10.2. Product Portfolio
11.1.10.3. Collaborations & Alliances
11.1.10.4. Recent Developments
11.1.10.5. Financial Details
11.1.10.6. Others
12. Disclaimer
| Segment | Sub-Segment |
|---|---|
| By Type |
|
| By Alcohol Content |
|
| By Flavor |
|
| By Packaging Type |
|
| By Sales Channel |
|
Research Methodology
This study followed a structured approach comprising four key phases to assess the size and scope of the electro-oxidation market. The process began with thorough secondary research to collect data on the target market, related markets, and broader industry context. These findings, along with preliminary assumptions and estimates, were then validated through extensive primary research involving industry experts from across the value chain. To calculate the overall market size, both top-down and bottom-up methodologies were employed. Finally, market segmentation and data triangulation techniques were applied to refine and validate segment-level estimations.
Secondary Research
The secondary research phase involved gathering data from a wide range of credible and published sources. This step helped in identifying industry trends, defining market segmentation, and understanding the market landscape and value chain.
Sources consulted during this phase included:
- Company annual reports, investor presentations, and press releases
- Industry white papers and certified publications
- Trade directories and market-recognized databases
- Articles from authoritative authors and reputable journals
- Gold and silver standard websites
Secondary research was critical in mapping out the industry's value chain and monetary flow, identifying key market segments, understanding regional variations, and tracking significant industry developments.
Other key sources:
- Financial disclosures
- Industry associations and trade bodies
- News outlets and business magazines
- Academic journals and research studies
- Paid industry databases
Primary Research
To validate secondary data and gain deeper market insights, primary research was conducted with key stakeholders across both the supply and demand sides of the market.
On the demand side, participants included decision-makers and influencers from end-user industries—such as CIOs, CTOs, and CSOs—who provided first-hand perspectives on market needs, product usage, and future expectations.
On the supply side, interviews were conducted with manufacturers, industry associations, and institutional participants to gather insights into current offerings, product pipelines, and market challenges.
Primary interviews provided critical inputs such as:
- Market size and revenue data
- Product and service breakdowns
- Market forecasts
- Regional and application-specific trends
Stakeholders consulted included:
- Leading OEM and solution providers
- Channel and distribution partners
- End users across various applications
- Independent consultants and industry specialists
Market Size Estimation and Data Triangulation
- Identifying Key Market Participants (Secondary Research)
- Goal: To identify the major players or companies in the target market. This typically involves using publicly available data sources such as industry reports, market research publications, and financial statements of companies.
- Tools: Reports from firms like Gartner, Forrester, Euromonitor, Statista, IBISWorld, and others. Public financial statements, news articles, and press releases from top market players.
- Extracting Earnings of Key Market Participants
- Goal: To estimate the earnings generated from the product or service being analyzed. This step helps in understanding the revenue potential of each market player in a specific geography.
- Methods: Earnings data can be gathered from:
- Publicly available financial reports (for listed companies).
- Interviews and primary data sources from professionals, such as Directors, VPs, SVPs, etc. This is especially useful for understanding more nuanced, internal data that isn't publicly disclosed.
- Annual reports and investor presentations of key players.
- Data Collation and Development of a Relevant Data Model
- Goal: To collate inputs from both primary and secondary sources into a structured, data-driven model for market estimation. This model will incorporate key market KPIs and any independent variables relevant to the market.
- Key KPIs: These could include:
- Market size, growth rate, and demand drivers.
- Industry-specific metrics like market share, average revenue per customer (ARPC), or average deal size.
- External variables, such as economic growth rates, inflation rates, or commodity prices, that could affect the market.
- Data Modeling: Based on this data, the market forecasts are developed for the next 5 years. A combination of trend analysis, scenario modeling, and statistical regression might be used to generate projections.
- Scenario Analysis
- Goal: To test different assumptions and validate how sensitive the market is to changes in key variables (e.g., market demand, regulatory changes, technological disruptions).
- Types of Scenarios:
- Base Case: Based on current assumptions and historical data.
- Best-Case Scenario: Assuming favorable market conditions, regulatory environments, and technological advancements.
- Worst-Case Scenario: Accounting for adverse factors, such as economic downturns, stricter regulations, or unexpected disruptions.


