Bolivia Alcoholic Drinks Market Report: Trends, Growth and Forecast (2026-2032)
By Type (Beer, Cider/Perry, RTDs, Spirits, Wine), By Alcohol Content (High, Medium, Low), By Flavor (Unflavored, Flavored), By Packaging Type (Glass Bottles, Tins, Plastic Bottles, Others), By Sales Channel (On-Trade, Off-Trade (Retail Offline, Retail Online)) ... Read more
|
Major Players
|
Bolivia Alcoholic Drinks Market Statistics and Insights, 2026
- Market Size Statistics
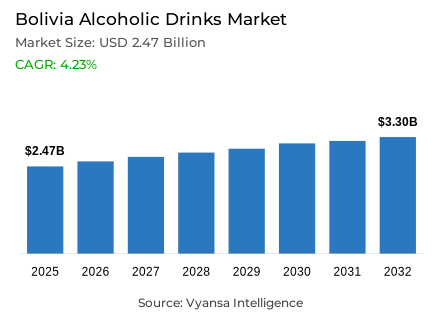
- Alcoholic Drinks in Bolivia is estimated at $ 2.47 Billion.
- The market size is expected to grow to $ 3.3 Billion by 2032.
- Market to register a CAGR of around 4.23% during 2026-32.
- Type Shares
- Beer grabbed market share of 80%.
- Beer to witness a volume CAGR of around 3.95%.
- Competition
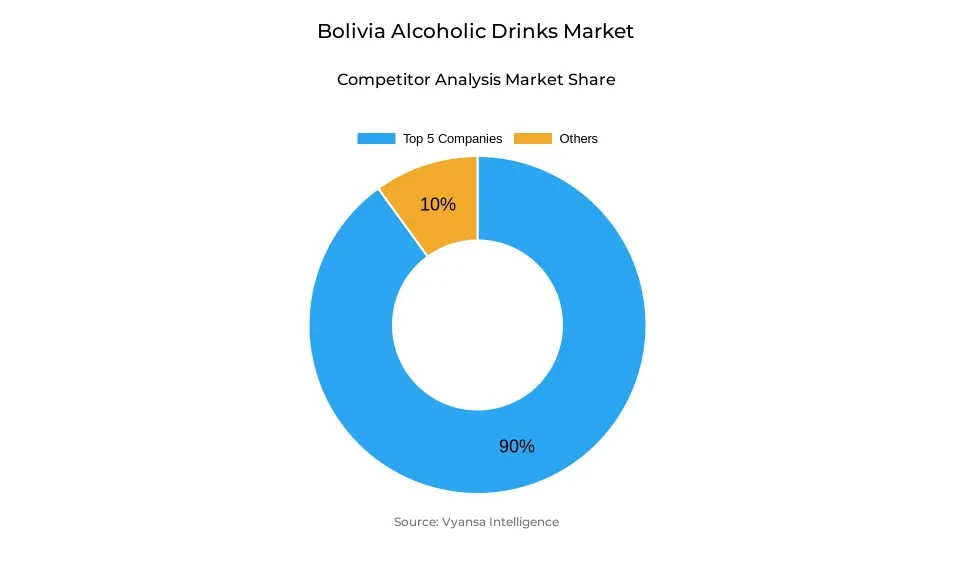
- More than 10 companies are actively engaged in producing Alcoholic Drinks in Bolivia.
- Top 5 companies acquired 90% of the market share.
- Heineken NV, Sociedad Industrial del Sur, Sociedad Agroindustrial del Valle SRL, Anheuser-Busch InBev NV, Casa Di Conti Ltda etc., are few of the top companies.
- Sales Channel
- On-Trade grabbed 70% of the market.
Bolivia Alcoholic Drinks Market Outlook
The Bolivia Alcoholic Drinks market is worth USD 2.47 billion and is expected to reach USD 3.3 billion by 2032. Expansion will be spurred by the gradual reduction in contraband, which had long threatened legal sales. With increasing parallel exchange rate rendering smuggling unprofitable, legitimate players are set to gain more market share. On-trade channels, which represent 70% of current sales, will continue to be key to expansion, especially with the significance of beer, singani, rum, and bitters to Bolivia social and cultural rituals.
Beer, the biggest group, is expected to post a volume CAGR of approximately 3.95% over the forecast period. end users switch from premium-priced spirits to mid-priced and domestically brewed beers will remain demand drivers, as will decreased contraband further buttressing legal sales. Bitters will gain, riding their high cultural popularity and affordability, particularly for celebratory purposes. RTDs will continue to ride momentum as young end users seek convenient, more affordable alternatives to spirits.
Luxury spirits will still have to struggle with the threat of smuggling in via Peru, where tariffs are low and border controls are poor and allow in illicit whisky and other imports. This will restrain high-end brand growth, with the majority of opportunities in mid-range and domestically manufactured segments.
Overall, there is a positive market outlook even with persistent currency pressures and political instability. Businesses are likely to focus on products with robust turnover and profitability while using e-commerce, modern retail, and on-trade activations to engage end users. Locally brewed beverages will be in a good position as value-for-money substitutes, supporting continued value and volume growth.
Bolivia Alcoholic Drinks Market Growth Driver
Shrinking Contraband Facilitates Market Growth
A key growth driver is the decline in contraband liquor, which is supporting formal market sales and boosting overall industry value. The increase in the parallel exchange rate has reduced profit margins for smugglers, which has caused many to reduce activity. This shift has created a window of opportunity for legal firms to regain lost market share, particularly in segments such as beer and bitters that were most hit by illegal trade.
As contraband products lose their cost differential, end users are moving towards legally distributed products. This movement consolidates the position of strong players and makes them promote their presence through brand building and better distribution. The reduction in illegal trade is thus a strong catalyst that stabilizes the market and lays the ground for sustained growth.
Bolivia Alcoholic Drinks Market Challenge
Increasing Imported Input Costs Present a Hindrance
The economy still suffers from the lack of availability of US dollars, making it increasingly difficult for companies to cope with operational expenses. Since most Alcoholic Drinkss rely so much on imported components, this condition pushes prices upwards, both for inputs as well as for final products. This leaves local players with limited scope in increasing their product offerings, reducing diversity for end users.
This challenge also lowers the competitiveness of import brands, since increased costs make it hard to place them reasonably in the market. The price-sensitive market requires firms to focus on only the most profitable offerings, and this translates to lower innovation and fewer choices for the end user. Generally, the high cost of imports is a critical issue that limits market expansion.
Unlock Market Intelligence
Explore the market potential with our data-driven report
Bolivia Alcoholic Drinks Market Trend
Transition from Spirits to Beer Among end users
A prevalent trend dominating the market is the increased demand for beer compared to spirits. With the spike in the price of spirits following exchange rate variations, the end user is turning towards beer as a more price-friendly option. Beer, the largest segment, gains substantially from this change, as it is complementary to the value-driven decision of price-conscious end users.
This migration mirrors how end user trend is changing according to affordability and availability. Moreover, the lawfulness of brands such as Budweiser and Schneider, previously sold largely via illicit routes, has additionally propelled this trend. The gradual shift away from spirits towards beer mirrors a broader trend in drinking habits and continues to remake demand throughout the marketplace.
Bolivia Alcoholic Drinks Market Opportunity
Growing Demand of RTDs Among Youth end users
Ready-to-drink (RTD) items offer a high growth potential in the market. Their convenience and affordability ensure that they can fit into various occasions, ranging from social gatherings to celebrative parties. The spike in prices of spirits such as gin, vodka, and tequila is also driving end users, especially the younger generation, towards RTDs as a cheaper option with cocktail-like taste.
Local manufacturers are spearheading this transformation by providing newer product lines at competitive prices. This allows them to win over younger end users who believe in variety and value for money. With the demand growing in this segment, RTDs prove to be a major opportunity for businesses to diversify products and consolidate their presence in the changing market.
Unlock Market Intelligence
Explore the market potential with our data-driven report
Bolivia Alcoholic Drinks Market Segmentation Analysis

By Type
- Beer
- Cider/Perry
- RTDs
- Spirits
- Wine
The segment with highest market share under Type is Beer, which gained almost 80% of the market. Beer was the most dominant category in 2025 as well, as smuggling decreased and spirits became more expensive, thus changing end user tastes. Mid-range international brands such as Budweiser and Schneider penetrated the legal market, attracting end users who switched from expensive spirits. These increases sustained Beer leadership in Bolivia, where it was the leading contributor to total alcoholic beverage sales.
Beer is also expected to record a volume CAGR of approximately 3.95% over the forecast period. Its attractiveness will remain due to its relative affordability vs. spirits, high end user loyalty, and rich cultural tradition in Bolivia festive and social culture. As contraband lowers and legal alternatives widen, Beer will stay the core growth driver of the Alcoholic Drinks market.
By Sales Channel
- On-Trade
- Off-Trade
The segment with highest market share under Sales Channel is On-Trade, which took almost 70% of the market. In 2025, the channel recovered well, exceeding pre-pandemic levels even with growing prices. Classic consumption behavior aided categories such as beer, singani, rum, and bitters, and large concerts, festivals, and Carnival celebrations gave additional thrust towards growth in bars, clubs, and restaurants.
On-Trade will remain the powerhouse in Bolivia Alcoholic Drinks market, as it merges cultural rituals with contemporary social occasions to drive demand. The channel enjoys a deep affinity with festive events and country-wide celebrations, which make it stable even during financially stressful times. As a result of the regular unveiling of new brands and continued end user interaction, On-Trade will maintain its top share of the market through the forecast period.
Top Companies in Bolivia Alcoholic Drinks Market
The top companies operating in the market include Heineken NV, Sociedad Industrial del Sur, Sociedad Agroindustrial del Valle SRL, Anheuser-Busch InBev NV, Casa Di Conti Ltda, Cía Cervecerías Unidas SA, Cervecería Nacional Potosí Ltda, Global Marketing & Sales Inc, INAB - Industria Nacional de Bebidas Ltda, Phusion Projects LLC, etc., are the top players operating in the Bolivia Alcoholic Drinks Market.
Frequently Asked Questions
Related Report
1. Market Segmentation
1.1. Research Scope
1.2. Research Methodology
1.3. Definitions and Assumptions
2. Executive Summary
3. Bolivia Alcoholic Drinks Market Policies, Regulations, and Standards
4. Bolivia Alcoholic Drinks Market Dynamics
4.1. Growth Factors
4.2. Challenges
4.3. Trends
4.4. Opportunities
5. Bolivia Alcoholic Drinks Market Statistics, 2022-2032F
5.1. Market Size & Growth Outlook
5.1.1. By Revenues in US$ Million
5.1.2. By Quantity Sold in Million Litres
5.2. Market Segmentation & Growth Outlook
5.2.1. By Type
5.2.1.1. Beer- Market Insights and Forecast 2022-2032, USD Million
5.2.1.2. Cider/Perry- Market Insights and Forecast 2022-2032, USD Million
5.2.1.3. RTDs- Market Insights and Forecast 2022-2032, USD Million
5.2.1.4. Spirits- Market Insights and Forecast 2022-2032, USD Million
5.2.1.5. Wine- Market Insights and Forecast 2022-2032, USD Million
5.2.2. By Alcohol Content
5.2.2.1. High- Market Insights and Forecast 2022-2032, USD Million
5.2.2.2. Medium- Market Insights and Forecast 2022-2032, USD Million
5.2.2.3. Low- Market Insights and Forecast 2022-2032, USD Million
5.2.3. By Flavor
5.2.3.1. Unflavored- Market Insights and Forecast 2022-2032, USD Million
5.2.3.2. Flavored- Market Insights and Forecast 2022-2032, USD Million
5.2.4. By Packaging Type
5.2.4.1. Glass Bottles- Market Insights and Forecast 2022-2032, USD Million
5.2.4.2. Tins- Market Insights and Forecast 2022-2032, USD Million
5.2.4.3. Plastic Bottles- Market Insights and Forecast 2022-2032, USD Million
5.2.4.4. Others- Market Insights and Forecast 2022-2032, USD Million
5.2.5. By Sales Channel
5.2.5.1. On-Trade- Market Insights and Forecast 2022-2032, USD Million
5.2.5.2. Off-Trade- Market Insights and Forecast 2022-2032, USD Million
5.2.5.2.1. Retail Offline- Market Insights and Forecast 2022-2032, USD Million
5.2.5.2.2. Retail Online- Market Insights and Forecast 2022-2032, USD Million
5.2.6. By Competitors
5.2.6.1. Competition Characteristics
5.2.6.2. Market Share & Analysis
6. Bolivia Beer Market Statistics, 2022-2032F
6.1. Market Size & Growth Outlook
6.1.1. By Revenues in US$ Million
6.1.2. By Quantity Sold in Million Litres
6.2. Market Segmentation & Growth Outlook
6.2.1. By Alcohol Content- Market Insights and Forecast 2022-2032, USD Million
6.2.2. By Flavor- Market Insights and Forecast 2022-2032, USD Million
6.2.3. By Packaging Type- Market Insights and Forecast 2022-2032, USD Million
6.2.4. By Sales Channel- Market Insights and Forecast 2022-2032, USD Million
7. Bolivia Cider/Perry Market Statistics, 2022-2032F
7.1. Market Size & Growth Outlook
7.1.1. By Revenues in US$ Million
7.1.2. By Quantity Sold in Million Litres
7.2. Market Segmentation & Growth Outlook
7.2.1. By Alcohol Content- Market Insights and Forecast 2022-2032, USD Million
7.2.2. By Flavor- Market Insights and Forecast 2022-2032, USD Million
7.2.3. By Packaging Type- Market Insights and Forecast 2022-2032, USD Million
7.2.4. By Sales Channel- Market Insights and Forecast 2022-2032, USD Million
8. Bolivia Ready-to-Drink Market Statistics, 2022-2032F
8.1. Market Size & Growth Outlook
8.1.1. By Revenues in US$ Million
8.1.2. By Quantity Sold in Million Litres
8.2. Market Segmentation & Growth Outlook
8.2.1. By Alcohol Content- Market Insights and Forecast 2022-2032, USD Million
8.2.2. By Flavor- Market Insights and Forecast 2022-2032, USD Million
8.2.3. By Packaging Type- Market Insights and Forecast 2022-2032, USD Million
8.2.4. By Sales Channel- Market Insights and Forecast 2022-2032, USD Million
9. Bolivia Spirits Market Statistics, 2022-2032F
9.1. Market Size & Growth Outlook
9.1.1. By Revenues in US$ Million
9.1.2. By Quantity Sold in Million Litres
9.2. Market Segmentation & Growth Outlook
9.2.1. By Alcohol Content- Market Insights and Forecast 2022-2032, USD Million
9.2.2. By Flavor- Market Insights and Forecast 2022-2032, USD Million
9.2.3. By Packaging Type- Market Insights and Forecast 2022-2032, USD Million
9.2.4. By Sales Channel- Market Insights and Forecast 2022-2032, USD Million
10. Bolivia Wine Market Statistics, 2022-2032F
10.1.Market Size & Growth Outlook
10.1.1. By Revenues in US$ Million
10.1.2. By Quantity Sold in Million Litres
10.2.Market Segmentation & Growth Outlook
10.2.1. By Alcohol Content- Market Insights and Forecast 2022-2032, USD Million
10.2.2. By Flavor- Market Insights and Forecast 2022-2032, USD Million
10.2.3. By Packaging Type- Market Insights and Forecast 2022-2032, USD Million
10.2.4. By Sales Channel- Market Insights and Forecast 2022-2032, USD Million
11. Competitive Outlook
11.1.Company Profiles
11.1.1. Anheuser-Busch InBev NV
11.1.1.1. Business Description
11.1.1.2. Product Portfolio
11.1.1.3. Collaborations & Alliances
11.1.1.4. Recent Developments
11.1.1.5. Financial Details
11.1.1.6. Others
11.1.2. Casa Di Conti Ltda
11.1.2.1. Business Description
11.1.2.2. Product Portfolio
11.1.2.3. Collaborations & Alliances
11.1.2.4. Recent Developments
11.1.2.5. Financial Details
11.1.2.6. Others
11.1.3. Cía Cervecerías Unidas SA
11.1.3.1. Business Description
11.1.3.2. Product Portfolio
11.1.3.3. Collaborations & Alliances
11.1.3.4. Recent Developments
11.1.3.5. Financial Details
11.1.3.6. Others
11.1.4. Cervecería Nacional Potosí Ltda
11.1.4.1. Business Description
11.1.4.2. Product Portfolio
11.1.4.3. Collaborations & Alliances
11.1.4.4. Recent Developments
11.1.4.5. Financial Details
11.1.4.6. Others
11.1.5. Global Marketing & Sales Inc
11.1.5.1. Business Description
11.1.5.2. Product Portfolio
11.1.5.3. Collaborations & Alliances
11.1.5.4. Recent Developments
11.1.5.5. Financial Details
11.1.5.6. Others
11.1.6. Heineken NV
11.1.6.1. Business Description
11.1.6.2. Product Portfolio
11.1.6.3. Collaborations & Alliances
11.1.6.4. Recent Developments
11.1.6.5. Financial Details
11.1.6.6. Others
11.1.7. Sociedad Industrial del Sur
11.1.7.1. Business Description
11.1.7.2. Product Portfolio
11.1.7.3. Collaborations & Alliances
11.1.7.4. Recent Developments
11.1.7.5. Financial Details
11.1.7.6. Others
11.1.8. Sociedad Agroindustrial del Valle SRL
11.1.8.1. Business Description
11.1.8.2. Product Portfolio
11.1.8.3. Collaborations & Alliances
11.1.8.4. Recent Developments
11.1.8.5. Financial Details
11.1.8.6. Others
11.1.9. INAB - Industria Nacional de Bebidas Ltda
11.1.9.1. Business Description
11.1.9.2. Product Portfolio
11.1.9.3. Collaborations & Alliances
11.1.9.4. Recent Developments
11.1.9.5. Financial Details
11.1.9.6. Others
11.1.10. Phusion Projects LLC
11.1.10.1. Business Description
11.1.10.2. Product Portfolio
11.1.10.3. Collaborations & Alliances
11.1.10.4. Recent Developments
11.1.10.5. Financial Details
11.1.10.6. Others
12. Disclaimer
| Segment | Sub-Segment |
|---|---|
| By Type |
|
| By Alcohol Content |
|
| By Flavor |
|
| By Packaging Type |
|
| By Sales Channel |
|
Research Methodology
This study followed a structured approach comprising four key phases to assess the size and scope of the electro-oxidation market. The process began with thorough secondary research to collect data on the target market, related markets, and broader industry context. These findings, along with preliminary assumptions and estimates, were then validated through extensive primary research involving industry experts from across the value chain. To calculate the overall market size, both top-down and bottom-up methodologies were employed. Finally, market segmentation and data triangulation techniques were applied to refine and validate segment-level estimations.
Secondary Research
The secondary research phase involved gathering data from a wide range of credible and published sources. This step helped in identifying industry trends, defining market segmentation, and understanding the market landscape and value chain.
Sources consulted during this phase included:
- Company annual reports, investor presentations, and press releases
- Industry white papers and certified publications
- Trade directories and market-recognized databases
- Articles from authoritative authors and reputable journals
- Gold and silver standard websites
Secondary research was critical in mapping out the industry's value chain and monetary flow, identifying key market segments, understanding regional variations, and tracking significant industry developments.
Other key sources:
- Financial disclosures
- Industry associations and trade bodies
- News outlets and business magazines
- Academic journals and research studies
- Paid industry databases
Primary Research
To validate secondary data and gain deeper market insights, primary research was conducted with key stakeholders across both the supply and demand sides of the market.
On the demand side, participants included decision-makers and influencers from end-user industries—such as CIOs, CTOs, and CSOs—who provided first-hand perspectives on market needs, product usage, and future expectations.
On the supply side, interviews were conducted with manufacturers, industry associations, and institutional participants to gather insights into current offerings, product pipelines, and market challenges.
Primary interviews provided critical inputs such as:
- Market size and revenue data
- Product and service breakdowns
- Market forecasts
- Regional and application-specific trends
Stakeholders consulted included:
- Leading OEM and solution providers
- Channel and distribution partners
- End users across various applications
- Independent consultants and industry specialists
Market Size Estimation and Data Triangulation
- Identifying Key Market Participants (Secondary Research)
- Goal: To identify the major players or companies in the target market. This typically involves using publicly available data sources such as industry reports, market research publications, and financial statements of companies.
- Tools: Reports from firms like Gartner, Forrester, Euromonitor, Statista, IBISWorld, and others. Public financial statements, news articles, and press releases from top market players.
- Extracting Earnings of Key Market Participants
- Goal: To estimate the earnings generated from the product or service being analyzed. This step helps in understanding the revenue potential of each market player in a specific geography.
- Methods: Earnings data can be gathered from:
- Publicly available financial reports (for listed companies).
- Interviews and primary data sources from professionals, such as Directors, VPs, SVPs, etc. This is especially useful for understanding more nuanced, internal data that isn't publicly disclosed.
- Annual reports and investor presentations of key players.
- Data Collation and Development of a Relevant Data Model
- Goal: To collate inputs from both primary and secondary sources into a structured, data-driven model for market estimation. This model will incorporate key market KPIs and any independent variables relevant to the market.
- Key KPIs: These could include:
- Market size, growth rate, and demand drivers.
- Industry-specific metrics like market share, average revenue per customer (ARPC), or average deal size.
- External variables, such as economic growth rates, inflation rates, or commodity prices, that could affect the market.
- Data Modeling: Based on this data, the market forecasts are developed for the next 5 years. A combination of trend analysis, scenario modeling, and statistical regression might be used to generate projections.
- Scenario Analysis
- Goal: To test different assumptions and validate how sensitive the market is to changes in key variables (e.g., market demand, regulatory changes, technological disruptions).
- Types of Scenarios:
- Base Case: Based on current assumptions and historical data.
- Best-Case Scenario: Assuming favorable market conditions, regulatory environments, and technological advancements.
- Worst-Case Scenario: Accounting for adverse factors, such as economic downturns, stricter regulations, or unexpected disruptions.


