Belgium Beer Market Report: Trends, Growth and Forecast (2026-2032)
By Product Type (Dark Beer (Ale, Sorghum Beer, Weissbier/Weizen/Wheat Beer), Lager (Flavoured/Mixed Lager, Standard Lager (Premium Lager (Domestic Premium Lager, Imported Premium Lager), Mid-Priced Lager (Domestic Mid-Priced Lager, Imported Mid-Priced Lager), Economy Lager (Domestic Economy Lager, Imported Economy Lager))), Non/Low Alcohol Beer (Low Alcohol Beer, Non Alcoholic Beer), Stout, Others (Porter, Malt etc.)), By Production (Macro Brewery, Micro Brewery, Craft Brewery), By Packaging Type (Bottles, Cans, Others), By Sales Channel (On-Trade, Off-Trade) ... Read more
|
Major Players
|
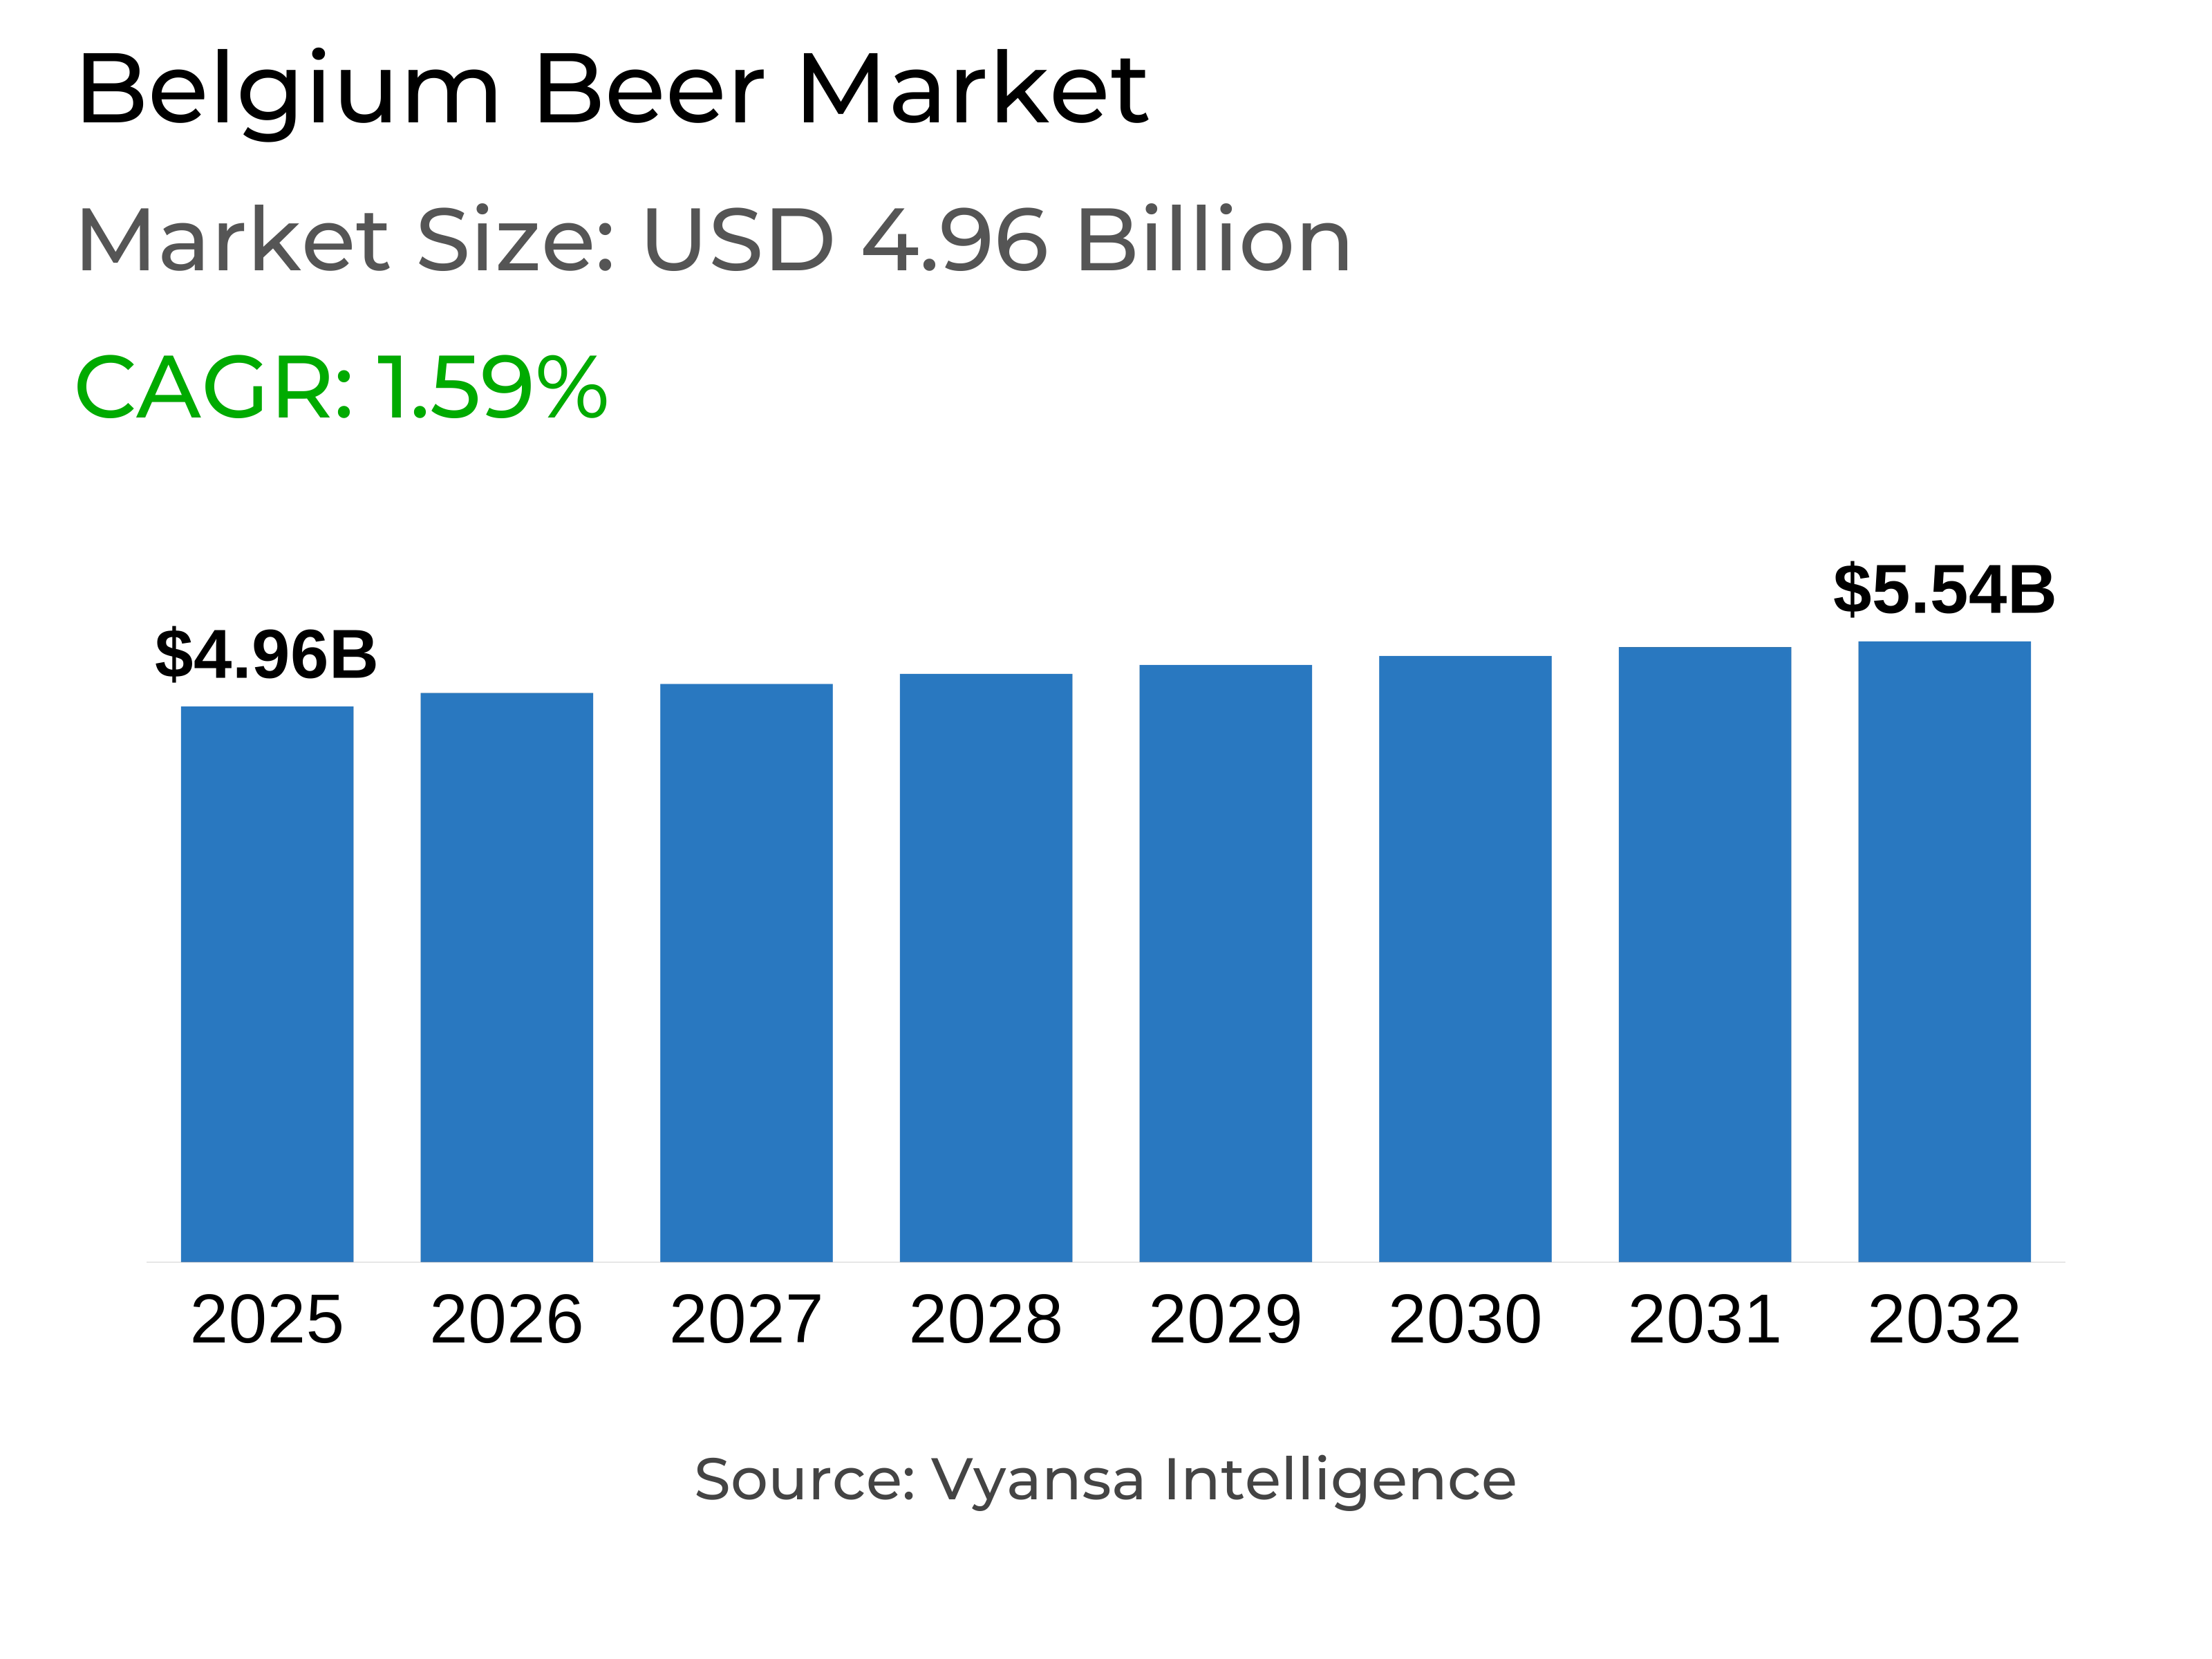
Belgium Beer Market Statistics and Insights, 2026
- Market Size Statistics
- Beer in Belgium is estimated at $ 4.96 Billion.
- The market size is expected to grow to $ 5.54 Billion by 2032.
- Market to register a CAGR of around 1.59% during 2026-32.
- Product Type Shares
- Lager grabbed market share of 45%.
- Competition
- More than 20 companies are actively engaged in producing Beer in Belgium.
- Top 5 companies acquired around 75% of the market share.
- Abdij der Trappisten van Westmalle, Etn Franz Colruyt NV, Abbaye Notre Dame de Scourmont, Anheuser-Busch InBev SA NV, Alken Maes NV SA, Brouwerijen etc., are few of the top companies.
- Sales Channel
- On-trade grabbed 70% of the market.
Belgium Beer Market Outlook
The Belgium beer market is estimated to be worth $4.96 billion in 2025 and to reach $5.54 billion by 2032, with a compound annual growth rate of approximately 1.59% during the period 2026–2032. Even though traditional beer consumption is declining overall, the Belgium beer market is shifting with changing consumption habits, such as moderation or health-motivated choices, and alternatives like ready to drink (RTD) cocktails and aperitifs. While off-trade remains critical to price-sensitive end users, on-trade continues to have an important place in the Belgium beer experience providing experiential value through bars, taprooms, and brewery tours.
Lager continues to be the biggest product category, holding approximately 45% of the market, although it is experiencing challenges from shifting preference. End users are increasingly looking at ale, flavoured, fruit, and alcohol-free beers. Flavoured and blended beers like Desperados Tropical and Mort Subite Juicy are performing well, alongside additional beers with reduced alcohol strength gaining popularity. Specialty and Trappist sales continue to have niche appeal, while non-alcoholic beer has become the most vibrant subsector, helped out by health-related trends and launches by both larger and smaller breweries.
Major players like Anheuser-Busch InBev, Alken-Maes, and upstart players like Force Majeure and Belgium Balance are defining the market. Although historic brands continue to invest in flagship beer and innovations like Piedboeuf Extra, non-alcoholic and flavour variants are promoting growth. Local breweries are also responding by enhancing on-site occasions, developing taprooms, and launching high-quality, alcohol-free versions that resonate with younger and health-focused end users.
During the forecast period, innovation will revolve around non-beer alcoholic and flavour variety. Breweries will be expected to increase options in the range of fruit beers, IPAs, and specialty brews, and explore new flavours and limited edition offerings. In the face of structural challenges such as increasing costs and lower bar visits, the Belgium beer sector is expected to continue modest growth thanks to changing end users' preferences, sustained interest in premium beers and alcoholic-free beers, and equilibrium between off-trade convenience and on-trade experience.

Belgium Beer Market Growth Driver
Increasing Health-Conscious Consumption
Health-oriented end users habits have infiltrated the mindset of end users in Belgium. More end users are choosing lower and no-alcohol beers they aspire to remain socially connected to drinking while also living a balanced lifestyle. Therefore, breweries will look to develop products in their portfolio that continue to satisfy these health-oriented lifestyle needs, while also providing the quality and taste that is associated with beer.
As the movement to moderation and healthier habits increases end users awareness, more breweries will look to innovate in the alcohol-free and lower ABV segments of beer. As end users keep health as a priority, brands with non, lower-alcohol, or functional, beer options will find themselves in favor with end users, allowing brands to remain relevant in the minds of end userss and build brand loyalty in a competitive marketplace.
Belgium Beer Market Trend
Innovation in Non-Alcoholic and Flavoured Beers
Belgium breweries are increasingly concentrating on innovation in flavoured and non-alcoholic segments of beer. Alcohol-free beers now go beyond lagers to cover fruit, red, IPA, and speciality beers, catering to health-oriented end users and also end users looking for unique taste experiences.
Flavored beers, such as speciality and tropical ones, appeal to young end users and adventurous final end userss. Limited releases and collaborations drive engagement and enhance brand distinction. Ongoing innovation in flavour and diversity enables breweries to react to changing tastes, keep end users interest, and counter decreasing consumption of traditional beers.
Unlock Market Intelligence
Explore the market potential with our data-driven report
Belgium Beer Market Opportunity
Growth Potential in Premium and Specialty Segments
Premium and specialty beer segments offer great opportunities for Belgium breweries. End users are more and more looking for top-quality, artisanal beers with distinctive flavors, craftsmanship, and memorable experiences and thus are willing to pay a premium.
Brewers can tap into these segments in order to counter losses of mainstream lagers. Flavoured, limited-edition, and craft-style beers enable brands to target value-oriented and experience-based end users. Spending on premium products, crafted experiences, and differentiated branding is likely to fuel growth, enhance brand image, and increase market share over the forecast period.
Unlock Market Intelligence
Explore the market potential with our data-driven report
Belgium Beer Market Segmentation Analysis

By Product Type
- Dark Beer
- Lager
- Non/Low Alcohol Beer
- Stout
The segment with highest market share under Product Type in the Belgium Beer Market is Lager, with a share of about 45% of the market. Lager remains the most consumed and entry-level type of beer, and thus the preferred one, enjoyed by a large segment of end users. Against the challenges posed by changing preferences towards non-alcoholic, flavored, and speciality beers, lager remains popular due to its familiarity, reliability, and availability across retail and on-trade channels.
Volume and value within this segment are underpinned by innovations including lower-alcohol, flavour variants, and revamped packaging such as Piedboeuf Extra cans. Top brands like Jupiler, Maes, and Stella Artois remain ahead, while breweries invest to enhance on-trade experiences with cistern systems and better quality. The segment is boosted by authentic beer end userss and end userss who look for affordable, easy-drinking beers, which maintains its top market position.
By Sales Channel
- On-Trade
- Off-Trade
The segment with highest market share under Sales Channel in the Belgium Beer Market is On-Trade, with a market share of approximately 70%. On-trade bars, cafés, and restaurants are included, which are still a core of Belgium beer culture. end users still appreciate the social experience of beer consumption, even if they reduce visit frequencies because of increasing costs, tighter drink-driving laws, and changing lifestyle.
Breweries are responding by opening up taprooms, running brewery tours, and establishing specialist tasting experiences. Specialist retailers like Prik&Tik also facilitate the on-trade segment by supplying premium and speciality beers of interest to enthusiasts. In total, on-trade is an important channel for brand contact, end users loyalty, and advocating innovative beer varieties, including non-alcoholic and flavoured ones.
Top Companies in Belgium Beer Market
The top companies operating in the market include Abdij der Trappisten van Westmalle, Etn Franz Colruyt NV, Abbaye Notre Dame de Scourmont, Anheuser-Busch InBev SA NV, Alken Maes NV SA, Brouwerijen, Duvel Moortgat NV, Palm NV, Brouwerij, Brouwerij Haacht NV SA, Delhaize 'Le Lion' SA, Carlsberg Importers NV SA, etc., are the top players operating in the Belgium Beer Market.
Frequently Asked Questions
Related Report
1. Market Segmentation
1.1. Research Scope
1.2. Research Methodology
1.3. Definitions and Assumptions
2. Executive Summary
3. Belgium Beer Market Policies, Regulations, and Standards
4. Belgium Beer Market Dynamics
4.1. Growth Factors
4.2. Challenges
4.3. Trends
4.4. Opportunities
5. Belgium Beer Market Statistics, 2022-2032F
5.1. Market Size & Growth Outlook
5.1.1. By Revenues in US$ Million
5.1.2. By Quantity Sold in Million Litres
5.2. Market Segmentation & Growth Outlook
5.2.1. By Product Type
5.2.1.1. Dark Beer- Market Insights and Forecast 2022-2032, USD Million
5.2.1.1.1. Ale- Market Insights and Forecast 2022-2032, USD Million
5.2.1.1.2. Sorghum Beer- Market Insights and Forecast 2022-2032, USD Million
5.2.1.1.3. Weissbier/Weizen/Wheat Beer- Market Insights and Forecast 2022-2032, USD Million
5.2.1.2. Lager- Market Insights and Forecast 2022-2032, USD Million
5.2.1.2.1. Flavoured/Mixed Lager- Market Insights and Forecast 2022-2032, USD Million
5.2.1.2.2. Standard Lager- Market Insights and Forecast 2022-2032, USD Million
5.2.1.2.2.1. Premium Lager- Market Insights and Forecast 2022-2032, USD Million
5.2.1.2.2.1.1. Domestic Premium Lager- Market Insights and Forecast 2022-2032, USD Million
5.2.1.2.2.1.2. Imported Premium Lager- Market Insights and Forecast 2022-2032, USD Million
5.2.1.2.2.2. Mid-Priced Lager- Market Insights and Forecast 2022-2032, USD Million
5.2.1.2.2.2.1. Domestic Mid-Priced Lager- Market Insights and Forecast 2022-2032, USD Million
5.2.1.2.2.2.2. Imported Mid-Priced Lager- Market Insights and Forecast 2022-2032, USD Million
5.2.1.2.2.3. Economy Lager- Market Insights and Forecast 2022-2032, USD Million
5.2.1.2.2.3.1. Domestic Economy Lager- Market Insights and Forecast 2022-2032, USD Million
5.2.1.2.2.3.2. Imported Economy Lager- Market Insights and Forecast 2022-2032, USD Million
5.2.1.3. Non/Low Alcohol Beer- Market Insights and Forecast 2022-2032, USD Million
5.2.1.3.1. Low Alcohol Beer- Market Insights and Forecast 2022-2032, USD Million
5.2.1.3.2. Non Alcoholic Beer- Market Insights and Forecast 2022-2032, USD Million
5.2.1.4. Stout- Market Insights and Forecast 2022-2032, USD Million
5.2.1.5. Others (Porter, Malt etc.) - Market Insights and Forecast 2022-2032, USD Million
5.2.2. By Production
5.2.2.1. Macro Brewery- Market Insights and Forecast 2022-2032, USD Million
5.2.2.2. Micro Brewery- Market Insights and Forecast 2022-2032, USD Million
5.2.2.3. Craft Brewery- Market Insights and Forecast 2022-2032, USD Million
5.2.3. By Packaging Type
5.2.3.1. Bottles- Market Insights and Forecast 2022-2032, USD Million
5.2.3.2. Cans- Market Insights and Forecast 2022-2032, USD Million
5.2.3.3. Others- Market Insights and Forecast 2022-2032, USD Million
5.2.4. By Sales Channel
5.2.4.1. On-Trade- Market Insights and Forecast 2022-2032, USD Million
5.2.4.2. Off-Trade- Market Insights and Forecast 2022-2032, USD Million
5.2.5. By Competitors
5.2.5.1. Competition Characteristics
5.2.5.2. Market Share & Analysis
6. Belgium Dark Beer Market Statistics, 2022-2032F
6.1. Market Size & Growth Outlook
6.1.1. By Revenues in US$ Million
6.1.2. By Quantity Sold in Million Litres
6.2. Market Segmentation & Growth Outlook
6.2.1. By Product Type- Market Insights and Forecast 2022-2032, USD Million
6.2.2. By Production- Market Insights and Forecast 2022-2032, USD Million
6.2.3. By Packaging Type- Market Insights and Forecast 2022-2032, USD Million
6.2.4. By Sales Channel- Market Insights and Forecast 2022-2032, USD Million
7. Belgium Lager Beer Market Statistics, 2022-2032F
7.1. Market Size & Growth Outlook
7.1.1. By Revenues in US$ Million
7.1.2. By Quantity Sold in Million Litres
7.2. Market Segmentation & Growth Outlook
7.2.1. By Product Type- Market Insights and Forecast 2022-2032, USD Million
7.2.2. By Production- Market Insights and Forecast 2022-2032, USD Million
7.2.3. By Packaging Type- Market Insights and Forecast 2022-2032, USD Million
7.2.4. By Sales Channel- Market Insights and Forecast 2022-2032, USD Million
8. Belgium Non/Low Alcohol Beer Market Statistics, 2022-2032F
8.1. Market Size & Growth Outlook
8.1.1. By Revenues in US$ Million
8.1.2. By Quantity Sold in Million Litres
8.2. Market Segmentation & Growth Outlook
8.2.1. By Production- Market Insights and Forecast 2022-2032, USD Million
8.2.2. By Packaging Type- Market Insights and Forecast 2022-2032, USD Million
8.2.3. By Sales Channel- Market Insights and Forecast 2022-2032, USD Million
9. Belgium Stout Beer Market Statistics, 2022-2032F
9.1. Market Size & Growth Outlook
9.1.1. By Revenues in US$ Million
9.1.2. By Quantity Sold in Million Litres
9.2. Market Segmentation & Growth Outlook
9.2.1. By Production- Market Insights and Forecast 2022-2032, USD Million
9.2.2. By Packaging Type- Market Insights and Forecast 2022-2032, USD Million
9.2.3. By Sales Channel- Market Insights and Forecast 2022-2032, USD Million
10. Competitive Outlook
10.1.Company Profiles
10.1.1. Anheuser-Busch InBev SA NV
10.1.1.1. Business Description
10.1.1.2. Product Portfolio
10.1.1.3. Collaborations & Alliances
10.1.1.4. Recent Developments
10.1.1.5. Financial Details
10.1.1.6. Others
10.1.2. Alken Maes NV SA, Brouwerijen
10.1.2.1. Business Description
10.1.2.2. Product Portfolio
10.1.2.3. Collaborations & Alliances
10.1.2.4. Recent Developments
10.1.2.5. Financial Details
10.1.2.6. Others
10.1.3. Duvel Moortgat NV
10.1.3.1. Business Description
10.1.3.2. Product Portfolio
10.1.3.3. Collaborations & Alliances
10.1.3.4. Recent Developments
10.1.3.5. Financial Details
10.1.3.6. Others
10.1.4. Palm NV, Brouwerij
10.1.4.1. Business Description
10.1.4.2. Product Portfolio
10.1.4.3. Collaborations & Alliances
10.1.4.4. Recent Developments
10.1.4.5. Financial Details
10.1.4.6. Others
10.1.5. Brouwerij Haacht NV SA
10.1.5.1. Business Description
10.1.5.2. Product Portfolio
10.1.5.3. Collaborations & Alliances
10.1.5.4. Recent Developments
10.1.5.5. Financial Details
10.1.5.6. Others
10.1.6. Abdij der Trappisten van Westmalle
10.1.6.1. Business Description
10.1.6.2. Product Portfolio
10.1.6.3. Collaborations & Alliances
10.1.6.4. Recent Developments
10.1.6.5. Financial Details
10.1.6.6. Others
10.1.7. Etn Franz Colruyt NV
10.1.7.1. Business Description
10.1.7.2. Product Portfolio
10.1.7.3. Collaborations & Alliances
10.1.7.4. Recent Developments
10.1.7.5. Financial Details
10.1.7.6. Others
10.1.8. Abbaye Notre Dame de Scourmont
10.1.8.1. Business Description
10.1.8.2. Product Portfolio
10.1.8.3. Collaborations & Alliances
10.1.8.4. Recent Developments
10.1.8.5. Financial Details
10.1.8.6. Others
10.1.9. Delhaize 'Le Lion' SA
10.1.9.1. Business Description
10.1.9.2. Product Portfolio
10.1.9.3. Collaborations & Alliances
10.1.9.4. Recent Developments
10.1.9.5. Financial Details
10.1.9.6. Others
10.1.10. Carlsberg Importers NV SA
10.1.10.1. Business Description
10.1.10.2. Product Portfolio
10.1.10.3. Collaborations & Alliances
10.1.10.4. Recent Developments
10.1.10.5. Financial Details
10.1.10.6. Others
11. Disclaimer
| Segment | Sub-Segment |
|---|---|
| By Product Type |
|
| By Production |
|
| By Packaging Type |
|
| By Sales Channel |
|
Research Methodology
This study followed a structured approach comprising four key phases to assess the size and scope of the electro-oxidation market. The process began with thorough secondary research to collect data on the target market, related markets, and broader industry context. These findings, along with preliminary assumptions and estimates, were then validated through extensive primary research involving industry experts from across the value chain. To calculate the overall market size, both top-down and bottom-up methodologies were employed. Finally, market segmentation and data triangulation techniques were applied to refine and validate segment-level estimations.
Secondary Research
The secondary research phase involved gathering data from a wide range of credible and published sources. This step helped in identifying industry trends, defining market segmentation, and understanding the market landscape and value chain.
Sources consulted during this phase included:
- Company annual reports, investor presentations, and press releases
- Industry white papers and certified publications
- Trade directories and market-recognized databases
- Articles from authoritative authors and reputable journals
- Gold and silver standard websites
Secondary research was critical in mapping out the industry's value chain and monetary flow, identifying key market segments, understanding regional variations, and tracking significant industry developments.
Other key sources:
- Financial disclosures
- Industry associations and trade bodies
- News outlets and business magazines
- Academic journals and research studies
- Paid industry databases
Primary Research
To validate secondary data and gain deeper market insights, primary research was conducted with key stakeholders across both the supply and demand sides of the market.
On the demand side, participants included decision-makers and influencers from end-user industries—such as CIOs, CTOs, and CSOs—who provided first-hand perspectives on market needs, product usage, and future expectations.
On the supply side, interviews were conducted with manufacturers, industry associations, and institutional participants to gather insights into current offerings, product pipelines, and market challenges.
Primary interviews provided critical inputs such as:
- Market size and revenue data
- Product and service breakdowns
- Market forecasts
- Regional and application-specific trends
Stakeholders consulted included:
- Leading OEM and solution providers
- Channel and distribution partners
- End users across various applications
- Independent consultants and industry specialists
Market Size Estimation and Data Triangulation
- Identifying Key Market Participants (Secondary Research)
- Goal: To identify the major players or companies in the target market. This typically involves using publicly available data sources such as industry reports, market research publications, and financial statements of companies.
- Tools: Reports from firms like Gartner, Forrester, Euromonitor, Statista, IBISWorld, and others. Public financial statements, news articles, and press releases from top market players.
- Extracting Earnings of Key Market Participants
- Goal: To estimate the earnings generated from the product or service being analyzed. This step helps in understanding the revenue potential of each market player in a specific geography.
- Methods: Earnings data can be gathered from:
- Publicly available financial reports (for listed companies).
- Interviews and primary data sources from professionals, such as Directors, VPs, SVPs, etc. This is especially useful for understanding more nuanced, internal data that isn't publicly disclosed.
- Annual reports and investor presentations of key players.
- Data Collation and Development of a Relevant Data Model
- Goal: To collate inputs from both primary and secondary sources into a structured, data-driven model for market estimation. This model will incorporate key market KPIs and any independent variables relevant to the market.
- Key KPIs: These could include:
- Market size, growth rate, and demand drivers.
- Industry-specific metrics like market share, average revenue per customer (ARPC), or average deal size.
- External variables, such as economic growth rates, inflation rates, or commodity prices, that could affect the market.
- Data Modeling: Based on this data, the market forecasts are developed for the next 5 years. A combination of trend analysis, scenario modeling, and statistical regression might be used to generate projections.
- Scenario Analysis
- Goal: To test different assumptions and validate how sensitive the market is to changes in key variables (e.g., market demand, regulatory changes, technological disruptions).
- Types of Scenarios:
- Base Case: Based on current assumptions and historical data.
- Best-Case Scenario: Assuming favorable market conditions, regulatory environments, and technological advancements.
- Worst-Case Scenario: Accounting for adverse factors, such as economic downturns, stricter regulations, or unexpected disruptions.


