Austria Sports Nutrition Market Report: Trends, Growth and Forecast (2026-2032)
Product Type (Sports Protein Products (Protein/Energy Bars, Sports Protein Powder, Sports Protein RTD), Sports Non-Protein Products), Sales Channel (Retail Offline, Retail Online), Ingredients (Vitamins and Minerals, Proteins and Amino Acids, Carbohydrates, Probiotics, Botanicals/Herbals, Others), Functionality (Energy, Muscle growth, Hydration, Weight Management, Others), End User (Bodybuilders, Athletes, Lifestyle Users) ... Read more
|
Major Players
|
Austria Sports Nutrition Market Statistics and Insights, 2026
- Market Size Statistics
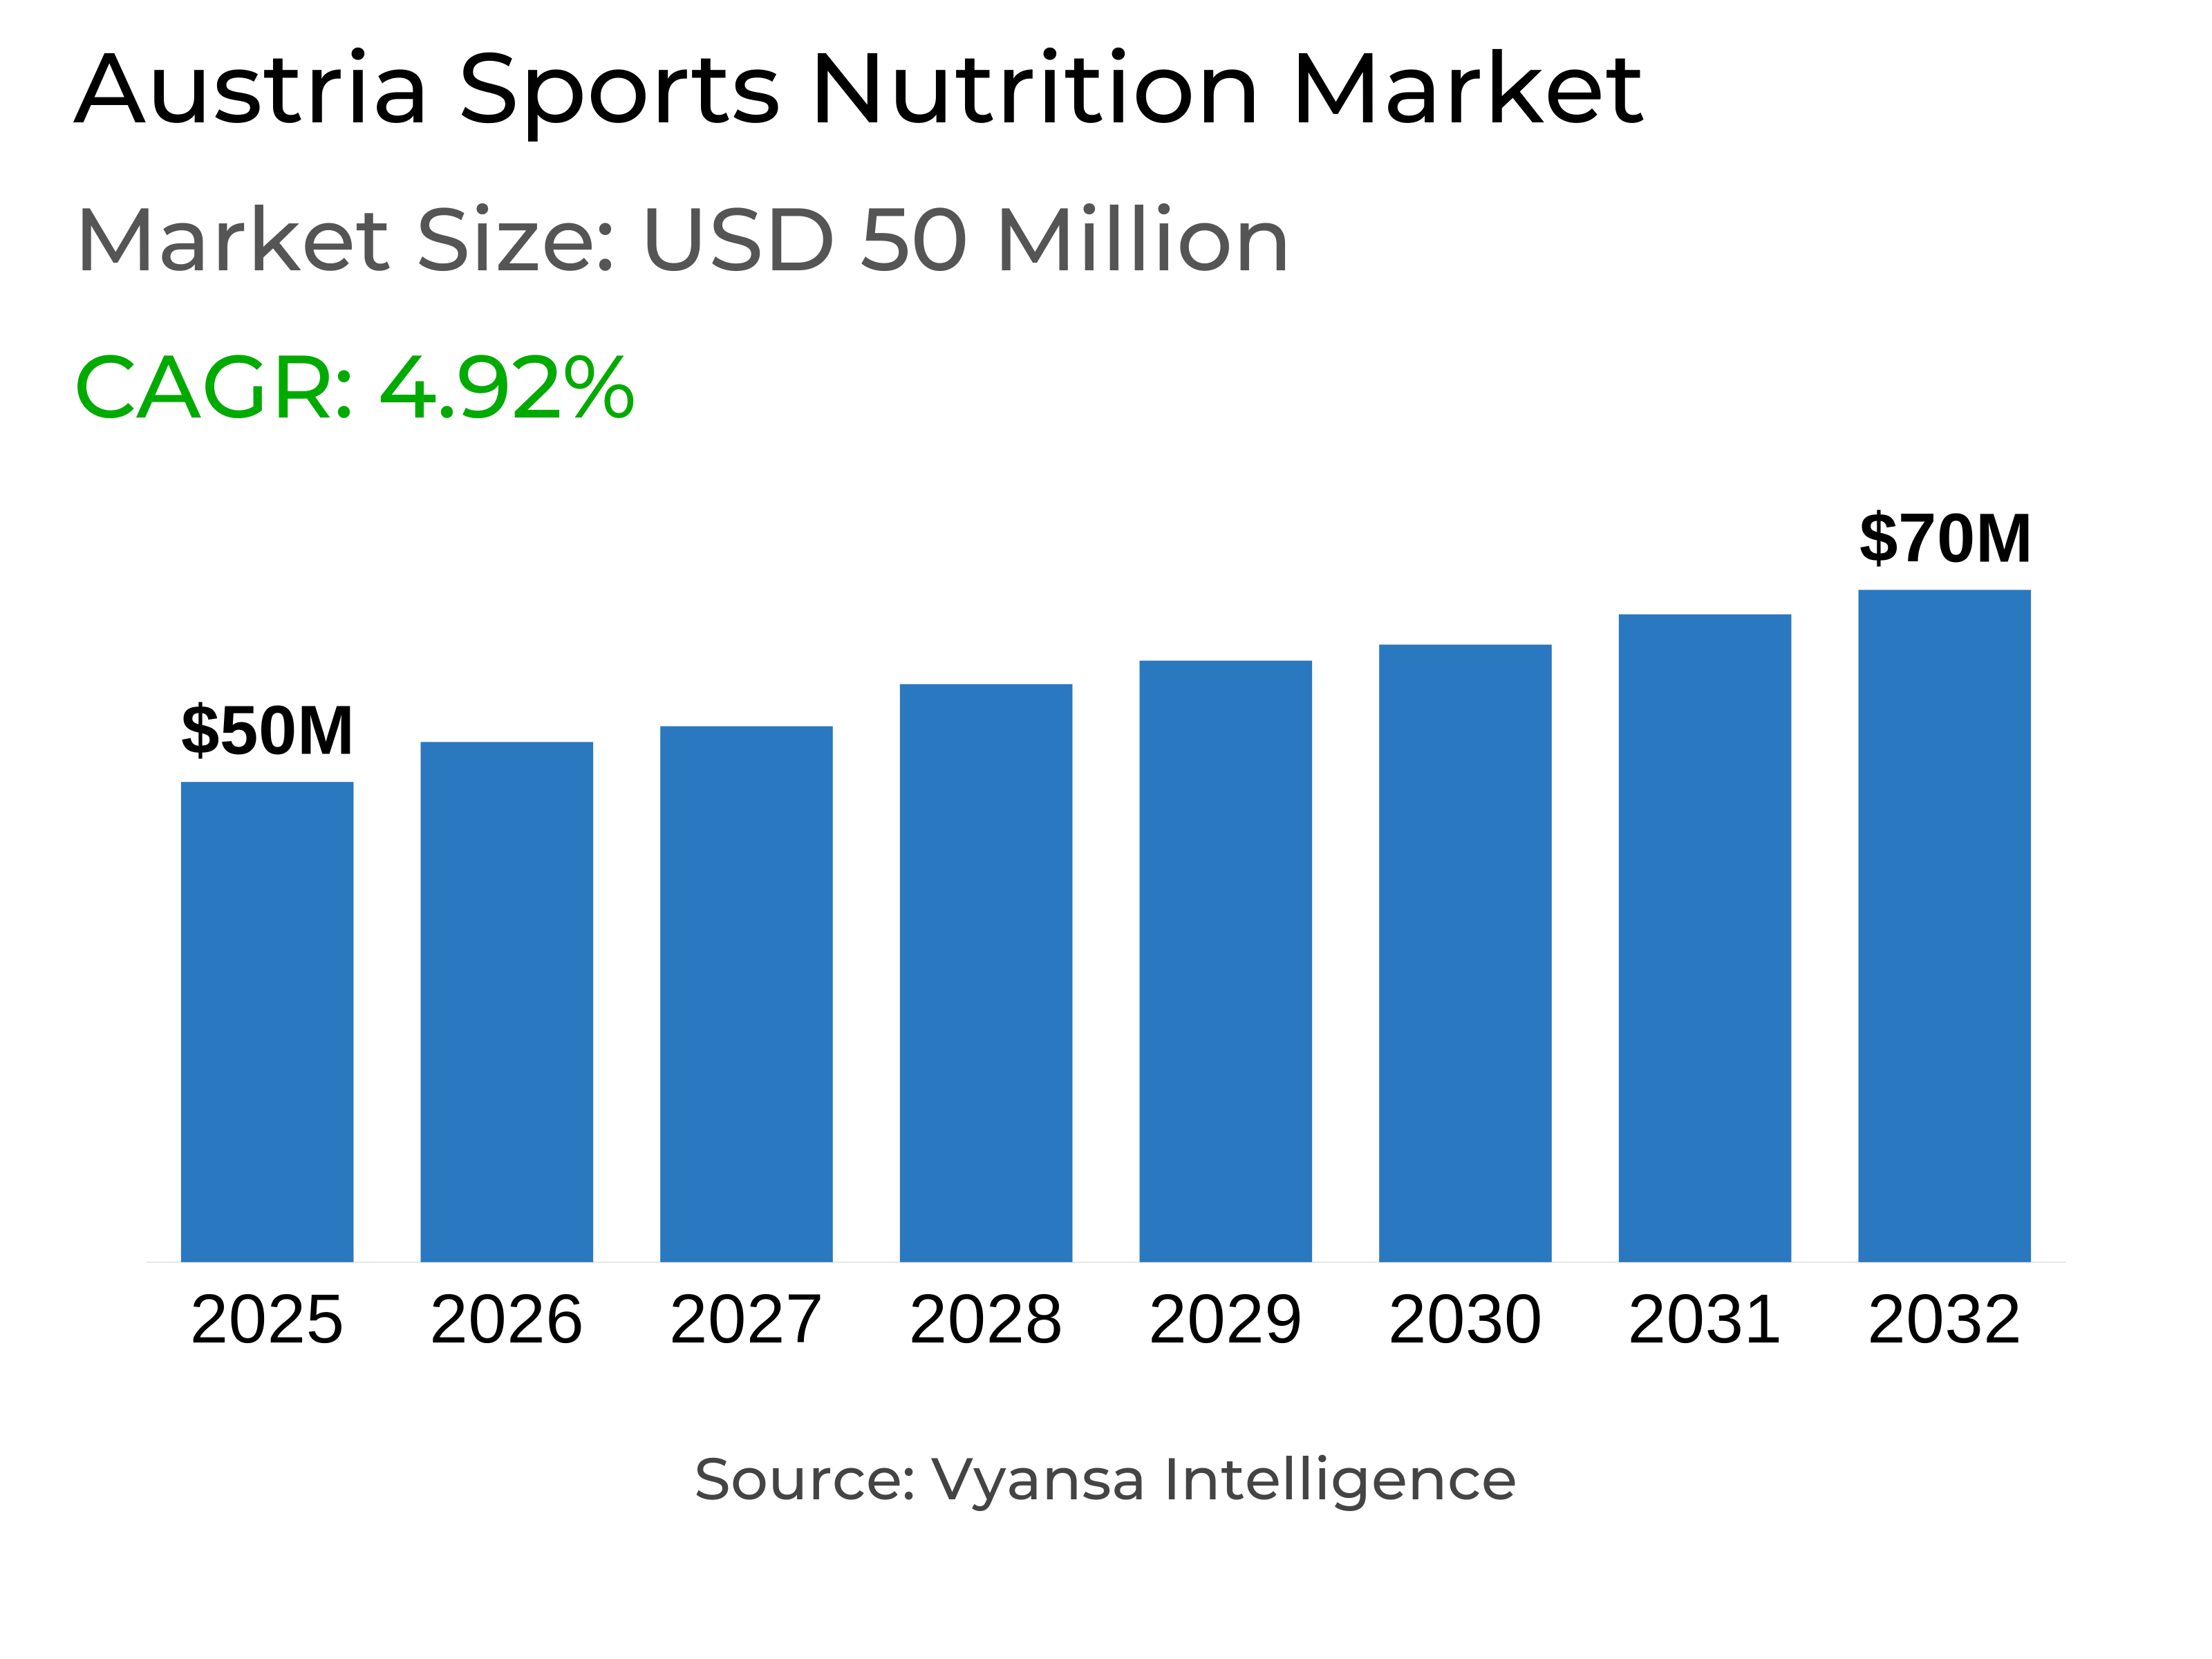
- Sports nutrition in austria is estimated at $ 50 million.
- The market size is expected to grow to $ 70 million by 2032.
- Market to register a cagr of around 4.92% during 2026-32.
- Product Type Shares
- Sports protein products grabbed market share of 85%.
- Competition
- More than 20 companies are actively engaged in producing sports nutrition in austria.
- Top 5 companies acquired around 60% of the market share.
- Fitnesshotline GmbH, Active Nutrition International GmbH, Power Tec Ltd, Almi GmbH, Tripoint GmbH etc., are few of the top companies.
- Sales Channel
- Retail online grabbed 60% of the market.
Austria Sports Nutrition Market Outlook
The sports nutrition market in Austria, is worth around 50 million in 2025, is expected to reach around USD 70 million by 2032 with a growing CAGR of around 4.92% from 2026–32. Increasing awareness of health and interest in fitness among end-users keeps building demand within the market. As more end users are adding sports nutrition to their regimens in order to enhance stamina, recovery, and overall physical functioning. These foods have become a standard component for sustaining energy and reaching fitness objectives.
Sports nutrition protein products lead the market with around 85% share, indicating a strong demand for protein rich products. With ease of use and nutritional benefits, protein powders, bars and ready to drink shakes continues to be the most consumed form of protein products. Enhanced flavors, plant based ingredients, and improved textures have helped these products gain acceptance with end users, guaranteeing their market leadership.
The market shows great resiliance in terms of competition, with the top five players accounting for around 60% of overall sales. Established players continue to grow through innovation, enhanced formulations, and robust brand recognition, whereas new players bring in diversity and price competitiveness. This composition of established and new brands maintains the market dynamic.
Retail online channel leads with around 60% of overall sales in 2025 due to convenience, variety, and accessibility. End users utilize digital platforms for special offers and convenient delivery. With growing fitness and nutrition awareness through digital media, retail online will continue to be the top channel of sales through 2025 and beyond.

Austria Sports Nutrition Market Growth DriverGrowing Focus on Fitness and Strength Supports Market Growth
The end users are focusing on fitness and strength is rapidly increasing, and this is fueling the growth of sports nutrition market. End users want to enhance their endurance, gain muscles, and be active, so they are incorporating protein based foods and beverages into their everyday lives. These items keep them energized, heal faster after exercising, and support in their quest to remain healthy and fit. The increasing desire for visible fitness result and improved physical performance make these product an integral part of everyday lifestyles.
Furthermore, interest in strength training is extending beyond competitors to fitness enthusiasts and average gym users. Numerous end user are currently employing sports nutrition products to achieve body objectives, sustain energy levels, and adopt healthier eating practices. This broader application of nutrition support as a part of everyday fitness activities is sustaining the market and enabling it to expand its reach among more end users of varying ages and activity levels.
Austria Sports Nutrition Market ChallengeStrict Regulations and Safety Concerns Create Market Pressure
Facing pressure from strict European food laws and safety checks, companies must ensure their products meet regulatory standards to avoid delays and compliance issues. Several sports nutrition products need to meet EU regulations on novel ingredients and health claims before they can be marketed. The authorities have been finding several supplements with unapproved or unsafe ingredients, leading to recalls and legal action. These issues raise costs for testing, reformulation, and certification, particularly for small businesses attempting to meet all standards.
Additionally, producers and importers faces complexities, while keeping up with changing EU regulations and labelling requirements, adds extra complexity for producers and importers. Products that fails to meet these compliances are removed from shelves, creating market disruptions and loss of trust among end users. The need for strict compliance with EU and local safety laws has therefore become one of the biggest obstacles to smooth market growth.
Unlock Market Intelligence
Explore the market potential with our data-driven report
Austria Sports Nutrition Market TrendRising Popularity of Sports Protein and Energy Bars
Protein bars and sports nutrition are becoming a everyday choice for end users looking for fast and healthy snacks. End users use them to sustain energy between meals or post exercise, and thus the sports bars become a value added product for busy lifestyles. Although they continue to move in smaller quantities compared to protein powder, their penetration through grocery and health stores continues to expand as more end user make them part of their routine.
Additionally, product development is strengthening this shift. Companies are launching various flavors and formats, from whey to plant based bars, for vegetarians and vegans. These options are empowering sports bars to break out of the athlete segment and enter the day to day fitness conscious end user. The mix of taste, convenience, and acceptance is making protein and energy bars one of the market's most vibrant categories.
Austria Sports Nutrition Market OpportunityRising Focus on Everyday Fitness to Boost Future Growth
With increasing emphasis on fitness and balanced diet among more end users will significantly increase the nutrition consumption. As end user attempt to lead healthier lives, the acceptance of sports nutrition products will rise outside gyms and athletes. Busy lifestyles are encouraging end user to opt for easy to consume nutritional products that can become part of daily routine, with ready to drink beverages, bars, and shakes gaining popularity as quick sources of energy and endurance.
Moreover, with ongoing innovation in taste, functionality, and ingredients, will attract those end users who are searching for natural,plant based protein products. The growing role of fitness apps, home workout programs, and wellness content will support awareness and product adoption. This growing interest in personal health and fitness is likely to augment long term demand and support steady market growth over the time period.
Unlock Market Intelligence
Explore the market potential with our data-driven report
Austria Sports Nutrition Market Segmentation Analysis

By Product Type
- Sports Protein Products
- Sports Non-Protein Products
Sports protein products segment dominates the market, with around 85% of share under the product type segment. Their dominance is an indication of a resounding preference for protein based nutrition by end users looking to enhance strength, stamina, and overall performance. Protein powders, bars, and ready to drink liquid drinks have become permanent additions in active lifestyles, providing quick and convenient nutrition for individuals balancing exercise with busy schedules. The consistent demand for these formats demonstrates how protein nutrition has moved from a specialist option among athletes to mainstream health product.
The strong presence of protein based products also indicates their increasing popularity among health driven end users. Better flavour choices, better texture, and the presence of plant based options have expanded their presence in various age and fitness segments. With the ongoing awareness, protein based products are likely to continue leading the market's continued growth.
By Sales Channel
- Retail Offline
- Retail Online
Retail online segment continues to dominate in the sports nutrition, accounting for around 60% under the sales channel. this strong position is a result of the growing shift of end users in online shoping due to convenience and variety. The widespread availability, price benefits, and exlusive online offers on protein powders, bars, and ready to drink products sustains frequent purchasing . Features like fast delivery, safe payment, and easy return facilities further enhance the shopping experience, making retail online the end users preferred segment.
Moreover, growing awareness for fitness and nutrition content on digital platforms is resulting is supporting steady growth. End users are becoming aware of sports nutrition role in enhancing strength, endurance, and recovery, driving them to seek out new products online. With more accessibility and innovation in products, retail online will continue to dominate, solidifying its position as the leading selling channel in the market.
Top Companies in Austria Sports Nutrition Market
The top companies operating in the market include Fitnesshotline GmbH, Active Nutrition International GmbH, Power Tec Ltd, Almi GmbH, Tripoint GmbH, Peeroton GmbH, APOtrend Vertrieb GmbH, Hut Group Ltd, The, Optimum Nutrition Inc, Well Plus Trade Austria Vertriebs GmbH, etc., are the top players operating in the austria sports nutrition market.
Frequently Asked Questions
Related Report
1. Market Segmentation
1.1. Research Scope
1.2. Research Methodology
1.3. Definitions and Assumptions
2. Executive Summary
3. Austria Sports Nutrition Market Policies, Regulations, and Standards
4. Austria Sports Nutrition Market Dynamics
4.1. Growth Factors
4.2. Challenges
4.3. Trends
4.4. Opportunities
5. Austria Sports Nutrition Market Statistics, 2022-2032F
5.1. Market Size & Growth Outlook
5.1.1.By Revenues in US$ Million
5.2. Market Segmentation & Growth Outlook
5.2.1.By Product Type
5.2.1.1. Sports Protein Products- Market Insights and Forecast 2022-2032, USD Million
5.2.1.1.1. Protein/Energy Bars- Market Insights and Forecast 2022-2032, USD Million
5.2.1.1.2. Sports Protein Powder- Market Insights and Forecast 2022-2032, USD Million
5.2.1.1.3. Sports Protein RTD- Market Insights and Forecast 2022-2032, USD Million
5.2.1.2. Sports Non-Protein Products- Market Insights and Forecast 2022-2032, USD Million
5.2.2.By Sales Channel
5.2.2.1. Retail Offline- Market Insights and Forecast 2022-2032, USD Million
5.2.2.2. Retail Online- Market Insights and Forecast 2022-2032, USD Million
5.2.3.By Ingredients
5.2.3.1. Vitamins and Minerals- Market Insights and Forecast 2022-2032, USD Million
5.2.3.2. Proteins and Amino Acids- Market Insights and Forecast 2022-2032, USD Million
5.2.3.3. Carbohydrates- Market Insights and Forecast 2022-2032, USD Million
5.2.3.4. Probiotics- Market Insights and Forecast 2022-2032, USD Million
5.2.3.5. Botanicals/Herbals- Market Insights and Forecast 2022-2032, USD Million
5.2.3.6. Others- Market Insights and Forecast 2022-2032, USD Million
5.2.4.By Functionality
5.2.4.1. Energy- Market Insights and Forecast 2022-2032, USD Million
5.2.4.2. Muscle growth- Market Insights and Forecast 2022-2032, USD Million
5.2.4.3. Hydration- Market Insights and Forecast 2022-2032, USD Million
5.2.4.4. Weight Management- Market Insights and Forecast 2022-2032, USD Million
5.2.4.5. Others- Market Insights and Forecast 2022-2032, USD Million
5.2.5.By End User
5.2.5.1. Bodybuilders- Market Insights and Forecast 2022-2032, USD Million
5.2.5.2. Athletes- Market Insights and Forecast 2022-2032, USD Million
5.2.5.3. Lifestyle Users- Market Insights and Forecast 2022-2032, USD Million
5.2.6.By Competitors
5.2.6.1. Competition Characteristics
5.2.6.2. Market Share & Analysis
6. Austria Protein Products Sports Nutrition Market Statistics, 2022-2032F
6.1. Market Size & Growth Outlook
6.1.1.By Revenues in US$ Million
6.2. Market Segmentation & Growth Outlook
6.2.1.By Sales Channel- Market Insights and Forecast 2022-2032, USD Million
6.2.2.By Ingredients- Market Insights and Forecast 2022-2032, USD Million
6.2.3.By Functionality- Market Insights and Forecast 2022-2032, USD Million
6.2.4.By End User- Market Insights and Forecast 2022-2032, USD Million
7. Austria Non-Protein Products Sports Nutrition Market Statistics, 2022-2032F
7.1. Market Size & Growth Outlook
7.1.1.By Revenues in US$ Million
7.2. Market Segmentation & Growth Outlook
7.2.1.By Sales Channel- Market Insights and Forecast 2022-2032, USD Million
7.2.2.By Ingredients- Market Insights and Forecast 2022-2032, USD Million
7.2.3.By Functionality- Market Insights and Forecast 2022-2032, USD Million
7.2.4.By End User- Market Insights and Forecast 2022-2032, USD Million
8. Competitive Outlook
8.1. Company Profiles
8.1.1.Almi GmbH
8.1.1.1. Business Description
8.1.1.2. Product Portfolio
8.1.1.3. Collaborations & Alliances
8.1.1.4. Recent Developments
8.1.1.5. Financial Details
8.1.1.6. Others
8.1.2.Tripoint GmbH
8.1.2.1. Business Description
8.1.2.2. Product Portfolio
8.1.2.3. Collaborations & Alliances
8.1.2.4. Recent Developments
8.1.2.5. Financial Details
8.1.2.6. Others
8.1.3.Peeroton GmbH
8.1.3.1. Business Description
8.1.3.2. Product Portfolio
8.1.3.3. Collaborations & Alliances
8.1.3.4. Recent Developments
8.1.3.5. Financial Details
8.1.3.6. Others
8.1.4.APOtrend Vertrieb GmbH
8.1.4.1. Business Description
8.1.4.2. Product Portfolio
8.1.4.3. Collaborations & Alliances
8.1.4.4. Recent Developments
8.1.4.5. Financial Details
8.1.4.6. Others
8.1.5.Hut Group Ltd, The
8.1.5.1. Business Description
8.1.5.2. Product Portfolio
8.1.5.3. Collaborations & Alliances
8.1.5.4. Recent Developments
8.1.5.5. Financial Details
8.1.5.6. Others
8.1.6.Fitnesshotline GmbH
8.1.6.1. Business Description
8.1.6.2. Product Portfolio
8.1.6.3. Collaborations & Alliances
8.1.6.4. Recent Developments
8.1.6.5. Financial Details
8.1.6.6. Others
8.1.7.Active Nutrition International GmbH
8.1.7.1. Business Description
8.1.7.2. Product Portfolio
8.1.7.3. Collaborations & Alliances
8.1.7.4. Recent Developments
8.1.7.5. Financial Details
8.1.7.6. Others
8.1.8.Power Tec Ltd
8.1.8.1. Business Description
8.1.8.2. Product Portfolio
8.1.8.3. Collaborations & Alliances
8.1.8.4. Recent Developments
8.1.8.5. Financial Details
8.1.8.6. Others
8.1.9.Optimum Nutrition Inc
8.1.9.1. Business Description
8.1.9.2. Product Portfolio
8.1.9.3. Collaborations & Alliances
8.1.9.4. Recent Developments
8.1.9.5. Financial Details
8.1.9.6. Others
8.1.10. Well Plus Trade Austria Vertriebs GmbH
8.1.10.1. Business Description
8.1.10.2. Product Portfolio
8.1.10.3. Collaborations & Alliances
8.1.10.4. Recent Developments
8.1.10.5. Financial Details
8.1.10.6. Others
9. Disclaimer
| Segment | Sub-Segment |
|---|---|
| By Product Type |
|
| By Sales Channel |
|
| By Ingredients |
|
| By Functionality |
|
| By End User |
|
Research Methodology
This study followed a structured approach comprising four key phases to assess the size and scope of the electro-oxidation market. The process began with thorough secondary research to collect data on the target market, related markets, and broader industry context. These findings, along with preliminary assumptions and estimates, were then validated through extensive primary research involving industry experts from across the value chain. To calculate the overall market size, both top-down and bottom-up methodologies were employed. Finally, market segmentation and data triangulation techniques were applied to refine and validate segment-level estimations.
Secondary Research
The secondary research phase involved gathering data from a wide range of credible and published sources. This step helped in identifying industry trends, defining market segmentation, and understanding the market landscape and value chain.
Sources consulted during this phase included:
- Company annual reports, investor presentations, and press releases
- Industry white papers and certified publications
- Trade directories and market-recognized databases
- Articles from authoritative authors and reputable journals
- Gold and silver standard websites
Secondary research was critical in mapping out the industry's value chain and monetary flow, identifying key market segments, understanding regional variations, and tracking significant industry developments.
Other key sources:
- Financial disclosures
- Industry associations and trade bodies
- News outlets and business magazines
- Academic journals and research studies
- Paid industry databases
Primary Research
To validate secondary data and gain deeper market insights, primary research was conducted with key stakeholders across both the supply and demand sides of the market.
On the demand side, participants included decision-makers and influencers from end-user industries—such as CIOs, CTOs, and CSOs—who provided first-hand perspectives on market needs, product usage, and future expectations.
On the supply side, interviews were conducted with manufacturers, industry associations, and institutional participants to gather insights into current offerings, product pipelines, and market challenges.
Primary interviews provided critical inputs such as:
- Market size and revenue data
- Product and service breakdowns
- Market forecasts
- Regional and application-specific trends
Stakeholders consulted included:
- Leading OEM and solution providers
- Channel and distribution partners
- End users across various applications
- Independent consultants and industry specialists
Market Size Estimation and Data Triangulation
- Identifying Key Market Participants (Secondary Research)
- Goal: To identify the major players or companies in the target market. This typically involves using publicly available data sources such as industry reports, market research publications, and financial statements of companies.
- Tools: Reports from firms like Gartner, Forrester, Euromonitor, Statista, IBISWorld, and others. Public financial statements, news articles, and press releases from top market players.
- Extracting Earnings of Key Market Participants
- Goal: To estimate the earnings generated from the product or service being analyzed. This step helps in understanding the revenue potential of each market player in a specific geography.
- Methods: Earnings data can be gathered from:
- Publicly available financial reports (for listed companies).
- Interviews and primary data sources from professionals, such as Directors, VPs, SVPs, etc. This is especially useful for understanding more nuanced, internal data that isn't publicly disclosed.
- Annual reports and investor presentations of key players.
- Data Collation and Development of a Relevant Data Model
- Goal: To collate inputs from both primary and secondary sources into a structured, data-driven model for market estimation. This model will incorporate key market KPIs and any independent variables relevant to the market.
- Key KPIs: These could include:
- Market size, growth rate, and demand drivers.
- Industry-specific metrics like market share, average revenue per customer (ARPC), or average deal size.
- External variables, such as economic growth rates, inflation rates, or commodity prices, that could affect the market.
- Data Modeling: Based on this data, the market forecasts are developed for the next 5 years. A combination of trend analysis, scenario modeling, and statistical regression might be used to generate projections.
- Scenario Analysis
- Goal: To test different assumptions and validate how sensitive the market is to changes in key variables (e.g., market demand, regulatory changes, technological disruptions).
- Types of Scenarios:
- Base Case: Based on current assumptions and historical data.
- Best-Case Scenario: Assuming favorable market conditions, regulatory environments, and technological advancements.
- Worst-Case Scenario: Accounting for adverse factors, such as economic downturns, stricter regulations, or unexpected disruptions.


