Australia Water & Wastewater Pump Market Report: Trends, Growth and Forecast (2026-2032)
By Pump Type (Centrifugal Pumps (End Suction, Split Case, Vertical (Turbine, Axial Pump, Mixed Flow Pump), Submersible Pump), Positive Displacement Pumps (Progressing Cavity, Diaphragm, Gear Pump, Others)), By Application (Water, Wastewater), By End User (Industrial Water & Wastewater, Municipal Water & Wastewater) ... Read more
|
Major Players
|
Australia Water & Wastewater Pump Market Statistics and Insights, 2026
- Market Size Statistics
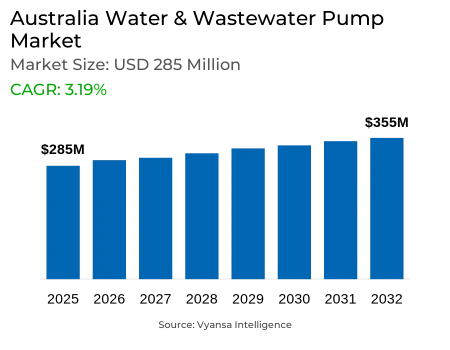
- Water & Wastewater Pump in Australia is estimated at $ 285 Million.
- The market size is expected to grow to $ 355 Million by 2032.
- Market to register a CAGR of around 3.19% during 2026-32.
- Pump Type Segment
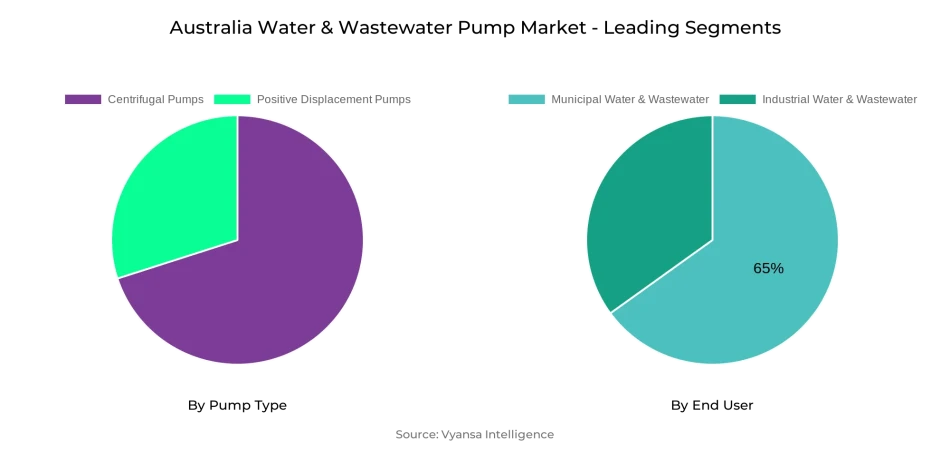
- Centrifugal Pumps continues to dominate the market.
- Competition
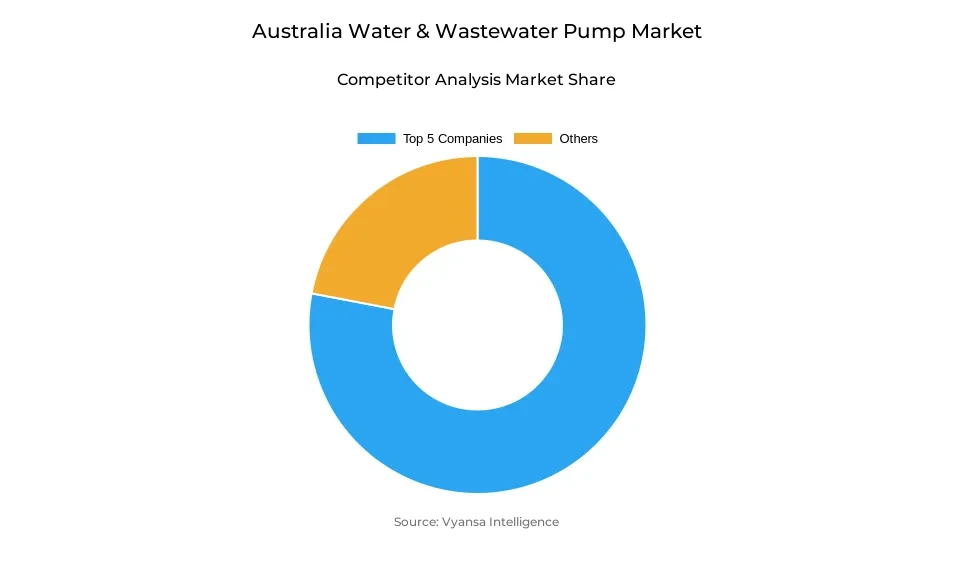
- More than 10 companies are actively engaged in producing Water & Wastewater Pump in Australia.
- Top 5 companies acquired the maximum share of the market.
- ITT, IDEX, Dover, Flowserve, Sulzer AG etc., are few of the top companies.
- End User
- Municipal Water & Wastewater grabbed 65% of the market.
Australia Water & Wastewater Pump Market Outlook
Australia's increasing water consumption is generating steady demand for pumping equipment throughout homes, industry, and utilities. Residential water consumption averaged 151 kL per home in 2023–24, stimulated by warmer summers and increased garden watering, putting pressure on supply networks. Utilities are advancing and developing pump fleets to keep reliability and pressure under high demand. The Water & Wastewater Pump market within Australia has a worth of $285 million in 2025 and is anticipated to increase to $355 million by the year 2032, recording steady growth prospects for suppliers.
Urban infrastructure continues to be the biggest pump installation driver, with 65% of the market. Ongoing investment in urban supply, sewage treatment, and network renewal continues to put centrifugal pumps in the limelight because they can cover a vast spectrum of flow rates and are still the most dependable option for distribution and transfer duties. Positive displacement pumps cater to more niche applications like sludge management and chemical dosing but command a lesser share than centrifugal pumps.
Meanwhile, manufacturing and agricultural segments are increasing operations, requiring energy-efficient and corrosion-resistant pumps for irrigation, food processing, and mining uses. Industrial Water & Wastewater, however smaller in proportion, is the fastest-growing end-use segment as plants invest in on-site treatment and reuse technologies to reduce freshwater reliance.
Australia's low wastewater reuse base sets aside untapped potential. In Western Australia, a mere 12.5% is reused; nationally, reuse increased to 321 GL in 2021–22. Increasing regulation for drought resilience and government investment are stimulating increased adoption of reuse. This creates potential for high-tech pumping technologies—variable-speed and smart-monitored pumps—that reduce lifecycle expense, enable reclaimed water systems, and respond to Australia's circular water aspirations.
Australia Water & Wastewater Pump Market Growth Driver
Rising Demand Fuels Pump Deployments
Australia's expanding water consumption fuels pump installations. Residential use recovers, with the average annual consumption rising to 151 kL per residence in 2023–24, as more frequent and intense heatwaves boost garden watering and appliance runs. The boom adds additional strain on supply networks, leading utilities to upgrade and extend pumping infrastructure to ensure pressure and reliability during peak demand.
At the same time, all industries increase size of operations. Increased irrigation and industrial processing compel utilities to use energy-efficient pumps with the ability to transport higher flow rates and variable water qualities. Such pump technology advancements are essential to address Australia's changing water supply demands.
Australia Water & Wastewater Pump Market Challenge
Limited Reuse Hampers Sustainability
Despite the infrastructure expansion, reuse is low. Only 12.5% of Western Australia's wastewater is recycled, with the majority of effluent going untreated for reuse. This gap limits circular-water programs and highlights the necessity for additional treatment and conveyance infrastructure.
Unused wastewater still ends up being released, putting pressure on ecosystems and increasing dependence on freshwater supplies. The achievement of urban growth goals is made possible by incorporating new pump systems into treatment facilities in order to capture and reuse more effluent.
Unlock Market Intelligence
Explore the market potential with our data-driven report
Australia Water & Wastewater Pump Market Trend
Surge in Water Reuse Practices
Australia is embracing reuse than ever before. Reuse water supply at a national level increased to 321 GL in 2021–22, led by agriculture's 90 GL uptake and utilities' 112 GL contribution. Enhanced treatment standards and policy assistance are stimulating movement toward circular water economies.
Pump manufacturers react by creating corrosion-resistant, variable-speed pumps specific to reclaimed water's distinct characteristics. These technologies align technology trends with sustainability objectives and system resilience.
Australia Water & Wastewater Pump Market Opportunity
Untapped Recycled Water Offers Growth
Australia's modest reuse baseline is full of large opportunities. With national reuse standing at 321 GL in 2021–22, much scope is available to upsize projects—from residential greywater schemes to large-scale industrial reuse. Upgrade pump fleets with intelligent monitoring and high efficiency to lower lifecycle costs and increase reuse take-up.
Government funding for drought resilience and watershed protection unlocks opportunities for pump suppliers to provide turnkey solutions, widening market scope across municipal and industrial markets.
Unlock Market Intelligence
Explore the market potential with our data-driven report
Australia Water & Wastewater Pump Market Segmentation Analysis
By Pump Type
- Centrifugal Pumps
- Positive Displacement Pumps
The most market-dominant segment in Pump Type is the Centrifugal Pump, which still leads because it is simple, reliable, and a snap to maintain. The pumps work with a broad range of flow rates and pressures, so they are well-suited to municipal distribution and wastewater transfer applications.
Positive displacement pumps address specialized application requirements—like the management of viscous sludges or exact chemical dosing—but centrifugal types are still the horse for courses in Australia's water and wastewater systems.
By End User
- Industrial Water & Wastewater
- Municipal Water & Wastewater
The energy market with the largest share within End User is Municipal Water & Wastewater, due to continuous expenditure on urban infrastructure, network renewal, and compliance with water quality and effluent treatment regulations.
Industrial Water & Wastewater is the most rapidly growing market segment, driven by the food processing, mining, and manufacturing industries requiring on-site treatment and reuse capacity to comply with stringent discharge requirements and cut freshwater pull-through.
Top Companies in Australia Water & Wastewater Pump Market
The top companies operating in the market include ITT, IDEX, Dover, Flowserve, Sulzer AG, KSB, Xylem, Grundfos, Ebara, SPX Flow, etc., are the top players operating in the Australia Water & Wastewater Pump Market.
Frequently Asked Questions
Related Report
1. Market Segmentation
1.1. Research Scope
1.2. Research Methodology
1.3. Definitions and Assumptions
2. Executive Summary
3. Australia Water & Wastewater Pump Market Policies, Regulations, and Standards
4. Australia Water & Wastewater Pump Market Dynamics
4.1. Growth Factors
4.2. Challenges
4.3. Trends
4.4. Opportunities
5. Australia Water & Wastewater Pump Market Statistics, 2022-2032F
5.1. Market Size & Growth Outlook
5.1.1.By Revenues in US$ Million
5.2. Market Segmentation & Growth Outlook
5.2.1.By Pump Type
5.2.1.1. Centrifugal Pumps- Market Insights and Forecast 2022-2032, USD Million
5.2.1.1.1. End Suction- Market Insights and Forecast 2022-2032, USD Million
5.2.1.1.2. Split Case- Market Insights and Forecast 2022-2032, USD Million
5.2.1.1.3. Vertical- Market Insights and Forecast 2022-2032, USD Million
5.2.1.1.3.1. Turbine- Market Insights and Forecast 2022-2032, USD Million
5.2.1.1.3.2. Axial Pump- Market Insights and Forecast 2022-2032, USD Million
5.2.1.1.3.3. Mixed Flow Pump- Market Insights and Forecast 2022-2032, USD Million
5.2.1.1.4. Submersible Pump- Market Insights and Forecast 2022-2032, USD Million
5.2.1.2. Positive Displacement Pumps- Market Insights and Forecast 2022-2032, USD Million
5.2.1.2.1. Progressing Cavity- Market Insights and Forecast 2022-2032, USD Million
5.2.1.2.2. Diaphragm- Market Insights and Forecast 2022-2032, USD Million
5.2.1.2.3. Gear Pump- Market Insights and Forecast 2022-2032, USD Million
5.2.1.2.4. Others- Market Insights and Forecast 2022-2032, USD Million
5.2.2.By Application
5.2.2.1. Water- Market Insights and Forecast 2022-2032, USD Million
5.2.2.2. Wastewater- Market Insights and Forecast 2022-2032, USD Million
5.2.3.By End User
5.2.3.1. Industrial Water & Wastewater- Market Insights and Forecast 2022-2032, USD Million
5.2.3.2. Municipal Water & Wastewater- Market Insights and Forecast 2022-2032, USD Million
5.2.4.By Competitors
5.2.4.1. Competition Characteristics
5.2.4.2. Market Share & Analysis
6. Australia Centrifugal Water & Wastewater Pump Market Statistics, 2020-2030F
6.1. Market Size & Growth Outlook
6.1.1.By Revenues in US$ Million
6.2. Market Segmentation & Growth Outlook
6.2.1.By Pump Type- Market Insights and Forecast 2022-2032, USD Million
6.2.2.By Application- Market Insights and Forecast 2022-2032, USD Million
6.2.3.By End User- Market Insights and Forecast 2022-2032, USD Million
7. Australia Positive Displacement Water & Wastewater Pump Market Statistics, 2020-2030F
7.1. Market Size & Growth Outlook
7.1.1.By Revenues in US$ Million
7.2. Market Segmentation & Growth Outlook
7.2.1.By Pump Type- Market Insights and Forecast 2022-2032, USD Million
7.2.2.By Application- Market Insights and Forecast 2022-2032, USD Million
7.2.3.By End User- Market Insights and Forecast 2022-2032, USD Million
8. Competitive Outlook
8.1. Company Profiles
8.1.1.Flowserve Corporation
8.1.1.1. Business Description
8.1.1.2. Product Portfolio
8.1.1.3. Collaborations & Alliances
8.1.1.4. Recent Developments
8.1.1.5. Financial Details
8.1.1.6. Others
8.1.2.Ebara Corporation
8.1.2.1. Business Description
8.1.2.2. Product Portfolio
8.1.2.3. Collaborations & Alliances
8.1.2.4. Recent Developments
8.1.2.5. Financial Details
8.1.2.6. Others
8.1.3.WILO SE
8.1.3.1. Business Description
8.1.3.2. Product Portfolio
8.1.3.3. Collaborations & Alliances
8.1.3.4. Recent Developments
8.1.3.5. Financial Details
8.1.3.6. Others
8.1.4.Sulzer Limited
8.1.4.1. Business Description
8.1.4.2. Product Portfolio
8.1.4.3. Collaborations & Alliances
8.1.4.4. Recent Developments
8.1.4.5. Financial Details
8.1.4.6. Others
8.1.5.Grundfos Holding A/S
8.1.5.1. Business Description
8.1.5.2. Product Portfolio
8.1.5.3. Collaborations & Alliances
8.1.5.4. Recent Developments
8.1.5.5. Financial Details
8.1.5.6. Others
8.1.6.Xylem Inc.
8.1.6.1. Business Description
8.1.6.2. Product Portfolio
8.1.6.3. Collaborations & Alliances
8.1.6.4. Recent Developments
8.1.6.5. Financial Details
8.1.6.6. Others
8.1.7.KSB SE & Co. KGaA
8.1.7.1. Business Description
8.1.7.2. Product Portfolio
8.1.7.3. Collaborations & Alliances
8.1.7.4. Recent Developments
8.1.7.5. Financial Details
8.1.7.6. Others
8.1.8.Kirloskar Brothers Limited (KBL)
8.1.8.1. Business Description
8.1.8.2. Product Portfolio
8.1.8.3. Collaborations & Alliances
8.1.8.4. Recent Developments
8.1.8.5. Financial Details
8.1.8.6. Others
8.1.9.Franklin Electric
8.1.9.1. Business Description
8.1.9.2. Product Portfolio
8.1.9.3. Collaborations & Alliances
8.1.9.4. Recent Developments
8.1.9.5. Financial Details
8.1.9.6. Others
8.1.10. Pentair PLC
8.1.10.1. Business Description
8.1.10.2. Product Portfolio
8.1.10.3. Collaborations & Alliances
8.1.10.4. Recent Developments
8.1.10.5. Financial Details
8.1.10.6. Others
9. Disclaimer
| Segment | Sub-Segment |
|---|---|
| By Pump Type |
|
| By Application |
|
| By End User |
|
Research Methodology
This study followed a structured approach comprising four key phases to assess the size and scope of the electro-oxidation market. The process began with thorough secondary research to collect data on the target market, related markets, and broader industry context. These findings, along with preliminary assumptions and estimates, were then validated through extensive primary research involving industry experts from across the value chain. To calculate the overall market size, both top-down and bottom-up methodologies were employed. Finally, market segmentation and data triangulation techniques were applied to refine and validate segment-level estimations.
Secondary Research
The secondary research phase involved gathering data from a wide range of credible and published sources. This step helped in identifying industry trends, defining market segmentation, and understanding the market landscape and value chain.
Sources consulted during this phase included:
- Company annual reports, investor presentations, and press releases
- Industry white papers and certified publications
- Trade directories and market-recognized databases
- Articles from authoritative authors and reputable journals
- Gold and silver standard websites
Secondary research was critical in mapping out the industry's value chain and monetary flow, identifying key market segments, understanding regional variations, and tracking significant industry developments.
Other key sources:
- Financial disclosures
- Industry associations and trade bodies
- News outlets and business magazines
- Academic journals and research studies
- Paid industry databases
Primary Research
To validate secondary data and gain deeper market insights, primary research was conducted with key stakeholders across both the supply and demand sides of the market.
On the demand side, participants included decision-makers and influencers from end-user industries—such as CIOs, CTOs, and CSOs—who provided first-hand perspectives on market needs, product usage, and future expectations.
On the supply side, interviews were conducted with manufacturers, industry associations, and institutional participants to gather insights into current offerings, product pipelines, and market challenges.
Primary interviews provided critical inputs such as:
- Market size and revenue data
- Product and service breakdowns
- Market forecasts
- Regional and application-specific trends
Stakeholders consulted included:
- Leading OEM and solution providers
- Channel and distribution partners
- End users across various applications
- Independent consultants and industry specialists
Market Size Estimation and Data Triangulation
- Identifying Key Market Participants (Secondary Research)
- Goal: To identify the major players or companies in the target market. This typically involves using publicly available data sources such as industry reports, market research publications, and financial statements of companies.
- Tools: Reports from firms like Gartner, Forrester, Euromonitor, Statista, IBISWorld, and others. Public financial statements, news articles, and press releases from top market players.
- Extracting Earnings of Key Market Participants
- Goal: To estimate the earnings generated from the product or service being analyzed. This step helps in understanding the revenue potential of each market player in a specific geography.
- Methods: Earnings data can be gathered from:
- Publicly available financial reports (for listed companies).
- Interviews and primary data sources from professionals, such as Directors, VPs, SVPs, etc. This is especially useful for understanding more nuanced, internal data that isn't publicly disclosed.
- Annual reports and investor presentations of key players.
- Data Collation and Development of a Relevant Data Model
- Goal: To collate inputs from both primary and secondary sources into a structured, data-driven model for market estimation. This model will incorporate key market KPIs and any independent variables relevant to the market.
- Key KPIs: These could include:
- Market size, growth rate, and demand drivers.
- Industry-specific metrics like market share, average revenue per customer (ARPC), or average deal size.
- External variables, such as economic growth rates, inflation rates, or commodity prices, that could affect the market.
- Data Modeling: Based on this data, the market forecasts are developed for the next 5 years. A combination of trend analysis, scenario modeling, and statistical regression might be used to generate projections.
- Scenario Analysis
- Goal: To test different assumptions and validate how sensitive the market is to changes in key variables (e.g., market demand, regulatory changes, technological disruptions).
- Types of Scenarios:
- Base Case: Based on current assumptions and historical data.
- Best-Case Scenario: Assuming favorable market conditions, regulatory environments, and technological advancements.
- Worst-Case Scenario: Accounting for adverse factors, such as economic downturns, stricter regulations, or unexpected disruptions.


