Asia Pacific Industrial Gases Market Report: Trends, Growth and Forecast (2026-2032)
Gas (Nitrogen Gas, Oxygen Gas, Carbon dioxide Gas, Argon Gas, Hydrogen Gas, Helium Gas, Acetylene Gas, Others), Application (Combustion and Process Oxygen, Welding and Metal Fabrication, Inerting Blanketing and Heat Treating, Cryogenics and liquefaction, Chemical Synthesis and Hydrogenation, Purging and Purifications, Analytical and Calibration), Supply Mode (Packaged Gas Supply (Merchant Sales), Bulk or Liquid Gas Supply, Onsite Generation or Pipeline Supply, Gas-as-a-Service Model), End User Industry (Oil and Gas, Petrochemicals and Chemicals, Power and Energy, Mining, Steelmaking, Metals, Healthcare, Food and Beverages, Fertilizers, Others), Country (China, India, Japan, South Korea, Australia, New Zealand, Taiwan, Rest of Asia Pacific) ... Read more
|
Major Players
|
Asia Pacific Industrial Gases Market Statistics and Insights, 2026
- Market Size Statistics
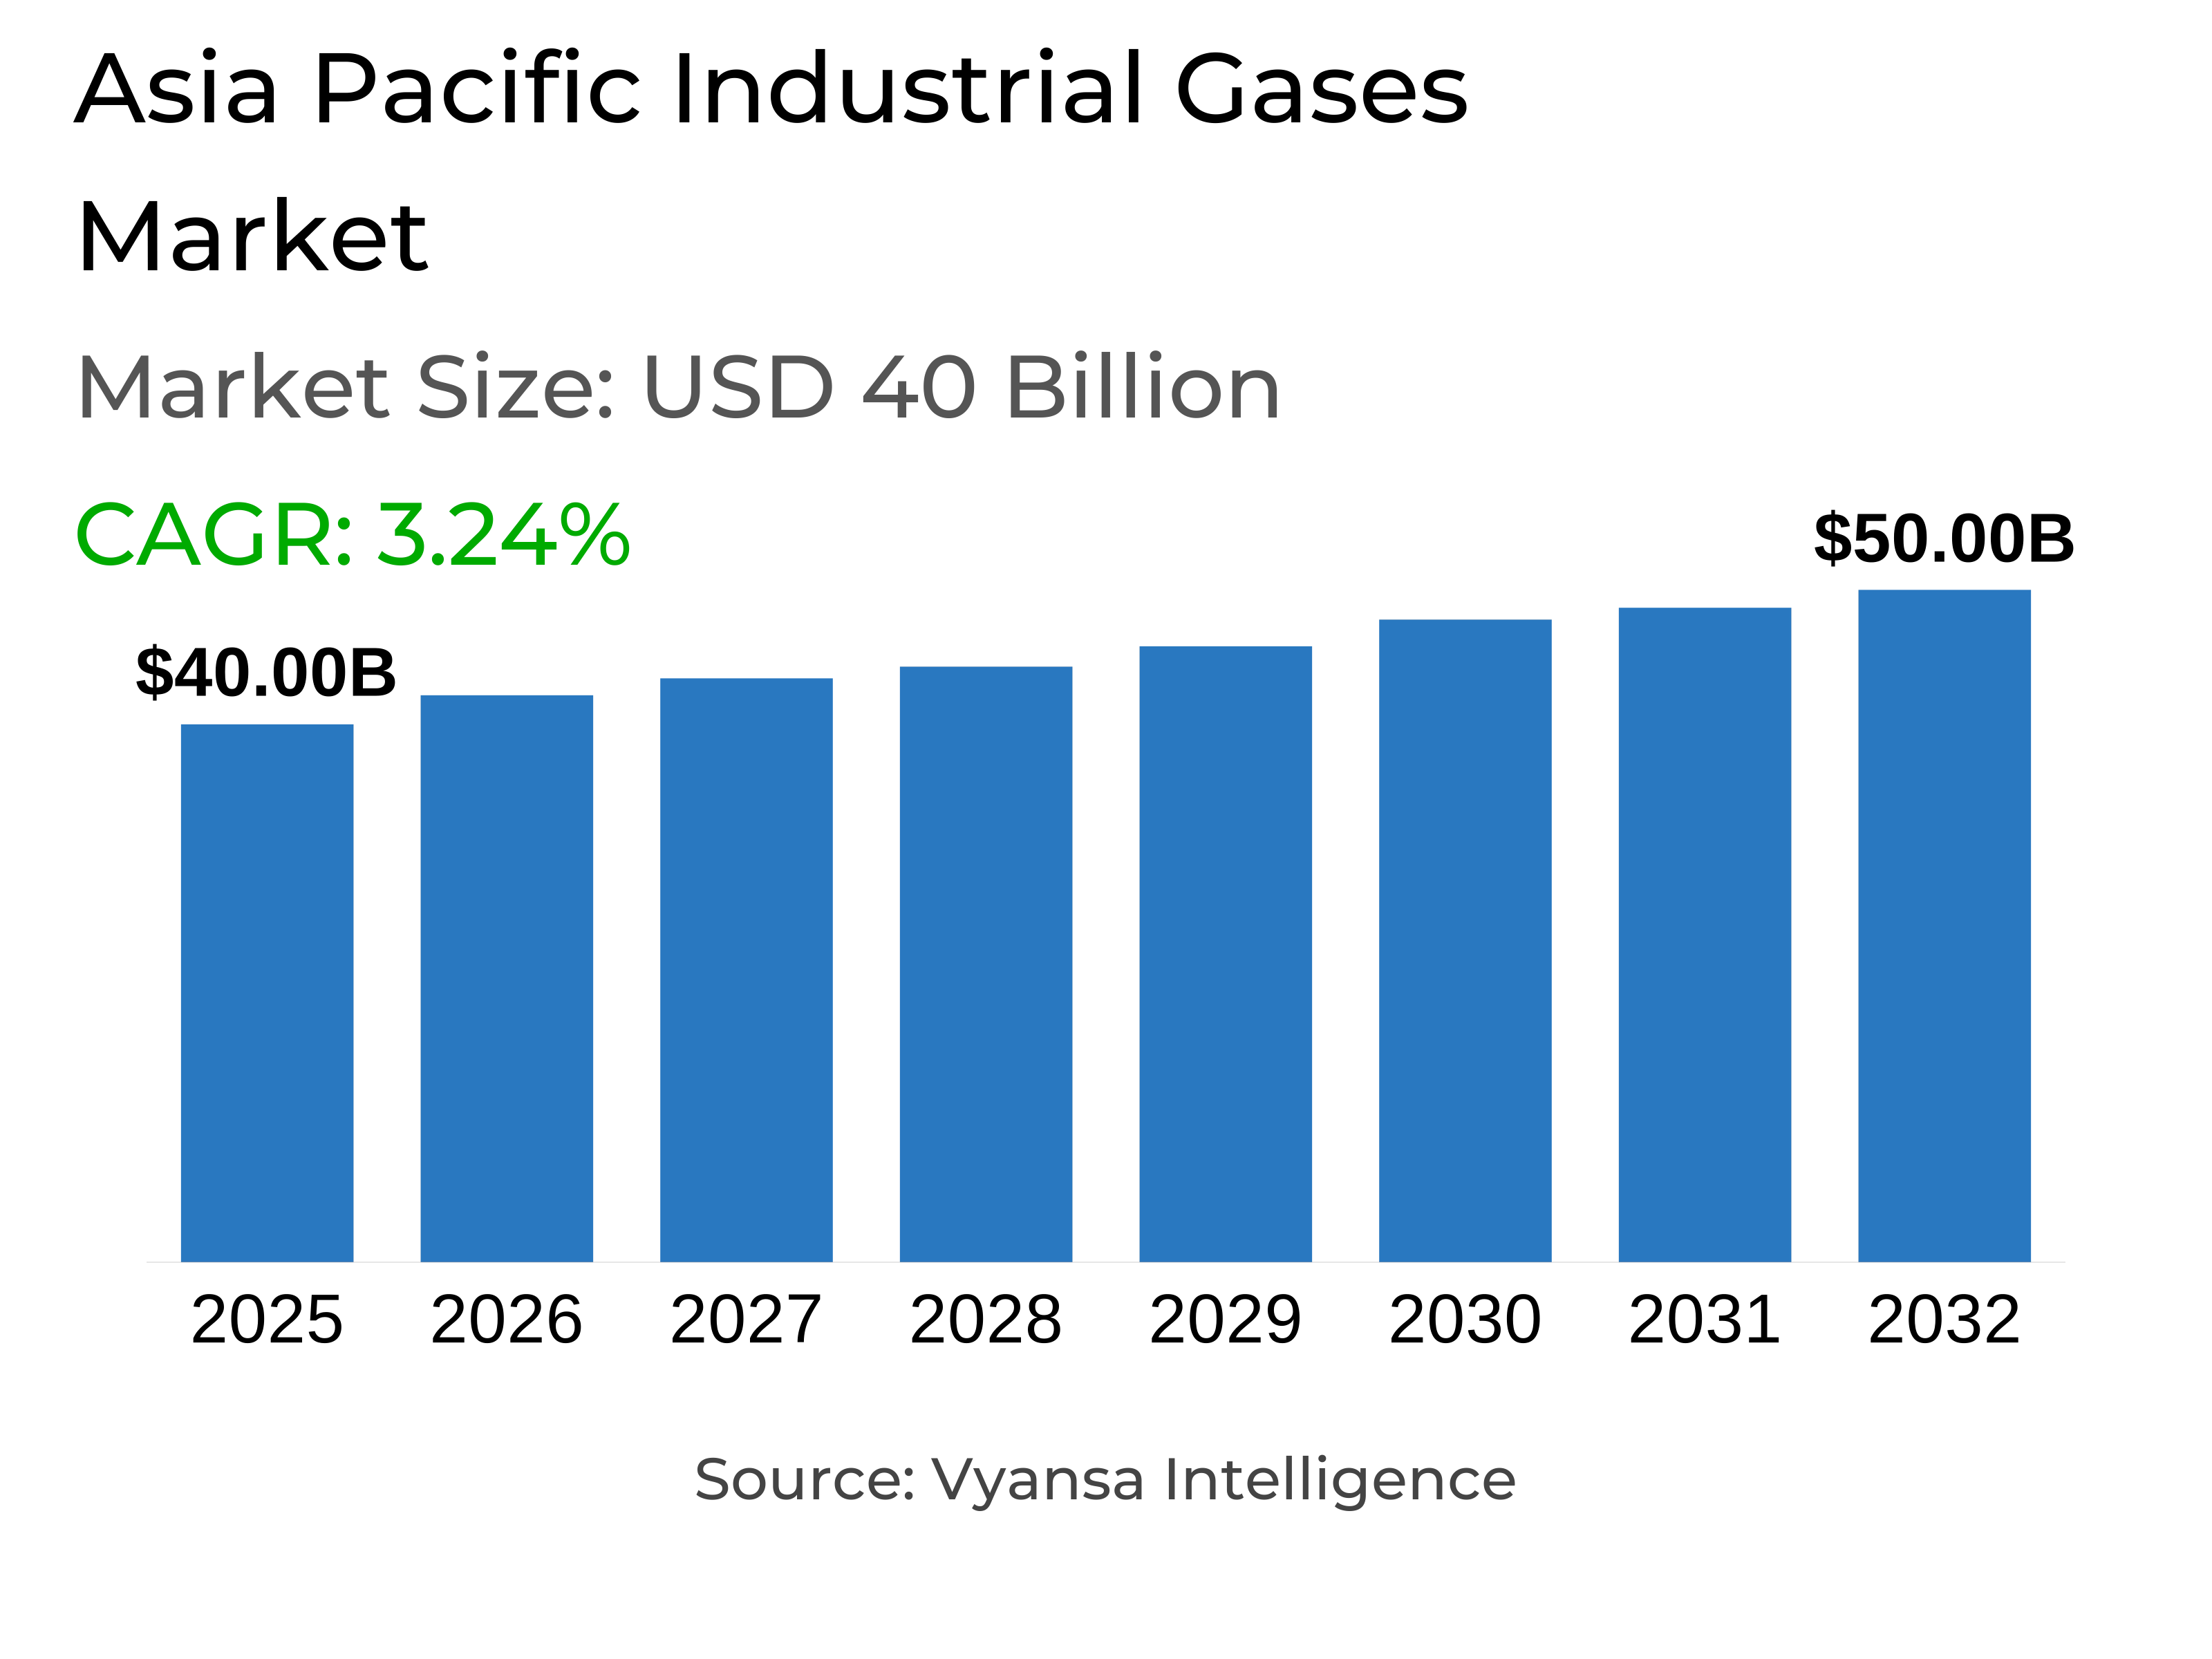
- Asia pacific industrial gases market is estimated at USD 40 billion.
- The market size is expected to grow to USD 50 billion by 2032.
- Market to register a cagr of around 3.24% during 2026-32.
- Application Shares
- Chemical synthesis and hydrogenation grabbed market share of 30%.
- Competition
- More than 10 companies are actively engaged in producing industrial gases in asia pacific.
- Top 5 companies acquired around 80% of the market share.
- Goyal MG Gases Pvt Ltd, Hangzhou Oxygen Plant Group Co Ltd (Hangyang), Iwatani Corporation, Air Liquide, Air Products and Chemicals Inc. etc., are few of the top companies.
- End User Industry
- Petrochemicals and chemicals grabbed 60% of the market.
- Country
- China leads with a 50% share of the asia pacific market.
Asia Pacific Industrial Gases Market Outlook
The Asia Pacific Industrial Gases Market was valued at USD 40 billion in 2025 and is expected to reach approximately USD 50 billion by 2032, growing at a CAGR of about 3.24% during 2026-2032. The steel and infrastructure production growth across major economies will drive market development. China and India remain the key contributors, where the crude steel output increased significantly during 2024.
Steelmaking, welding, and metal fabrication depend heavily on industrial gases such as oxygen, nitrogen, and argon. The rapid urbanization and growth of construction across India and Southeast Asia continue to fuel long-term gas consumption, aligning with ongoing public and private infrastructure investments. Hydrogen is increasingly becoming an integral part of the clean turnaround of Asia-Pacific. National programs, such as India's Green Hydrogen Mission and China's renewable hydrogen initiatives, continue to drive up electrolyzer and production capacity.
Asia-Pacific already providing more than 40% of the world's hydrogen capacity, it continues to be a hotbed for development in sustainable energy. As such, this transition provides broad industrial gas demand, particularly for refining and chemical applications which are heavily dependent on hydrogen feedstock. Among applications, chemical synthesis and hydrogenation have the largest share with nearly 30% of the market. The petrochemicals and chemicals industry leads in end-user demand with a share of 60%, largely using these gases in refining, fertilizer, and polymer production.
Expanding petrochemical and chemical manufacturing capacity across India, China, and Southeast Asia reinforces this leadership position. China remains the largest national market, capturing about 50% of regional industrial gas consumption due to its large-scale steel output, extensive petrochemical infrastructure, and strong government investment in clean energy and hydrogen initiatives. These factors put China at the forefront and ensure continued industrial gas growth across Asia-Pacific through 2032.

Asia Pacific Industrial Gases Market Growth Driver
Expanding Steel and Infrastructure Activities Stimulate Market Growth
Steel production growth continues to soar across the Asia-Pacific region, creating high demand for industrial gases used in manufacturing processes. Crude steel production in China reached 76 million tonnes in December 2024, up by 11.8% year over year. In contrast, India produced 13.6 million tonnes with 9.5% growth over last year. The World Steel Association indicated that oxygen, nitrogen, and argon continued to be fundamental in steelmaking, oxy-fuel cutting, and inert gas shielding. Stronger momentum in steel manufacturing further heightens the consumption of industrial gases in various traditional and advanced metallurgical processes.
Growth in infrastructure development and building construction further increases gas demands within the region. The Asian Development Bank estimates that India's capital expenditure on infrastructure will increase annually by 34%, while the real estate sector is set to reach USD 1 trillion by 2030. This growth in building and construction automatically increases the demand for gases used in welding, fabrication, and metalwork. Rapid urbanization in India and Southeast Asia continues to drive long-term demand for industrial gases, linked to sustained public and private investment in infrastructure.
Asia Pacific Industrial Gases Market Challenge
Regulatory Compliance and Supply Chain Risks Constrain Expansion
The tightening regulatory environments and varying chemical safety standards increase operational costs for the industrial gases sector in the Asia-Pacific region. For example, Singapore recently introduced new restrictions on persistent organic pollutants with its Environmental Protection and Management Amendment Regulations 2025. Similarly, China's draft Environmental Code proposes fines up to USD 280,000 for non-compliance. These frameworks are pushing companies to adopt green chemistry practices and change production systems in accordance with the increasing sustainability and safety requirements.
Besides, local supply chains are still vulnerable to natural calamities and geopolitical crises. The Asia Business Council points out the recurring causes of disruption to include typhoons, earthquakes, and congestion in ports, which affect logistics and the supply of raw materials. The consolidated network for special material suppliers makes them more susceptible to exogenous shocks. Increasingly, freight rates and extended lead times reduce efficiency. Companies are now looking to diversify sources, enhance the redundancy of supplies, and invest in digital monitoring of logistics to minimize such disruptions and ensure seamless gas supplies.
Unlock Market Intelligence
Explore the market potential with our data-driven report
Asia Pacific Industrial Gases Market Trend
Rising Hydrogen Investments Reshape Industrial Gas Dynamics
Hydrogen is emerging as a key key focus area for the clean energy transition that Asia-Pacific economies are undertaking with broad-based government support. The National Green Hydrogen Mission of India, approved with an outlay of Rs. 19,744 crore, plans to achieve 5 million tonnes production by 2030. It also granted contracts for the expansion of electrolyser as well as hydrogen production capacity. Similarly, China's National Energy Administration calls for accelerated hydrogen development from renewable sources, integrating it into national decarbonization goals. These collectively mark the beginning of a structural change in regional gas sourcing toward sustainable energy.
Advances in technology are further revolutionizing hydrogen production efficiency and scalability. According to the International Energy Agency, the Asia-Pacific accounts for more than 40% of global hydrogen capacity and half of the world's industrial hydrogen demand. China is targeting 200,000 tonnes of green hydrogen output by 2025 and 80 GW of electrolyzer capacity by 2030. In parallel, Japan and South Korea are developing electrolyzer manufacturing via subsidies and partnerships. This thus creates a very strong ecosystem for hydrogen innovation that would support the long-term sustainability of the industrial gas industry.
Asia Pacific Industrial Gases Market Opportunity
Emerging Growth Potential in Food and Electronics Applications
The food processing and preservation industry is seeing increased demand for industrial gases, with a focus on the demand for nitrogen and carbon dioxide. Nitrogen's inertness allows it to be in safe contact for quick freezing and packaging in order to preserve the quality and shelf life of perishable products. Strong urbanization, increase in disposable incomes, and increasing demand for packaged foods across China, India, and Southeast Asia produce steady gas consumption in both cold-chain logistics and modified atmosphere packaging. Growing beverage carbonation in soft drinks and sparkling water categories further creates market opportunities for carbon dioxide suppliers.
New areas of application for ultra-pure gas are also created by the semiconductor and electronics industries. While East and Southeast Asia produces more than 80% of total semiconductor output worldwide, precision gases are crucial to cleaning, deposition, and etching of wafers in chip fabrication. Advanced fabs are being well-invested in to meet the demand surge in new areas such as artificial intelligence, 5G, and automotive electronics in Taiwan, South Korea, and China. This rise in electronics manufacturing translates into steadily growing demand for high-purity gases, hence making it a strategic opportunity within the industrial gases market.
Asia Pacific Industrial Gases Market Country Analysis
China remains the largest market in the industrial gas sector across the Asia Pacific region with market share of around 50%. The country benefits from being the world's largest producer of steel with production of more than 1,020 million tonnes in 2024, and it also boasts a very high level of petrochemical refining throughput of 14.8 million barrels per day. The growth in gas storage capacity, which aims to reach 60 billion cubic metres by 2025, guarantees uninterruptible industrial operations. This effectively makes China the largest consumer and producer of industrial gases within the region, which is wholly dependent on the size of its manufacturing and heavy industry sectors. Governments are playing an important role in reinforcing China's industrial gas market leadership through ambitious clean energy and hydrogen projects.
The National Development and Reform Commission has developed the 2024 Catalogue for Green and Low-Carbon Transition Industries which claims hydrogen is positioned to act as a key driver in the country's decarbonization efforts. This is further supported by government funding up to USD 42 billion that will allow the replacements of systems reliant on fossil fuels with cleaner alternatives in the industrial and energy sectors. The strategic join-up of industrial capability on a large scale, linked with sustainability goals, (which are tried and tested), can ensure that China retains its market leadership position. This will therefore allow China to continue to drive the Asian and Asia-Pacific industrial gas market, into 2032 and beyond.
Unlock Market Intelligence
Explore the market potential with our data-driven report
Asia Pacific Industrial Gases Market Segmentation Analysis

By Application
- Combustion and Process Oxygen
- Welding and Metal Fabrication
- Inerting Blanketing and Heat Treating
- Cryogenics and liquefaction
- Chemical Synthesis and Hydrogenation
- Purging and Purifications
- Analytical and Calibration
Chemical synthesis and hydrogenation account for around 30% of total demand for industrial gases in the Asia-Pacific region, making them the leading category of applications. Hydrogen is an essential feedstock for ammonia, methanol, and a wide range of chemical intermediates that go into the manufacture of fertilizers and petrochemicals. Hydrogen is essential for sustaining agriculture and industry, shown by India's production of more than 36 million tonnes of nitrogen-based fertilizers. These applications form the backbone of regional energy and food security and will continue to be relevant for the supply chains of industrial gases.
Hydrogen utilization in refining and chemical synthesis further solidifies this segment's prominence. China contributes about 25 million tonnes of hydrogen annually, around one-quarter of global production, impelled by refinery operations and chemical processing. The expansion of petrochemical capacity across Asia to undergird wider industrial development has reinforced the pivotal place of hydrogen in processes of chemical transformation. National programs like India's Green Hydrogen Mission continue to firm up hydrogen infrastructure, underpin stable long-term growth in chemical synthesis applications through the industrial gases sector.
By End User Industry
- Oil and Gas
- Petrochemicals and Chemicals
- Power and Energy
- Mining
- Steelmaking
- Metals
- Healthcare
- Food and Beverages
- Fertilizers
- Others
Petrochemicals and chemicals is the largest segment with share of around 60% of Asia-Pacific's industrial gases market because oxygen, nitrogen, hydrogen, and argon are widely used to manufacture refined products, polymers, and fertilizers. According to the International Energy Agency, petrochemical production in the Asia-Pacific and Middle East will increase by 10 percent through 2050, reflecting the region's increasing dominance in global chemical feedstock production. India, Southeast Asia, and the Middle East will together account for close to 30% of global ammonia production in mid-century.
Accordingly, rapid industrialization coupled with infrastructure expansion leads to strengthened petrochemical demand from the construction, automotive, and packaging industries. Petrochemical-based materials like polyethylene, PVC, and polystyrene are vital for demands in housing, insulation, and industrial component manufacturing. Major infrastructure projects by the Asian Development Bank and increasing vehicle production-to more than 55 million units in 2023-sustain intensive gas usage for petrochemical production. This close integration with various industries will keep the segment dominant well into 2032.
Top Companies in Asia Pacific Industrial Gases Market
The top companies operating in the market include Goyal MG Gases Pvt Ltd, Hangzhou Oxygen Plant Group Co Ltd (Hangyang), Iwatani Corporation, Air Liquide, Air Products and Chemicals Inc., Asia Technical Gas Co Pte Ltd, BASF, Bhuruka Gases Ltd, Linde plc, Yingde Gases Shanghai, etc., are the top players operating in the Asia Pacific Industrial Gases Market.
Frequently Asked Questions
Related Report
1. Market Segmentation
1.1. Research Scope
1.2. Research Methodology
1.3. Definitions and Assumptions
2. Executive Summary
3. Asia Pacific Industrial Gases Market Policies, Regulations, and Standards
4. Asia Pacific Industrial Gases Market Dynamics
4.1. Growth Factors
4.2. Challenges
4.3. Trends
4.4. Opportunities
5. Asia Pacific Industrial Gases Market Statistics, 2022-2032F
5.1. Market Size & Growth Outlook
5.1.1.By Revenues in USD Million
5.1.2.By Quantity Sold in Tons
5.2. Market Segmentation & Growth Outlook
5.2.1.By Gas
5.2.1.1. Nitrogen Gas- Market Insights and Forecast 2022-2032, USD Million & Quantity in Tons
5.2.1.2. Oxygen Gas- Market Insights and Forecast 2022-2032, USD Million & Quantity in Tons
5.2.1.3. Carbon dioxide Gas- Market Insights and Forecast 2022-2032, USD Million & Quantity in Tons
5.2.1.4. Argon Gas- Market Insights and Forecast 2022-2032, USD Million & Quantity in Tons
5.2.1.5. Hydrogen Gas- Market Insights and Forecast 2022-2032, USD Million & Quantity in Tons
5.2.1.6. Helium Gas- Market Insights and Forecast 2022-2032, USD Million & Quantity in Tons
5.2.1.7. Acetylene Gas- Market Insights and Forecast 2022-2032, USD Million & Quantity in Tons
5.2.1.8. Others- Market Insights and Forecast 2022-2032, USD Million & Quantity in Tons
5.2.2.By Application
5.2.2.1. Combustion and Process Oxygen- Market Insights and Forecast 2022-2032, USD Million & Quantity in Tons
5.2.2.2. Welding and Metal Fabrication- Market Insights and Forecast 2022-2032, USD Million & Quantity in Tons
5.2.2.3. Inerting Blanketing and Heat Treating- Market Insights and Forecast 2022-2032, USD Million & Quantity in Tons
5.2.2.4. Cryogenics and liquefaction- Market Insights and Forecast 2022-2032, USD Million & Quantity in Tons
5.2.2.5. Chemical Synthesis and Hydrogenation- Market Insights and Forecast 2022-2032, USD Million & Quantity in Tons
5.2.2.6. Purging and Purifications- Market Insights and Forecast 2022-2032, USD Million & Quantity in Tons
5.2.2.7. Analytical and Calibration- Market Insights and Forecast 2022-2032, USD Million & Quantity in Tons
5.2.3.By Supply Mode
5.2.3.1. Packaged Gas Supply (Merchant Sales)- Market Insights and Forecast 2022-2032, USD Million & Quantity in Tons
5.2.3.2. Bulk or Liquid Gas Supply- Market Insights and Forecast 2022-2032, USD Million & Quantity in Tons
5.2.3.3. Onsite Generation or Pipeline Supply- Market Insights and Forecast 2022-2032, USD Million & Quantity in Tons
5.2.3.4. Gas-as-a-Service Model- Market Insights and Forecast 2022-2032, USD Million & Quantity in Tons
5.2.4.By End User Industry
5.2.4.1. Oil and Gas- Market Insights and Forecast 2022-2032, USD Million & Quantity in Tons
5.2.4.2. Petrochemicals and Chemicals- Market Insights and Forecast 2022-2032, USD Million & Quantity in Tons
5.2.4.3. Power and Energy- Market Insights and Forecast 2022-2032, USD Million & Quantity in Tons
5.2.4.4. Mining, Steelmaking, Metals- Market Insights and Forecast 2022-2032, USD Million & Quantity in Tons
5.2.4.5. Healthcare- Market Insights and Forecast 2022-2032, USD Million & Quantity in Tons
5.2.4.6. Food and Beverages- Market Insights and Forecast 2022-2032, USD Million & Quantity in Tons
5.2.4.7. Fertilizers- Market Insights and Forecast 2022-2032, USD Million & Quantity in Tons
5.2.4.8. Others- Market Insights and Forecast 2022-2032, USD Million & Quantity in Tons
5.2.5.By Country
5.2.5.1. China
5.2.5.2. India
5.2.5.3. Japan
5.2.5.4. South Korea
5.2.5.5. Australia
5.2.5.6. New Zealand
5.2.5.7. Taiwan
5.2.5.8. Rest of Asia Pacific
5.2.6.By Competitors
5.2.6.1. Competition Characteristics
5.2.6.2. Market Share & Analysis
6. China Industrial Gases Market Statistics, 2022-2032F
6.1. Market Size & Growth Outlook
6.1.1.By Revenues in USD Million
6.1.2.By Quantity Sold in Tons
6.2. Market Segmentation & Growth Outlook
6.2.1.By Gas- Market Insights and Forecast 2022-2032, USD Million & Quantity in Tons
6.2.2.By Application- Market Insights and Forecast 2022-2032, USD Million & Quantity in Tons
6.2.3.By Supply Mode- Market Insights and Forecast 2022-2032, USD Million & Quantity in Tons
6.2.4.By End User Industry- Market Insights and Forecast 2022-2032, USD Million & Quantity in Tons
7. India Industrial Gases Market Statistics, 2022-2032F
7.1. Market Size & Growth Outlook
7.1.1.By Revenues in USD Million
7.1.2.By Quantity Sold in Tons
7.2. Market Segmentation & Growth Outlook
7.2.1.By Gas- Market Insights and Forecast 2022-2032, USD Million & Quantity in Tons
7.2.2.By Application- Market Insights and Forecast 2022-2032, USD Million & Quantity in Tons
7.2.3.By Supply Mode- Market Insights and Forecast 2022-2032, USD Million & Quantity in Tons
7.2.4.By End User Industry- Market Insights and Forecast 2022-2032, USD Million & Quantity in Tons
8. Japan Industrial Gases Market Statistics, 2022-2032F
8.1. Market Size & Growth Outlook
8.1.1.By Revenues in USD Million
8.1.2.By Quantity Sold in Tons
8.2. Market Segmentation & Growth Outlook
8.2.1.By Gas- Market Insights and Forecast 2022-2032, USD Million & Quantity in Tons
8.2.2.By Application- Market Insights and Forecast 2022-2032, USD Million & Quantity in Tons
8.2.3.By Supply Mode- Market Insights and Forecast 2022-2032, USD Million & Quantity in Tons
8.2.4.By End User Industry- Market Insights and Forecast 2022-2032, USD Million & Quantity in Tons
9. South Korea Industrial Gases Market Statistics, 2022-2032F
9.1. Market Size & Growth Outlook
9.1.1.By Revenues in USD Million
9.1.2.By Quantity Sold in Tons
9.2. Market Segmentation & Growth Outlook
9.2.1.By Gas- Market Insights and Forecast 2022-2032, USD Million & Quantity in Tons
9.2.2.By Application- Market Insights and Forecast 2022-2032, USD Million & Quantity in Tons
9.2.3.By Supply Mode- Market Insights and Forecast 2022-2032, USD Million & Quantity in Tons
9.2.4.By End User Industry- Market Insights and Forecast 2022-2032, USD Million & Quantity in Tons
10. Australia Industrial Gases Market Statistics, 2022-2032F
10.1. Market Size & Growth Outlook
10.1.1. By Revenues in USD Million
10.1.2. By Quantity Sold in Tons
10.2. Market Segmentation & Growth Outlook
10.2.1. By Gas- Market Insights and Forecast 2022-2032, USD Million & Quantity in Tons
10.2.2. By Application- Market Insights and Forecast 2022-2032, USD Million & Quantity in Tons
10.2.3. By Supply Mode- Market Insights and Forecast 2022-2032, USD Million & Quantity in Tons
10.2.4. By End User Industry- Market Insights and Forecast 2022-2032, USD Million & Quantity in Tons
11. New Zealand Industrial Gases Market Statistics, 2022-2032F
11.1. Market Size & Growth Outlook
11.1.1. By Revenues in USD Million
11.1.2. By Quantity Sold in Tons
11.2. Market Segmentation & Growth Outlook
11.2.1. By Gas- Market Insights and Forecast 2022-2032, USD Million & Quantity in Tons
11.2.2. By Application- Market Insights and Forecast 2022-2032, USD Million & Quantity in Tons
11.2.3. By Supply Mode- Market Insights and Forecast 2022-2032, USD Million & Quantity in Tons
11.2.4. By End User Industry- Market Insights and Forecast 2022-2032, USD Million & Quantity in Tons
12. Taiwan Industrial Gases Market Statistics, 2022-2032F
12.1. Market Size & Growth Outlook
12.1.1. By Revenues in USD Million
12.1.2. By Quantity Sold in Tons
12.2. Market Segmentation & Growth Outlook
12.2.1. By Gas- Market Insights and Forecast 2022-2032, USD Million & Quantity in Tons
12.2.2. By Application- Market Insights and Forecast 2022-2032, USD Million & Quantity in Tons
12.2.3. By Supply Mode- Market Insights and Forecast 2022-2032, USD Million & Quantity in Tons
12.2.4. By End User Industry- Market Insights and Forecast 2022-2032, USD Million & Quantity in Tons
13. Competitive Outlook
13.1. Company Profiles
13.1.1. Air Liquide
13.1.1.1. Business Description
13.1.1.2. Product Portfolio
13.1.1.3. Collaborations & Alliances
13.1.1.4. Recent Developments
13.1.1.5. Financial Details
13.1.1.6. Others
13.1.2. Air Products and Chemicals Inc.
13.1.2.1. Business Description
13.1.2.2. Product Portfolio
13.1.2.3. Collaborations & Alliances
13.1.2.4. Recent Developments
13.1.2.5. Financial Details
13.1.2.6. Others
13.1.3. Asia Technical Gas Co Pte Ltd
13.1.3.1. Business Description
13.1.3.2. Product Portfolio
13.1.3.3. Collaborations & Alliances
13.1.3.4. Recent Developments
13.1.3.5. Financial Details
13.1.3.6. Others
13.1.4. Yingde Gases Shanghai
13.1.4.1. Business Description
13.1.4.2. Product Portfolio
13.1.4.3. Collaborations & Alliances
13.1.4.4. Recent Developments
13.1.4.5. Financial Details
13.1.4.6. Others
13.1.5. Bhuruka Gases Ltd
13.1.5.1. Business Description
13.1.5.2. Product Portfolio
13.1.5.3. Collaborations & Alliances
13.1.5.4. Recent Developments
13.1.5.5. Financial Details
13.1.5.6. Others
13.1.6. Goyal MG Gases Pvt Ltd
13.1.6.1. Business Description
13.1.6.2. Product Portfolio
13.1.6.3. Collaborations & Alliances
13.1.6.4. Recent Developments
13.1.6.5. Financial Details
13.1.6.6. Others
13.1.7. Hangzhou Oxygen Plant Group Co Ltd (Hangyang)
13.1.7.1. Business Description
13.1.7.2. Product Portfolio
13.1.7.3. Collaborations & Alliances
13.1.7.4. Recent Developments
13.1.7.5. Financial Details
13.1.7.6. Others
13.1.8. Iwatani Corporation
13.1.8.1. Business Description
13.1.8.2. Product Portfolio
13.1.8.3. Collaborations & Alliances
13.1.8.4. Recent Developments
13.1.8.5. Financial Details
13.1.8.6. Others
13.1.9. Linde plc
13.1.9.1. Business Description
13.1.9.2. Product Portfolio
13.1.9.3. Collaborations & Alliances
13.1.9.4. Recent Developments
13.1.9.5. Financial Details
13.1.9.6. Others
14. Disclaimer
| Segment | Sub-Segment |
|---|---|
| By Gas |
|
| By Application |
|
| By Supply Mode |
|
| By End User Industry |
|
| By Country |
|
Research Methodology
This study followed a structured approach comprising four key phases to assess the size and scope of the electro-oxidation market. The process began with thorough secondary research to collect data on the target market, related markets, and broader industry context. These findings, along with preliminary assumptions and estimates, were then validated through extensive primary research involving industry experts from across the value chain. To calculate the overall market size, both top-down and bottom-up methodologies were employed. Finally, market segmentation and data triangulation techniques were applied to refine and validate segment-level estimations.
Secondary Research
The secondary research phase involved gathering data from a wide range of credible and published sources. This step helped in identifying industry trends, defining market segmentation, and understanding the market landscape and value chain.
Sources consulted during this phase included:
- Company annual reports, investor presentations, and press releases
- Industry white papers and certified publications
- Trade directories and market-recognized databases
- Articles from authoritative authors and reputable journals
- Gold and silver standard websites
Secondary research was critical in mapping out the industry's value chain and monetary flow, identifying key market segments, understanding regional variations, and tracking significant industry developments.
Other key sources:
- Financial disclosures
- Industry associations and trade bodies
- News outlets and business magazines
- Academic journals and research studies
- Paid industry databases
Primary Research
To validate secondary data and gain deeper market insights, primary research was conducted with key stakeholders across both the supply and demand sides of the market.
On the demand side, participants included decision-makers and influencers from end-user industries—such as CIOs, CTOs, and CSOs—who provided first-hand perspectives on market needs, product usage, and future expectations.
On the supply side, interviews were conducted with manufacturers, industry associations, and institutional participants to gather insights into current offerings, product pipelines, and market challenges.
Primary interviews provided critical inputs such as:
- Market size and revenue data
- Product and service breakdowns
- Market forecasts
- Regional and application-specific trends
Stakeholders consulted included:
- Leading OEM and solution providers
- Channel and distribution partners
- End users across various applications
- Independent consultants and industry specialists
Market Size Estimation and Data Triangulation
- Identifying Key Market Participants (Secondary Research)
- Goal: To identify the major players or companies in the target market. This typically involves using publicly available data sources such as industry reports, market research publications, and financial statements of companies.
- Tools: Reports from firms like Gartner, Forrester, Euromonitor, Statista, IBISWorld, and others. Public financial statements, news articles, and press releases from top market players.
- Extracting Earnings of Key Market Participants
- Goal: To estimate the earnings generated from the product or service being analyzed. This step helps in understanding the revenue potential of each market player in a specific geography.
- Methods: Earnings data can be gathered from:
- Publicly available financial reports (for listed companies).
- Interviews and primary data sources from professionals, such as Directors, VPs, SVPs, etc. This is especially useful for understanding more nuanced, internal data that isn't publicly disclosed.
- Annual reports and investor presentations of key players.
- Data Collation and Development of a Relevant Data Model
- Goal: To collate inputs from both primary and secondary sources into a structured, data-driven model for market estimation. This model will incorporate key market KPIs and any independent variables relevant to the market.
- Key KPIs: These could include:
- Market size, growth rate, and demand drivers.
- Industry-specific metrics like market share, average revenue per customer (ARPC), or average deal size.
- External variables, such as economic growth rates, inflation rates, or commodity prices, that could affect the market.
- Data Modeling: Based on this data, the market forecasts are developed for the next 5 years. A combination of trend analysis, scenario modeling, and statistical regression might be used to generate projections.
- Scenario Analysis
- Goal: To test different assumptions and validate how sensitive the market is to changes in key variables (e.g., market demand, regulatory changes, technological disruptions).
- Types of Scenarios:
- Base Case: Based on current assumptions and historical data.
- Best-Case Scenario: Assuming favorable market conditions, regulatory environments, and technological advancements.
- Worst-Case Scenario: Accounting for adverse factors, such as economic downturns, stricter regulations, or unexpected disruptions.


