Australia Sports Nutrition Market Report: Trends, Growth and Forecast (2026-2032)
Product Type (Sports Protein Products (Protein/Energy Bars, Sports Protein Powder, Sports Protein RTD), Sports Non-Protein Products), Sales Channel (Retail Offline, Retail Online), Ingredients (Vitamins and Minerals, Proteins and Amino Acids, Carbohydrates, Probiotics, Botanicals/Herbals, Others), Functionality (Energy, Muscle growth, Hydration, Weight Management, Others), End User (Bodybuilders, Athletes, Lifestyle Users) ... Read more
|
Major Players
|
Australia Sports Nutrition Market Statistics and Insights, 2026
- Market Size Statistics
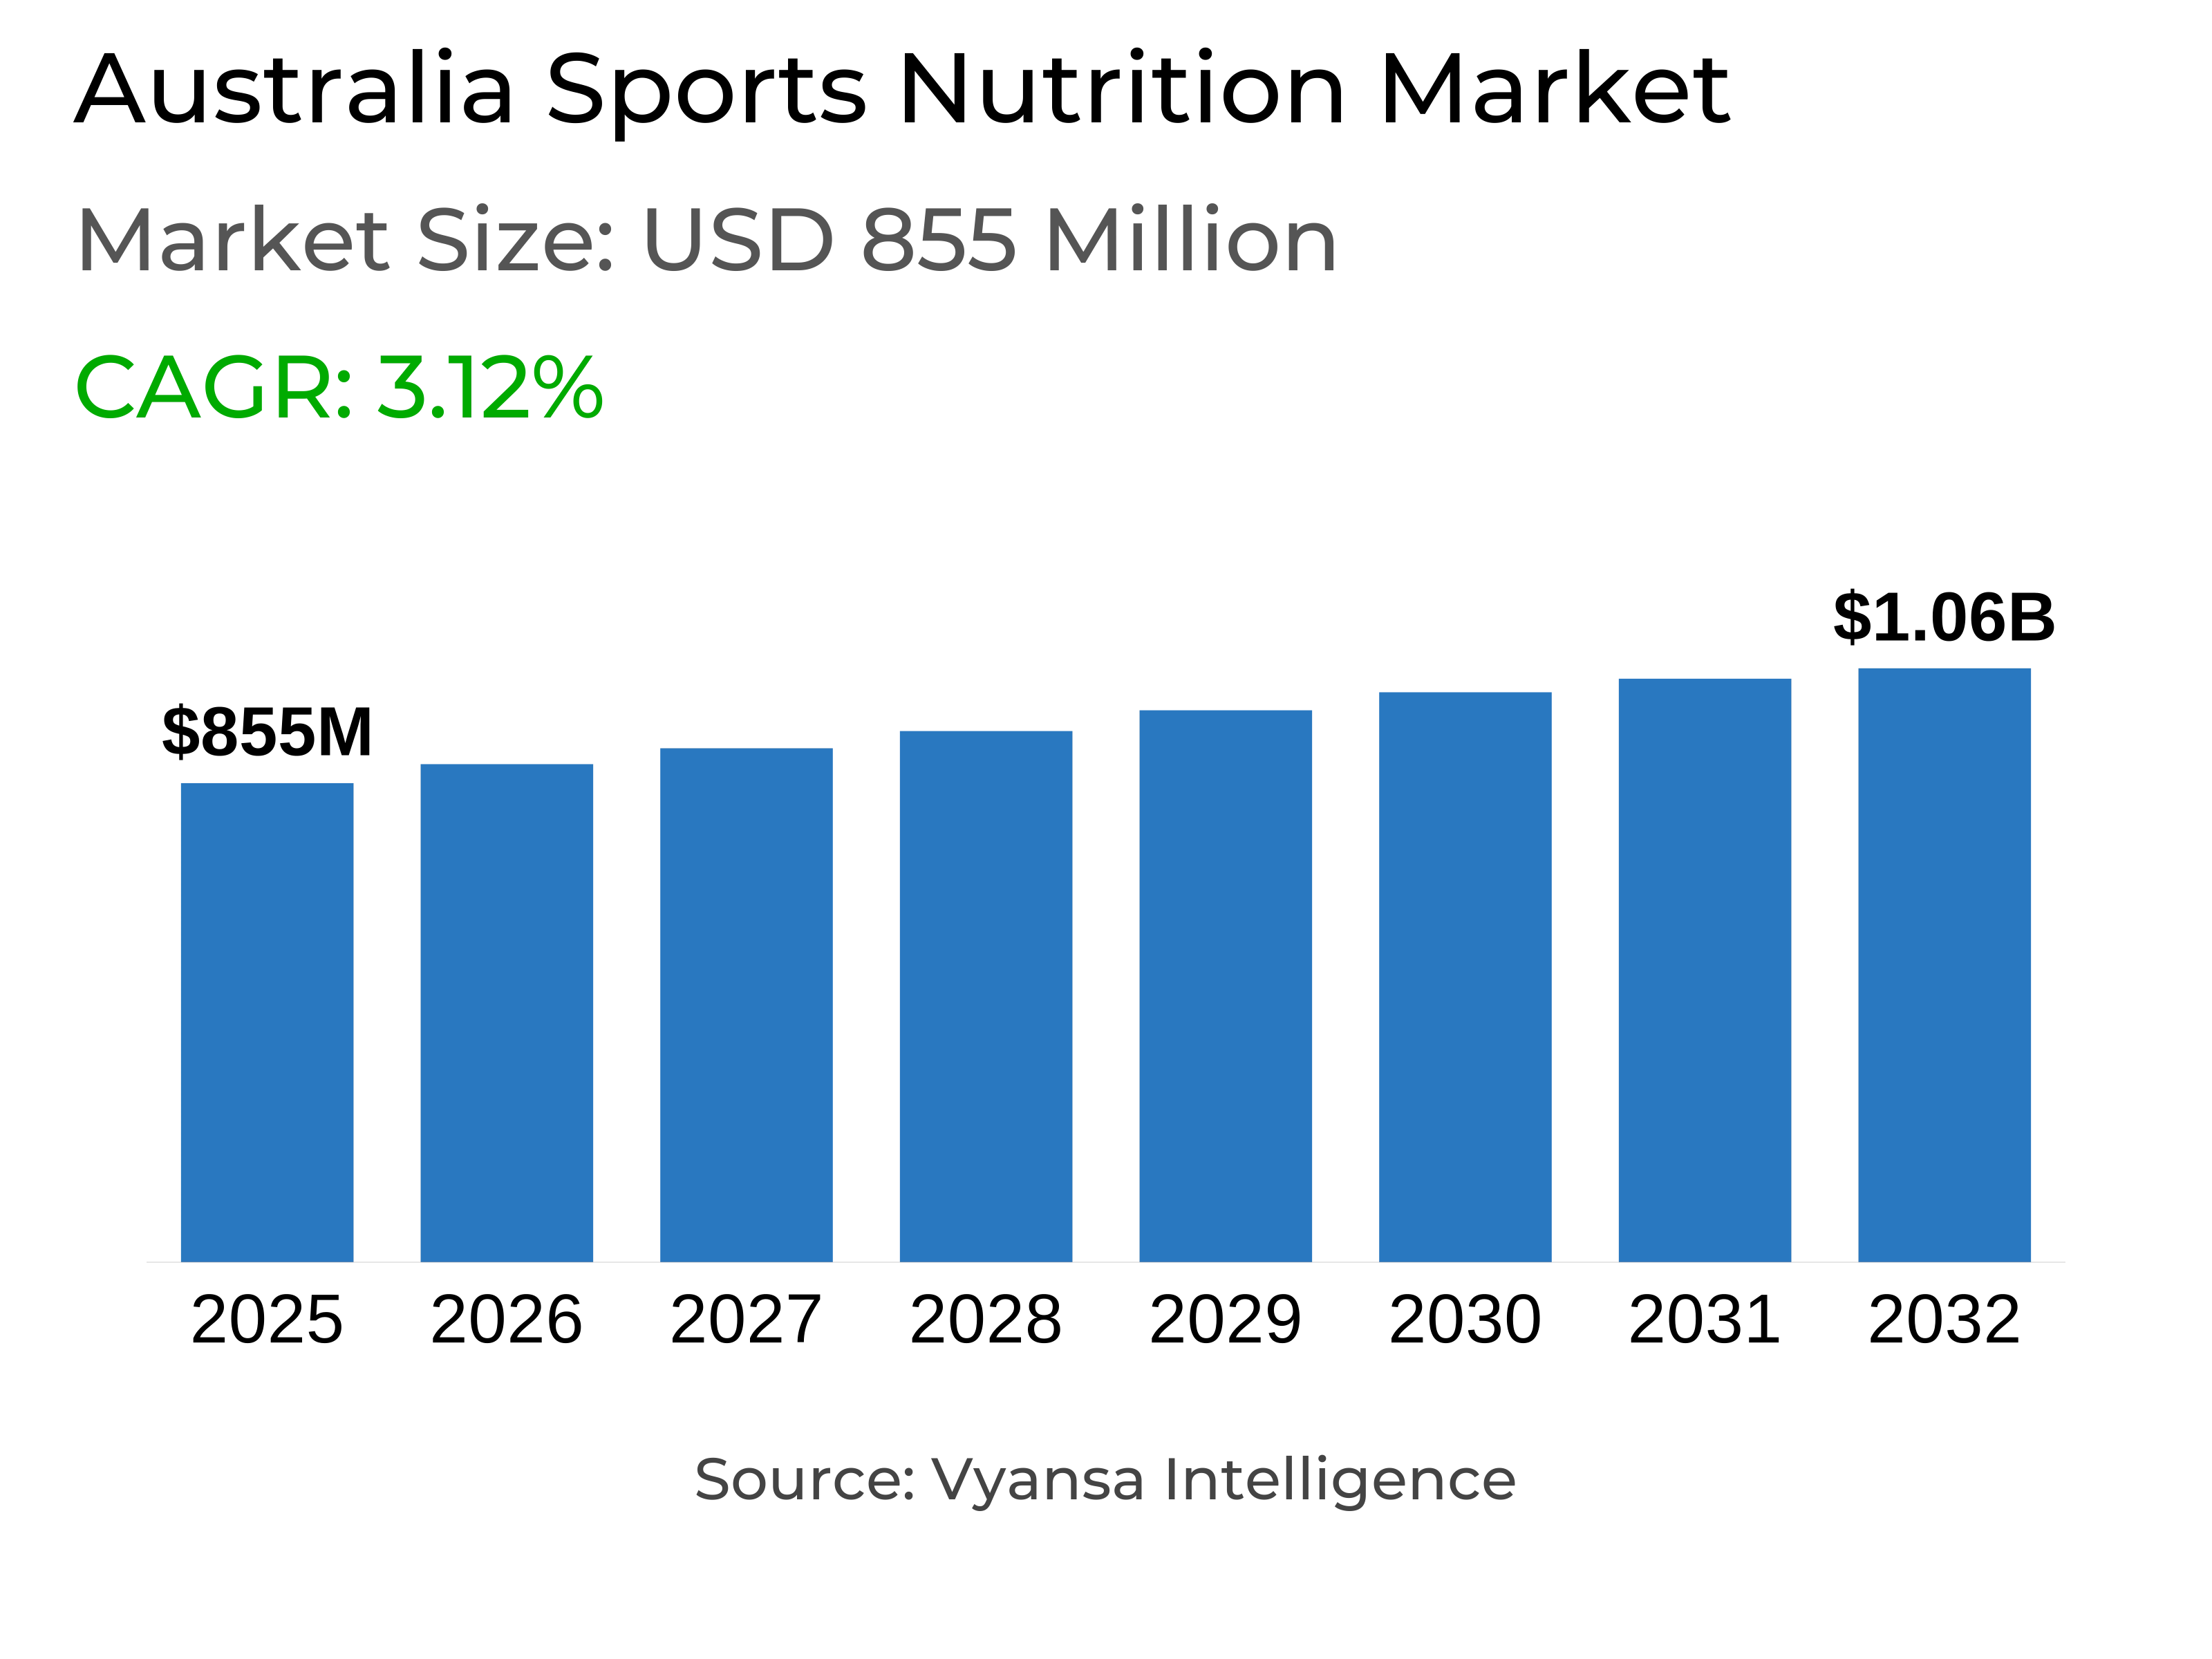
- Sports nutrition in australia is estimated at $ 855 million.
- The market size is expected to grow to $ 1.06 billion by 2032.
- Market to register a cagr of around 3.12% during 2026-32.
- Product Type Shares
- Sports protein products grabbed market share of 70%.
- Competition
- More than 20 companies are actively engaged in producing sports nutrition in australia.
- Top 5 companies acquired around 20% of the market share.
- International Protein Pty Ltd, Iovate Health Sciences Australia PTY Ltd, Bounce Foods Ltd, Vitaco Health Australia Pty Ltd, Nutrition Systems etc., are few of the top companies.
- Sales Channel
- Retail offline grabbed 70% of the market.
Australia Sports Nutrition Market Outlook
The sports nutrition market in Australia, is worth around USD 855 million in 2025, is projected to reach around USD 1.06 billion by 2032 with a growing CAGR of around 3.12% from 2026–32. Such growth indicates the growing adoption of sports nutrition in daily life, fueled by increased emphasis on fitness, muscle recovery, and active lifestyles. Originally limited to professional athletes, these products are now been adopted by wider end users that also includes fitness enthusiasts, working professionals, and elderly persons who desire to stay energetic and healthy.
The increasing trend of fitness culture continues to drive this growth. As per AusPlay, close to around 78% of Australians aged 15 and above engage in sport or physical activity at least once a week during 2022–23, reflecting a country wide trend toward healthier living. This active usage has encouraged greater awareness for nutrition and the contribution of protein based products in fueling endurance and recovery.
Sports nutrition market is moderately concentrated with the top five companies accounting for around 20% of total market share. Both domestic and international brands are constantly innovating new tastes, package formats, and functional formulations to capture developing segments. The increasing number of specialized brands specifically targeting market areas like women's fitness, hydration, and vegan nutrition further increases competition in the market while providing more personal choices to end users.
Retail offline channels dominate with around 70% under sales channel, supported by widespread networks of supermarkets, pharmacies, and specialist stores. End users still rely on these channels for product guarantees, expert advice, and ease of access. Product promotions, in store sampling, and better shelf presence fuel impulse and repeat buying. Although retail online is slowly increasing, the availability and trust involved in retail offline guarantee it as the primary segment maintaining market traction.

Australia Sports Nutrition Market Growth DriverActive Lifestyle Fuels Demand for High Protein Products
An increasing focus on enhancing general health and fitness is encouraging end users to indulge in regular sport and include balanced nutrition as a part of their routine. As per AusPlay, around 78% of Australians aged 15 years and above participated in sport or physical activity every week during 2022–2023, demonstrating a high national inclination toward active living. End users are increasingly driven by purposes like enjoyment, physical wellness, and mental health which continue to build interest in sports nutrition.
While sports nutrition previously was primarily directed towards athletes and weight trainers, its end user market is regularly expanding. For achieving better results, general end users are now using protein based products to maintain health fitness. As awareness for the role of sports protein in everyday diet increases, demand for high quality, easy to consume formulations keeps rising, driving more robust market engagement by a broader population.
Australia Sports Nutrition Market ChallengeRising Living Costs Slows Market Growth
Expensive living is making it increasingly difficult for end users to afford sports nutrition products. As daily expenses are increasing , end users are reducing the purchase of non essential protein products and opting for less expensive protein sources such as eggs, tofu, chicken, and milk. This tendency is decelerating sales of protein powders, shakes, and bars, which had been increasing rapidly previously.
End users are also modifying the way they shop. Some opt for big packs to reduce cost per serve, still the greater initial cost tends to restrict frequency of purchase. Others opt for single serve beverages or bars, which are perceived as cheaper but cost more overall. These spending restrictions are putting pressure on both sales quantity and profitability. As domestic budgets are still constrained, growth in the market continues to be restricted, and it is hard for brands to maintain consistent momentum.
Unlock Market Intelligence
Explore the market potential with our data-driven report
Australia Sports Nutrition Market TrendIncreased Emphasis on Women's Wellness in Sports Nutrition
A clear shift is underway as the field of sports nutrition changes from a traditionally male centric interest to female specific products. End users are showing interested in products that supports in their biological and performance enhancements, with products enriched with protein, iron, calcium, and electrolytes to support recovery, hydration, and strength.
This shift indicates growing interest for multifunctional products that offer the combined benefits for health, beauty, and wellness. Ingredients like creatine, and biotin are becoming more popular due to their abilities to promote skin, muscle, and energy levels. Increased focus on lifestyle empowerment and holistic health is redefining consumption patterns, encouraging brands to create products that match women's health concerns and busy lifestyles. Increasing awareness and engagement among women continues to unlock new growth opportunities for the market.
Australia Sports Nutrition Market OpportunityProtein Water Emerging as a Future Growth Pathway
The increasing focus on protein water is creating a solid path for growth in sports nutrition market. The greater emphasis on light, refreshing, and low calorie products is attracting new end users who previously stayed away from heavy protein shakes. The ongoing product innovation mixing protein with collagen, electrolytes, and other nutrients is fueling new health objectives like hydration, recovery, and skin health.
Additionally increasing understanding of high protein diets and improved recovery after exercise is expanding the target group from athletes to gym going and health focused end users. The convenience of using protein water as a daily drink is building connections between sports nutrition and mainstream wellness. The segment has strong potential to support diversification and future value growth across the market.
Unlock Market Intelligence
Explore the market potential with our data-driven report
Australia Sports Nutrition Market Segmentation Analysis

By Product Type
- Sports Protein Products
- Sports Non-Protein Products
Sports Protein Products accounts for around 70% of sports nutrition sales in 2025, making them the fastest growing product segment. The high demand from end users like bodybuilders, athletes, and fitness enthusiasts pursuing muscle recovery, strength gain, and overall health is driving the success for this segment. Within sports protein products, protein powders are the most popular format, followed by protein and energy bars and ready to drink (RTD) liquids, appreciated for their convenience and nutritional balance.
The increasing demand for protein based supplements is reaching beyond sports participants, with working adults, young people, and seniors now adding these products to their daily lives for long term energy and nutrition balance. Ongoing innovations in taste, ingredients, and product forms continue to draw various end users, keeping Sports Protein Products on top of the overall sports nutrition trend.
By Sales Channel
- Retail Offline
- Retail Online
Retail offline segment continues to dominate in the sports nutrition market, accounting for around 70% under the sales channel. End end users still depend on pharmacies, specialty retailers, and supermarket chains like Coles and Woolworths for their sports nutrition purchases. These retailers provide the advantage of physical inspection, personal advice, and immediate availability, building confidence and trust. Promotions, sampling, and shelf visibility further enhances walk in buying, making retail offline the most desired channel for a large segment of end users.
Moreover, retail online sales are also increasing slowly, the convenience and integrity of retail offline maintain this channel in the top position. The combination of accessibility, established company presence, and consistent availability of products makes retail offline the leading sales segment for sports nutrition products.
Top Companies in Australia Sports Nutrition Market
The top companies operating in the market include International Protein Pty Ltd, Iovate Health Sciences Australia PTY Ltd, Bounce Foods Ltd, Vitaco Health Australia Pty Ltd, Nutrition Systems, Glanbia Performance Nutrition Pty Ltd, Freedom Foods Group Ltd, Body Science International Pty Ltd, Amino Active International Pty Ltd, Clif Bar & Co, etc., are the top players operating in the australia sports nutrition market.
Frequently Asked Questions
Related Report
1. Market Segmentation
1.1. Research Scope
1.2. Research Methodology
1.3. Definitions and Assumptions
2. Executive Summary
3. Australia Sports Nutrition Market Policies, Regulations, and Standards
4. Australia Sports Nutrition Market Dynamics
4.1. Growth Factors
4.2. Challenges
4.3. Trends
4.4. Opportunities
5. Australia Sports Nutrition Market Statistics, 2022-2032F
5.1. Market Size & Growth Outlook
5.1.1.By Revenues in US$ Million
5.2. Market Segmentation & Growth Outlook
5.2.1.By Product Type
5.2.1.1. Sports Protein Products- Market Insights and Forecast 2022-2032, USD Million
5.2.1.1.1. Protein/Energy Bars- Market Insights and Forecast 2022-2032, USD Million
5.2.1.1.2. Sports Protein Powder- Market Insights and Forecast 2022-2032, USD Million
5.2.1.1.3. Sports Protein RTD- Market Insights and Forecast 2022-2032, USD Million
5.2.1.2. Sports Non-Protein Products- Market Insights and Forecast 2022-2032, USD Million
5.2.2.By Sales Channel
5.2.2.1. Retail Offline- Market Insights and Forecast 2022-2032, USD Million
5.2.2.2. Retail Online- Market Insights and Forecast 2022-2032, USD Million
5.2.3.By Ingredients
5.2.3.1. Vitamins and Minerals- Market Insights and Forecast 2022-2032, USD Million
5.2.3.2. Proteins and Amino Acids- Market Insights and Forecast 2022-2032, USD Million
5.2.3.3. Carbohydrates- Market Insights and Forecast 2022-2032, USD Million
5.2.3.4. Probiotics- Market Insights and Forecast 2022-2032, USD Million
5.2.3.5. Botanicals/Herbals- Market Insights and Forecast 2022-2032, USD Million
5.2.3.6. Others- Market Insights and Forecast 2022-2032, USD Million
5.2.4.By Functionality
5.2.4.1. Energy- Market Insights and Forecast 2022-2032, USD Million
5.2.4.2. Muscle growth- Market Insights and Forecast 2022-2032, USD Million
5.2.4.3. Hydration- Market Insights and Forecast 2022-2032, USD Million
5.2.4.4. Weight Management- Market Insights and Forecast 2022-2032, USD Million
5.2.4.5. Others- Market Insights and Forecast 2022-2032, USD Million
5.2.5.By End User
5.2.5.1. Bodybuilders- Market Insights and Forecast 2022-2032, USD Million
5.2.5.2. Athletes- Market Insights and Forecast 2022-2032, USD Million
5.2.5.3. Lifestyle Users- Market Insights and Forecast 2022-2032, USD Million
5.2.6.By Competitors
5.2.6.1. Competition Characteristics
5.2.6.2. Market Share & Analysis
6. Australia Protein Products Sports Nutrition Market Statistics, 2022-2032F
6.1. Market Size & Growth Outlook
6.1.1.By Revenues in US$ Million
6.2. Market Segmentation & Growth Outlook
6.2.1.By Sales Channel- Market Insights and Forecast 2022-2032, USD Million
6.2.2.By Ingredients- Market Insights and Forecast 2022-2032, USD Million
6.2.3.By Functionality- Market Insights and Forecast 2022-2032, USD Million
6.2.4.By End User- Market Insights and Forecast 2022-2032, USD Million
7. Australia Non-Protein Products Sports Nutrition Market Statistics, 2022-2032F
7.1. Market Size & Growth Outlook
7.1.1.By Revenues in US$ Million
7.2. Market Segmentation & Growth Outlook
7.2.1.By Sales Channel- Market Insights and Forecast 2022-2032, USD Million
7.2.2.By Ingredients- Market Insights and Forecast 2022-2032, USD Million
7.2.3.By Functionality- Market Insights and Forecast 2022-2032, USD Million
7.2.4.By End User- Market Insights and Forecast 2022-2032, USD Million
8. Competitive Outlook
8.1. Company Profiles
8.1.1.Vitaco Health Australia Pty Ltd
8.1.1.1. Business Description
8.1.1.2. Product Portfolio
8.1.1.3. Collaborations & Alliances
8.1.1.4. Recent Developments
8.1.1.5. Financial Details
8.1.1.6. Others
8.1.2.Nutrition Systems
8.1.2.1. Business Description
8.1.2.2. Product Portfolio
8.1.2.3. Collaborations & Alliances
8.1.2.4. Recent Developments
8.1.2.5. Financial Details
8.1.2.6. Others
8.1.3.Glanbia Performance Nutrition Pty Ltd
8.1.3.1. Business Description
8.1.3.2. Product Portfolio
8.1.3.3. Collaborations & Alliances
8.1.3.4. Recent Developments
8.1.3.5. Financial Details
8.1.3.6. Others
8.1.4.Freedom Foods Group Ltd
8.1.4.1. Business Description
8.1.4.2. Product Portfolio
8.1.4.3. Collaborations & Alliances
8.1.4.4. Recent Developments
8.1.4.5. Financial Details
8.1.4.6. Others
8.1.5.Body Science International Pty Ltd
8.1.5.1. Business Description
8.1.5.2. Product Portfolio
8.1.5.3. Collaborations & Alliances
8.1.5.4. Recent Developments
8.1.5.5. Financial Details
8.1.5.6. Others
8.1.6.International Protein Pty Ltd
8.1.6.1. Business Description
8.1.6.2. Product Portfolio
8.1.6.3. Collaborations & Alliances
8.1.6.4. Recent Developments
8.1.6.5. Financial Details
8.1.6.6. Others
8.1.7.Iovate Health Sciences Australia PTY Ltd
8.1.7.1. Business Description
8.1.7.2. Product Portfolio
8.1.7.3. Collaborations & Alliances
8.1.7.4. Recent Developments
8.1.7.5. Financial Details
8.1.7.6. Others
8.1.8.Bounce Foods Ltd
8.1.8.1. Business Description
8.1.8.2. Product Portfolio
8.1.8.3. Collaborations & Alliances
8.1.8.4. Recent Developments
8.1.8.5. Financial Details
8.1.8.6. Others
8.1.9.Amino Active International Pty Ltd
8.1.9.1. Business Description
8.1.9.2. Product Portfolio
8.1.9.3. Collaborations & Alliances
8.1.9.4. Recent Developments
8.1.9.5. Financial Details
8.1.9.6. Others
8.1.10. Clif Bar & Co
8.1.10.1. Business Description
8.1.10.2. Product Portfolio
8.1.10.3. Collaborations & Alliances
8.1.10.4. Recent Developments
8.1.10.5. Financial Details
8.1.10.6. Others
9. Disclaimer
| Segment | Sub-Segment |
|---|---|
| By Product Type |
|
| By Sales Channel |
|
| By Ingredients |
|
| By Functionality |
|
| By End User |
|
Research Methodology
This study followed a structured approach comprising four key phases to assess the size and scope of the electro-oxidation market. The process began with thorough secondary research to collect data on the target market, related markets, and broader industry context. These findings, along with preliminary assumptions and estimates, were then validated through extensive primary research involving industry experts from across the value chain. To calculate the overall market size, both top-down and bottom-up methodologies were employed. Finally, market segmentation and data triangulation techniques were applied to refine and validate segment-level estimations.
Secondary Research
The secondary research phase involved gathering data from a wide range of credible and published sources. This step helped in identifying industry trends, defining market segmentation, and understanding the market landscape and value chain.
Sources consulted during this phase included:
- Company annual reports, investor presentations, and press releases
- Industry white papers and certified publications
- Trade directories and market-recognized databases
- Articles from authoritative authors and reputable journals
- Gold and silver standard websites
Secondary research was critical in mapping out the industry's value chain and monetary flow, identifying key market segments, understanding regional variations, and tracking significant industry developments.
Other key sources:
- Financial disclosures
- Industry associations and trade bodies
- News outlets and business magazines
- Academic journals and research studies
- Paid industry databases
Primary Research
To validate secondary data and gain deeper market insights, primary research was conducted with key stakeholders across both the supply and demand sides of the market.
On the demand side, participants included decision-makers and influencers from end-user industries—such as CIOs, CTOs, and CSOs—who provided first-hand perspectives on market needs, product usage, and future expectations.
On the supply side, interviews were conducted with manufacturers, industry associations, and institutional participants to gather insights into current offerings, product pipelines, and market challenges.
Primary interviews provided critical inputs such as:
- Market size and revenue data
- Product and service breakdowns
- Market forecasts
- Regional and application-specific trends
Stakeholders consulted included:
- Leading OEM and solution providers
- Channel and distribution partners
- End users across various applications
- Independent consultants and industry specialists
Market Size Estimation and Data Triangulation
- Identifying Key Market Participants (Secondary Research)
- Goal: To identify the major players or companies in the target market. This typically involves using publicly available data sources such as industry reports, market research publications, and financial statements of companies.
- Tools: Reports from firms like Gartner, Forrester, Euromonitor, Statista, IBISWorld, and others. Public financial statements, news articles, and press releases from top market players.
- Extracting Earnings of Key Market Participants
- Goal: To estimate the earnings generated from the product or service being analyzed. This step helps in understanding the revenue potential of each market player in a specific geography.
- Methods: Earnings data can be gathered from:
- Publicly available financial reports (for listed companies).
- Interviews and primary data sources from professionals, such as Directors, VPs, SVPs, etc. This is especially useful for understanding more nuanced, internal data that isn't publicly disclosed.
- Annual reports and investor presentations of key players.
- Data Collation and Development of a Relevant Data Model
- Goal: To collate inputs from both primary and secondary sources into a structured, data-driven model for market estimation. This model will incorporate key market KPIs and any independent variables relevant to the market.
- Key KPIs: These could include:
- Market size, growth rate, and demand drivers.
- Industry-specific metrics like market share, average revenue per customer (ARPC), or average deal size.
- External variables, such as economic growth rates, inflation rates, or commodity prices, that could affect the market.
- Data Modeling: Based on this data, the market forecasts are developed for the next 5 years. A combination of trend analysis, scenario modeling, and statistical regression might be used to generate projections.
- Scenario Analysis
- Goal: To test different assumptions and validate how sensitive the market is to changes in key variables (e.g., market demand, regulatory changes, technological disruptions).
- Types of Scenarios:
- Base Case: Based on current assumptions and historical data.
- Best-Case Scenario: Assuming favorable market conditions, regulatory environments, and technological advancements.
- Worst-Case Scenario: Accounting for adverse factors, such as economic downturns, stricter regulations, or unexpected disruptions.


