Australia Footwear Market Report: Trends, Growth and Forecast (2026-2032)
By Category (Children's Footwear (Infants (0-9 Months) Foot Length (CM) (8.3-8.9, 9.2-9.5, 10.1-10.5), Toddlers (9 Months - 4 Years) Foot Length (CM) (10.8, 11.4-11.7, 12.1-12.7, 13.0-13.3, 14.0-14.3, 14.6-15.2, 15.6-15.9, 16.5), Little Kids (4-7 Years) Foot Length (CM) (16.8, 17.1-17.8, 18.1-18.4, 19.1-19.4, 19.7-20.6, 21.0-21.6), Big Kids (7-12 Years) Foot Length (CM) (21.9, 22.2-23.5, 24.1-24.8)), Women's Footwear (Foot Length (CM) (20.8, 21.3-21.6, 22.2-22.5, 23.0-23.8, 24.1-24.6, 25.1-25.9, 26.2-26.7, 27.6)), Men's Footwear (Foot Length (CM) (23.5, 24.1-24.8, 25.4-25.7, 26.0-26.7, 27.0-27.9, 28.3-28.6, 29.4, 30.2, 31.0-31.8))), By Product Type (Casual, Athletic/Sports, Formal, Others), By Sales Channel (Retail Online, Retail Offline), By Material (Leather, Textile, Rubber, Synthetic, Canvas), By Price (Mass, Premium), By Footwear Type (Shoes (Sneakers, Boots), Sandals & Slippers (Flip-Flops)), By Application (Conventional Footwear (Daily Wear, Work/Office Wear, Outdoor & Adventure, Sports & Fitness, Party/Occasion Wear), Functional/Therapeutic Footwear (Therapeutic/Orthopedic, Medicated Slippers, Acupressure Slippers)), By Region (Queensland, New South Wales, Victoria, South Australia, Others) ... Read more
|
Major Players
|
Australia Footwear Market Statistics and Insights, 2026
- Market Size Statistics
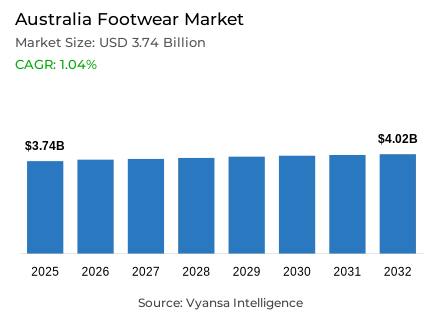
- Footwear in Australia is estimated at USD 3.74 billion in 2025.
- The market size is expected to grow to USD 4.02 billion by 2032.
- Market to register a cagr of around 1.04% during 2026-32.
- Category Shares
- Women’s footwear grabbed market share of 55%.
- Competition
- More than 20 companies are actively engaged in producing footwear in Australia.
- Top 5 companies acquired around 30% of the market share.
- Munro Footwear Group Pty Ltd; Betts Group Pty Ltd; RM Williams Pty Ltd; Nike Australia Pty Ltd; Brand Collective Pty Ltd etc., are few of the top companies.
- Sales Channel
- Retail offline grabbed 55% of the market.
Australia Footwear Market Outlook
Australia footwear market is anticipated to increase consistently in the period of 2026-32, owing to stable demand and slow growth of value. It is estimated to have a market of around USD 3.74 billion in 2025 and a forecasted market of around USD 4.02 billion in 2032 with a CAGR of approximately 1.04%. The growth will not be high but rather moderate, as the end user will be careful with their spending and will value quality, longevity and usefulness of the shoe instead of replacing it frequently.
According to category, the most significant segment in the footwear market in Australia is the women shoes, as it comprises about 55% of the market. The regular replacement cycles, sensitivity to fashion and the broad selection of styles in all price ranges support demand. The footwear of women remains as the top value sales and the rest of the segments play a secondary role of stabilizing the market in totality. This high ranking is likely to be maintained to 2032, which would mean that footwear by women remain the key in market performance.
In terms of sales channel, retail offline has 55% of the market which demonstrates that physical outlets are still highly significant to shop shoes in Australia. Most end user are still willing to test footwear in-store to be comfortable with its size and fit. Shopping malls, brand outlets and footwear experts are still enjoying supportive foot traffic particularly during family and day to day footwear.
The market will expand in over 2026-32 primarily by the increment of value rather than substantial volumes. The market is going to experience a slow yet steady growth with the market fluctuating between USD 3.74 billion by 2025 and USD 4.02 billion by 2032. The prospects are for a mature market in which consistent demand, high sales of women shoes, and the ongoing success of the offline retail will determine performance in the future until the forecast period.

Australia Footwear Market Growth Driver
Spending Behaviour as a Key Driver
The end user spending behaviour is one of the pillars that affect the Australia footwear market. Overall retail spending has grown modestly, but according to ABS data, spending on clothing, footwear, and accessories fell by 2.5% in April 2025, indicating cautious discretionary spending by households due to broader economic pressures. This shows that while some retail categories remain relatively stable, footwear—often considered discretionary—is highly sensitive to changing household priorities.
end users are placing greater importance on essential services and experiences rather than on goods purchases, which has reduced the frequency of footwear buying. This aligns with national retail trends showing weaker growth in goods compared with services and experiences. As a result, footwear brands and retailers are shifting toward value-focused strategies, offering durable, multipurpose, and competitively priced products that appeal to increasingly selective buyers.
Australia Footwear Market Challenge
Discretionary Spending Weakness in Retail
The footwear market faces a major challenge from the slowdown in discretionary retail spending. ABS retail data show that total retail turnover declined by 0.1% in April 2025, with clothing, footwear, and personal accessories recording notable declines. This reflects cautious spending behaviour during periods of economic uncertainty.
This pattern is most visible in categories traditionally linked to discretionary spending, with footwear sales under pressure as households prioritise necessities and services. Reduced demand for goods makes it difficult to stimulate sales of items seen as non-essential, forcing brands and retailers to strengthen value propositions, promotions, and omnichannel convenience to retain end user interest.
Unlock Market Intelligence
Explore the market potential with our data-driven report
Australia Footwear Market Trend
Expansion of Retail Online and Omnichannel Retailing
The Australia footwear market is witnessing a strong shift toward online retailing, which is increasingly shaping purchasing behaviour and overall market dynamics On a seasonally adjusted basis, online retail sales reached AUD 4,703.8 million in June 2025, and through-the-year online sales rose by 13.0%, according to ABS. This shows steady end user migration toward digital shopping platforms. Online retail is becoming increasingly complementary to physical stores by offering greater convenience and choice.
Although physical retail remains important, online sales accounted for about 11.5% of total retail turnover in February 2025, which is especially meaningful for non-food categories like footwear. This has encouraged footwear brands to strengthen omnichannel strategies that combine store experiences with digital tools such as click-and-collect and virtual displays. Government data confirm a structural shift in buying behaviour where flexibility and convenience are becoming central to retail dynamics.
Australia Footwear Market Opportunity
Sustainability and Quality-Driven Consumption
A key opportunity for the Australia footwear industry is the growing focus on sustainability and quality. As shoppers become more discerning, demand is rising for footwear that offers durability, environmentally responsible materials, and ethical production. Brands that embed sustainability authentically into product design and company values can differentiate themselves and gain share among conscious end users.
This move toward mindful spending is linked to lifestyle trends that favour quality and longevity over fast-fashion cycles. Heritage and premium brands that highlight craftsmanship and sustainability are increasingly attractive to end users seeking long-term value and lower environmental impact. These segments represent growth opportunities for brands that clearly communicate sustainability and quality benefits.
Unlock Market Intelligence
Explore the market potential with our data-driven report
Australia Footwear Market Segmentation Analysis
By Category
- Children's Footwear
- Infants (0-9 Months) Foot Length (CM)
- 8.3-8.9
- 9.2-9.5
- 10.1-10.5
- Toddlers (9 Months - 4 Years) Foot Length (CM)
- 10.8
- 11.4-11.7
- 12.1-12.7
- 13.0-13.3
- 14.0-14.3
- 14.6-15.2
- 15.6-15.9
- 16.5
- Little Kids (4-7 Years) Foot Length (CM)
- 16.8
- 17.1-17.8
- 18.1-18.4
- 19.1-19.4
- 19.7-20.6
- 21.0-21.6
- Big Kids (7-12 Years) Foot Length (CM)
- 21.9
- 22.2-23.5
- 24.1-24.8
- Infants (0-9 Months) Foot Length (CM)
- Women's Footwear
- Foot Length (CM)
- 20.8
- 21.3-21.6
- 22.2-22.5
- 23.0-23.8
- 24.1-24.6
- 25.1-25.9
- 26.2-26.7
- 27.6
- Foot Length (CM)
- Men's Footwear
- Foot Length (CM)
- 23.5
- 24.1-24.8
- 25.4-25.7
- 26.0-26.7
- 27.0-27.9
- 28.3-28.6
- 29.4
- 30.2
- 31.0-31.8
- Foot Length (CM)
The category with the highest share is Women’s Footwear, accounting for about 55% of the Australia footwear market. This dominance is driven by strong interest in fashion, lifestyle, and versatile styles that suit casual, sport-inspired, and smart-casual use. The large share highlights the category’s importance to total market value.
Women’s footwear benefits from strong engagement across both physical and online retail, where seasonal trends, influencers, and fashion cycles shape buying behaviour. Its leadership shows the importance of trend-driven design and innovation.

By Sales Channel
- Retail Online
- Retail Offline
Retail Offline is the leading sales channel, representing around 55% of total market sales. Physical stores—such as footwear specialists, chain retailers, and department stores—remain central because they allow fitting, quality assessment, and immediate purchase.
Offline retail also supports deeper engagement through personalised service and in-store experience. While end user is expanding, physical retail remains a foundation of footwear sales across Australia.
List of Companies Covered in Australia Footwear Market
The companies listed below are highly influential in the Australia footwear market, with a significant market share and a strong impact on industry developments.
- Munro Footwear Group Pty Ltd
- Betts Group Pty Ltd
- RM Williams Pty Ltd
- Nike Australia Pty Ltd
- Brand Collective Pty Ltd
- Asics Oceania Pty Ltd
- adidas Australia Pty Ltd
- Accent Group Ltd
- Puma Australia Pty Ltd
- Roadget Business Pte Ltd
Competitive Landscape
Australia footwear market is led by sports and lifestyle giants such as Nike Australia, Asics Oceania, and adidas Australia, which dominate through strong brand equity, performance positioning, and major event partnerships like the Paris 2024 Olympics. Asics strengthened visibility through Olympic-linked collections and community campaigns, while adidas and Nike continue to build influence via omnichannel and direct-to-consumer strategies. Multi-brand groups such as Brand Collective, Munro Footwear Group, Betts Group, and Accent Group play a major role by combining distributed international labels with proprietary brands and large retail networks. At the same time, local brands like Twoobs are gaining attention through sustainability-led design, targeting younger consumers with eco-friendly, comfort-driven footwear concepts.
Frequently Asked Questions
Related Report
1. Market Segmentation
1.1. Research Scope
1.2. Research Methodology
1.3. Definitions and Assumptions
2. Executive Summary
3. Australia Footwear Market Policies, Regulations, and Standards
4. Australia Footwear Market Dynamics
4.1. Growth Factors
4.2. Challenges
4.3. Trends
4.4. Opportunities
5. Australia Footwear Market Statistics, 2022-2032F
5.1. Market Size & Growth Outlook
5.1.1.By Revenues in USD Million
5.1.2.By Units Sold in Thousand Units
5.2. Market Segmentation & Growth Outlook
5.2.1.By Category
5.2.1.1. Children's Footwear- Market Insights and Forecast 2022-2032, USD Million
5.2.1.1.1. Infants (0-9 Months) Foot Length (CM)- Market Insights and Forecast 2022-2032, USD Million
5.2.1.1.1.1. 8.3-8.9- Market Insights and Forecast 2022-2032, USD Million
5.2.1.1.1.2. 9.2-9.5- Market Insights and Forecast 2022-2032, USD Million
5.2.1.1.1.3. 10.1-10.5- Market Insights and Forecast 2022-2032, USD Million
5.2.1.1.2. Toddlers (9 Months - 4 Years) Foot Length (CM)- Market Insights and Forecast 2022-2032, USD Million
5.2.1.1.2.1. 10.8- Market Insights and Forecast 2022-2032, USD Million
5.2.1.1.2.2. 11.4-11.7- Market Insights and Forecast 2022-2032, USD Million
5.2.1.1.2.3. 12.1-12.7- Market Insights and Forecast 2022-2032, USD Million
5.2.1.1.2.4. 13.0-13.3- Market Insights and Forecast 2022-2032, USD Million
5.2.1.1.2.5. 14.0-14.3- Market Insights and Forecast 2022-2032, USD Million
5.2.1.1.2.6. 14.6-15.2- Market Insights and Forecast 2022-2032, USD Million
5.2.1.1.2.7. 15.6-15.9- Market Insights and Forecast 2022-2032, USD Million
5.2.1.1.2.8. 16.5- Market Insights and Forecast 2022-2032, USD Million
5.2.1.1.3. Little Kids (4-7 Years) Foot Length (CM)- Market Insights and Forecast 2022-2032, USD Million
5.2.1.1.3.1. 16.8- Market Insights and Forecast 2022-2032, USD Million
5.2.1.1.3.2. 17.1-17.8- Market Insights and Forecast 2022-2032, USD Million
5.2.1.1.3.3. 18.1-18.4- Market Insights and Forecast 2022-2032, USD Million
5.2.1.1.3.4. 19.1-19.4- Market Insights and Forecast 2022-2032, USD Million
5.2.1.1.3.5. 19.7-20.6- Market Insights and Forecast 2022-2032, USD Million
5.2.1.1.3.6. 21.0-21.6- Market Insights and Forecast 2022-2032, USD Million
5.2.1.1.4. Big Kids (7-12 Years) Foot Length (CM)- Market Insights and Forecast 2022-2032, USD Million
5.2.1.1.4.1. 21.9- Market Insights and Forecast 2022-2032, USD Million
5.2.1.1.4.2. 22.2-23.5- Market Insights and Forecast 2022-2032, USD Million
5.2.1.1.4.3. 24.1-24.8- Market Insights and Forecast 2022-2032, USD Million
5.2.1.2. Women's Footwear- Market Insights and Forecast 2022-2032, USD Million
5.2.1.2.1. Foot Length (CM)- Market Insights and Forecast 2022-2032, USD Million
5.2.1.2.1.1. 20.8- Market Insights and Forecast 2022-2032, USD Million
5.2.1.2.1.2. 21.3-21.6- Market Insights and Forecast 2022-2032, USD Million
5.2.1.2.1.3. 22.2-22.5- Market Insights and Forecast 2022-2032, USD Million
5.2.1.2.1.4. 23.0-23.8- Market Insights and Forecast 2022-2032, USD Million
5.2.1.2.1.5. 24.1-24.6- Market Insights and Forecast 2022-2032, USD Million
5.2.1.2.1.6. 25.1-25.9- Market Insights and Forecast 2022-2032, USD Million
5.2.1.2.1.7. 26.2-26.7- Market Insights and Forecast 2022-2032, USD Million
5.2.1.2.1.8. 27.6- Market Insights and Forecast 2022-2032, USD Million
5.2.1.3. Men's Footwear- Market Insights and Forecast 2022-2032, USD Million
5.2.1.3.1. Foot Length (CM)- Market Insights and Forecast 2022-2032, USD Million
5.2.1.3.1.1. 23.5- Market Insights and Forecast 2022-2032, USD Million
5.2.1.3.1.2. 24.1-24.8- Market Insights and Forecast 2022-2032, USD Million
5.2.1.3.1.3. 25.4-25.7- Market Insights and Forecast 2022-2032, USD Million
5.2.1.3.1.4. 26.0-26.7- Market Insights and Forecast 2022-2032, USD Million
5.2.1.3.1.5. 27.0-27.9- Market Insights and Forecast 2022-2032, USD Million
5.2.1.3.1.6. 28.3-28.6- Market Insights and Forecast 2022-2032, USD Million
5.2.1.3.1.7. 29.4- Market Insights and Forecast 2022-2032, USD Million
5.2.1.3.1.8. 30.2- Market Insights and Forecast 2022-2032, USD Million
5.2.1.3.1.9. 31.0-31.8- Market Insights and Forecast 2022-2032, USD Million
5.2.2.By Product Type
5.2.2.1. Casual- Market Insights and Forecast 2022-2032, USD Million
5.2.2.2. Athletic/Sports- Market Insights and Forecast 2022-2032, USD Million
5.2.2.3. Formal- Market Insights and Forecast 2022-2032, USD Million
5.2.2.4. Others- Market Insights and Forecast 2022-2032, USD Million
5.2.3.By Sales Channel
5.2.3.1. Retail Online- Market Insights and Forecast 2022-2032, USD Million
5.2.3.2. Retail Offline- Market Insights and Forecast 2022-2032, USD Million
5.2.4.By Material
5.2.4.1. Leather- Market Insights and Forecast 2022-2032, USD Million
5.2.4.2. Textile- Market Insights and Forecast 2022-2032, USD Million
5.2.4.3. Rubber- Market Insights and Forecast 2022-2032, USD Million
5.2.4.4. Synthetic- Market Insights and Forecast 2022-2032, USD Million
5.2.4.5. Canvas- Market Insights and Forecast 2022-2032, USD Million
5.2.5.By Price
5.2.5.1. Mass- Market Insights and Forecast 2022-2032, USD Million
5.2.5.2. Premium- Market Insights and Forecast 2022-2032, USD Million
5.2.6.By Footwear Type
5.2.6.1. Shoes- Market Insights and Forecast 2022-2032, USD Million
5.2.6.1.1. Sneakers- Market Insights and Forecast 2022-2032, USD Million
5.2.6.1.2. Boots- Market Insights and Forecast 2022-2032, USD Million
5.2.6.2. Sandals & Slippers- Market Insights and Forecast 2022-2032, USD Million
5.2.6.2.1. Flip-Flops- Market Insights and Forecast 2022-2032, USD Million
5.2.7.By Application
5.2.7.1. Conventional Footwear- Market Insights and Forecast 2022-2032, USD Million
5.2.7.1.1. Daily Wear- Market Insights and Forecast 2022-2032, USD Million
5.2.7.1.2. Work/Office Wear- Market Insights and Forecast 2022-2032, USD Million
5.2.7.1.3. Outdoor & Adventure- Market Insights and Forecast 2022-2032, USD Million
5.2.7.1.4. Sports & Fitness- Market Insights and Forecast 2022-2032, USD Million
5.2.7.1.5. Party/Occasion Wear- Market Insights and Forecast 2022-2032, USD Million
5.2.7.2. Functional/Therapeutic Footwear- Market Insights and Forecast 2022-2032, USD Million
5.2.7.2.1. Therapeutic/Orthopedic- Market Insights and Forecast 2022-2032, USD Million
5.2.7.2.2. Medicated Slippers- Market Insights and Forecast 2022-2032, USD Million
5.2.7.2.3. Acupressure Slippers- Market Insights and Forecast 2022-2032, USD Million
5.2.8.By Region
5.2.8.1. Queensland
5.2.8.2. New South Wales
5.2.8.3. Victoria
5.2.8.4. South Australia
5.2.8.5. Others
5.2.9.By Competitors
5.2.9.1. Competition Characteristics
5.2.9.2. Market Share & Analysis
6. Australia Children's Footwear Market Statistics, 2022-2032
6.1. Market Size & Growth Outlook
6.1.1.By Revenues in USD Million
6.1.2.By Units Sold in Thousand Units
6.2. Market Segmentation & Growth Outlook
6.2.1.By Category- Market Insights and Forecast 2022-2032, USD Million
6.2.2.By Product Type- Market Insights and Forecast 2022-2032, USD Million
6.2.3.By Sales Channel- Market Insights and Forecast 2022-2032, USD Million
6.2.4.By Material- Market Insights and Forecast 2022-2032, USD Million
6.2.5.By Price- Market Insights and Forecast 2022-2032, USD Million
6.2.6.By Footwear Type- Market Insights and Forecast 2022-2032, USD Million
6.2.7.By Application- Market Insights and Forecast 2022-2032, USD Million
6.2.8.By Region- Market Insights and Forecast 2022-2032, USD Million
7. Australia Women's Footwear Market Statistics, 2022-2032
7.1. Market Size & Growth Outlook
7.1.1.By Revenues in USD Million
7.1.2.By Units Sold in Thousand Units
7.2. Market Segmentation & Growth Outlook
7.2.1.By Category- Market Insights and Forecast 2022-2032, USD Million
7.2.2.By Product Type- Market Insights and Forecast 2022-2032, USD Million
7.2.3.By Sales Channel- Market Insights and Forecast 2022-2032, USD Million
7.2.4.By Material- Market Insights and Forecast 2022-2032, USD Million
7.2.5.By Price- Market Insights and Forecast 2022-2032, USD Million
7.2.6.By Footwear Type- Market Insights and Forecast 2022-2032, USD Million
7.2.7.By Application- Market Insights and Forecast 2022-2032, USD Million
7.2.8.By Region- Market Insights and Forecast 2022-2032, USD Million
8. Australia Men's Footwear Market Statistics, 2022-2032
8.1. Market Size & Growth Outlook
8.1.1.By Revenues in USD Million
8.1.2.By Units Sold in Thousand Units
8.2. Market Segmentation & Growth Outlook
8.2.1.By Category- Market Insights and Forecast 2022-2032, USD Million
8.2.2.By Product Type- Market Insights and Forecast 2022-2032, USD Million
8.2.3.By Sales Channel- Market Insights and Forecast 2022-2032, USD Million
8.2.4.By Material- Market Insights and Forecast 2022-2032, USD Million
8.2.5.By Price- Market Insights and Forecast 2022-2032, USD Million
8.2.6.By Footwear Type- Market Insights and Forecast 2022-2032, USD Million
8.2.7.By Application- Market Insights and Forecast 2022-2032, USD Million
8.2.8.By Region- Market Insights and Forecast 2022-2032, USD Million
9. Competitive Outlook
9.1. Company Profiles
9.1.1.Nike Australia Pty Ltd
9.1.1.1. Business Description
9.1.1.2. Product Portfolio
9.1.1.3. Collaborations & Alliances
9.1.1.4. Recent Developments
9.1.1.5. Financial Details
9.1.1.6. Others
9.1.2.Brand Collective Pty Ltd
9.1.2.1. Business Description
9.1.2.2. Product Portfolio
9.1.2.3. Collaborations & Alliances
9.1.2.4. Recent Developments
9.1.2.5. Financial Details
9.1.2.6. Others
9.1.3.Asics Oceania Pty Ltd
9.1.3.1. Business Description
9.1.3.2. Product Portfolio
9.1.3.3. Collaborations & Alliances
9.1.3.4. Recent Developments
9.1.3.5. Financial Details
9.1.3.6. Others
9.1.4.adidas Australia Pty Ltd
9.1.4.1. Business Description
9.1.4.2. Product Portfolio
9.1.4.3. Collaborations & Alliances
9.1.4.4. Recent Developments
9.1.4.5. Financial Details
9.1.4.6. Others
9.1.5.Accent Group Ltd
9.1.5.1. Business Description
9.1.5.2. Product Portfolio
9.1.5.3. Collaborations & Alliances
9.1.5.4. Recent Developments
9.1.5.5. Financial Details
9.1.5.6. Others
9.1.6.Munro Footwear Group Pty Ltd
9.1.6.1. Business Description
9.1.6.2. Product Portfolio
9.1.6.3. Collaborations & Alliances
9.1.6.4. Recent Developments
9.1.6.5. Financial Details
9.1.6.6. Others
9.1.7.Betts Group Pty Ltd
9.1.7.1. Business Description
9.1.7.2. Product Portfolio
9.1.7.3. Collaborations & Alliances
9.1.7.4. Recent Developments
9.1.7.5. Financial Details
9.1.7.6. Others
9.1.8.RM Williams Pty Ltd
9.1.8.1. Business Description
9.1.8.2. Product Portfolio
9.1.8.3. Collaborations & Alliances
9.1.8.4. Recent Developments
9.1.8.5. Financial Details
9.1.8.6. Others
9.1.9.Puma Australia Pty Ltd
9.1.9.1. Business Description
9.1.9.2. Product Portfolio
9.1.9.3. Collaborations & Alliances
9.1.9.4. Recent Developments
9.1.9.5. Financial Details
9.1.9.6. Others
9.1.10. Roadget Business Pte Ltd
9.1.10.1. Business Description
9.1.10.2. Product Portfolio
9.1.10.3. Collaborations & Alliances
9.1.10.4. Recent Developments
9.1.10.5. Financial Details
9.1.10.6. Others
10. Disclaimer
| Segment | Sub-Segment |
|---|---|
| By Category |
|
| By Product Type |
|
| By Sales Channel |
|
| By Material |
|
| By Price |
|
| By Footwear Type |
|
| By Application |
|
| By Region |
|
Research Methodology
This study followed a structured approach comprising four key phases to assess the size and scope of the electro-oxidation market. The process began with thorough secondary research to collect data on the target market, related markets, and broader industry context. These findings, along with preliminary assumptions and estimates, were then validated through extensive primary research involving industry experts from across the value chain. To calculate the overall market size, both top-down and bottom-up methodologies were employed. Finally, market segmentation and data triangulation techniques were applied to refine and validate segment-level estimations.
Secondary Research
The secondary research phase involved gathering data from a wide range of credible and published sources. This step helped in identifying industry trends, defining market segmentation, and understanding the market landscape and value chain.
Sources consulted during this phase included:
- Company annual reports, investor presentations, and press releases
- Industry white papers and certified publications
- Trade directories and market-recognized databases
- Articles from authoritative authors and reputable journals
- Gold and silver standard websites
Secondary research was critical in mapping out the industry's value chain and monetary flow, identifying key market segments, understanding regional variations, and tracking significant industry developments.
Other key sources:
- Financial disclosures
- Industry associations and trade bodies
- News outlets and business magazines
- Academic journals and research studies
- Paid industry databases
Primary Research
To validate secondary data and gain deeper market insights, primary research was conducted with key stakeholders across both the supply and demand sides of the market.
On the demand side, participants included decision-makers and influencers from end-user industries—such as CIOs, CTOs, and CSOs—who provided first-hand perspectives on market needs, product usage, and future expectations.
On the supply side, interviews were conducted with manufacturers, industry associations, and institutional participants to gather insights into current offerings, product pipelines, and market challenges.
Primary interviews provided critical inputs such as:
- Market size and revenue data
- Product and service breakdowns
- Market forecasts
- Regional and application-specific trends
Stakeholders consulted included:
- Leading OEM and solution providers
- Channel and distribution partners
- End users across various applications
- Independent consultants and industry specialists
Market Size Estimation and Data Triangulation
- Identifying Key Market Participants (Secondary Research)
- Goal: To identify the major players or companies in the target market. This typically involves using publicly available data sources such as industry reports, market research publications, and financial statements of companies.
- Tools: Reports from firms like Gartner, Forrester, Euromonitor, Statista, IBISWorld, and others. Public financial statements, news articles, and press releases from top market players.
- Extracting Earnings of Key Market Participants
- Goal: To estimate the earnings generated from the product or service being analyzed. This step helps in understanding the revenue potential of each market player in a specific geography.
- Methods: Earnings data can be gathered from:
- Publicly available financial reports (for listed companies).
- Interviews and primary data sources from professionals, such as Directors, VPs, SVPs, etc. This is especially useful for understanding more nuanced, internal data that isn't publicly disclosed.
- Annual reports and investor presentations of key players.
- Data Collation and Development of a Relevant Data Model
- Goal: To collate inputs from both primary and secondary sources into a structured, data-driven model for market estimation. This model will incorporate key market KPIs and any independent variables relevant to the market.
- Key KPIs: These could include:
- Market size, growth rate, and demand drivers.
- Industry-specific metrics like market share, average revenue per customer (ARPC), or average deal size.
- External variables, such as economic growth rates, inflation rates, or commodity prices, that could affect the market.
- Data Modeling: Based on this data, the market forecasts are developed for the next 5 years. A combination of trend analysis, scenario modeling, and statistical regression might be used to generate projections.
- Scenario Analysis
- Goal: To test different assumptions and validate how sensitive the market is to changes in key variables (e.g., market demand, regulatory changes, technological disruptions).
- Types of Scenarios:
- Base Case: Based on current assumptions and historical data.
- Best-Case Scenario: Assuming favorable market conditions, regulatory environments, and technological advancements.
- Worst-Case Scenario: Accounting for adverse factors, such as economic downturns, stricter regulations, or unexpected disruptions.


