Australia Bottled Water Market Report: Trends, Growth and Forecast (2026-2032)
By Type of Water (Carbonated Bottled Water, Flavoured Bottled Water, Functional Bottled Water, Still Bottled Water), By Sub Types (Purified (Desalinated, Atmospheric Generated, Others), Mineral, Other (Spring, Alkaline, Other)), By Packaging Material (Flexible Packaging (Aluminium, Pouches), Glass, Rigid Plastic (PET Bottles, Thin Wall Plastic Containers, Others)), By Price Category (Budget, Economy, Premium), By Pack Size (100 ml, 125 ml, 200 ml, 250 ml, 330 ml, 370 ml, 450 ml, 500 ml, 591 ml, 750 ml, 1,000 ml, 1,500 ml, 4,000 ml, 5,000 ml, Others), By Sales Channel (On Trade (Restaurants, Hotels, Cafes, Others), Off Trade (Grocery Retailers (Convenience Retail, Supermarkets, Hypermarkets, Small Local Grocer), Non-Grocery Retailers (General Merchandise Stores), Vending, E-commerce)), By Region (Queensland, New South Wales, Victoria, South Australia, Others) ... Read more
|
Major Players
|
Australia Bottled Water Market Statistics and Insights, 2026
- Market Size Statistics
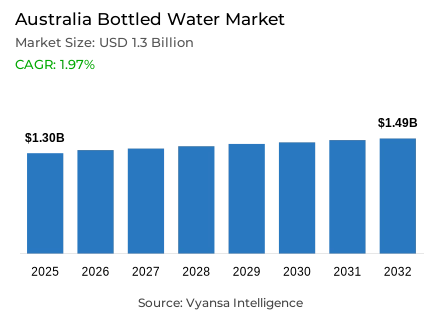
- Bottled water in Australia is estimated at USD 1.3 billion in 2025.
- The market size is expected to grow to USD 1.49 billion by 2032.
- Market to register a cagr of around 1.97% during 2026-32.
- Type of Water Shares
- Still bottled water grabbed market share of 35%.
- Competition
- Bottled water in Australia is currently being catered to by more than 20 companies.
- Top 5 companies acquired around 50% of the market share.
- Nexba Beverages Pty Ltd; Noble Beverages Pty Ltd; Nu-Pure Pty Ltd; Coca-Cola Europacific Partners plc; Schweppes Australia Pty Ltd etc., are few of the top companies.
- Sales Channel
- Off trade grabbed 85% of the market.
Australia Bottled Water Market Outlook
The Australia Bottled Water Market is expected to grow steadily in 2026-2032 as it is backed by continued awareness of health and wellness among Australians. Bottled water is hugely recognized as natural, calorie-free, and sugar-free drinking water. Hence, it is considered to be an alternate to carbonated soft drinks. With 66% of Australians considered to be overweight or obese in 2022, there is increased demand for low-calorie and zero-calorie drinks. Therefore, it is recognized as a part of daily consumer behavior in Australia.
Forecasted sales of bottled water in Australia for 2025 stand at USD 1.3 billion, and expected to reach around USD 1.49 billion in 2032, registering a CAGR of approximately 1.97% from 2026 to 2032. Even though a moderate path is being adopted, there is a noticeable impetus due to its inherent necessities as well as widespread adoption. Flavored and functional bottled water is also experiencing a paradigm shift due to increasing consumer demand for hydration solutions that are well-embedded within health and wellness.
Environmental issues are identified as a significant market restraint. The growing focus on single-use plastics in packaging and the low recycling rate of plastics at 20% in 2021-2022 are compelling companies to enhance their sustainability approach. Consumer demands for recyclable materials and clear sustainable principles are increasing in the bottled water industry in Australia.
Still Bottled Water leads with the highest market share of approximately 35%, and the main factors are its affordability, ease of use, and excellent suitability for general consumption. With respect to the sales channel, the market leader with the highest share of around 85% is the Off-Trade segment. This is mainly due to the presence of supermarkets, convenience stores, and the development of e-commerce platforms for bulk purchasing.

Australia Bottled Water Market Growth Driver
Health-Driven Hydration Supporting Category Demand
Increasing health and wellness awareness strongly supports bottled water consumption in Australia. Bottled water is considered a natural alternative to get the daily level of hydration without calories or sugar and thus is much more preferred over any carbonated soft drink. According to the Australian Institute of Health and Welfare, 66% of Australian adults were overweight or obese in 2022, boosting demand for beverages with low or zero calories that support healthier lifestyles.
This health focus is also driving a move into flavoured bottled water, which delivers taste without added sugar. The rise in demand for hydration products that fit wellness goals continues to underpin the position of bottled water as an item of regular consumption. As Australians increasingly prioritise preventive health and balanced diets, bottled water remains positioned as a routine, everyday hydration choice.
Australia Bottled Water Market Challenge
Environmental Concerns and Packaging Scrutiny
Increasing environmental consciousness is one of the major challenges facing bottled water in Australia. The category has a high visibility and is based on single-use packaging, which puts it under greater consumer and regulatory scrutiny. The National Waste Report by the Australia Government indicates that 20% of plastic packaging was recycled in 2021-22, which is a cause of concern in the management of plastic waste.
This heightened scrutiny puts pressure on bottled water producers to improve sustainability practices without sacrificing affordability and convenience. The expectations of consumers in terms of recyclable materials, less use of plastics, and transparent environmental promises are increasing. Companies that do not respond to these issues will face a threat of reputational damage and sustainability will become not only a challenge but also a compliance issue in the category.
Unlock Market Intelligence
Explore the market potential with our data-driven report
Australia Bottled Water Market Trend
Functional Ingredients Reshaping Product Innovation
The growing need of functional drinks is influencing the innovation in bottled water in Australia. Consumers are highly interested in products that provide added value like mental clarity, stress support, and digestive wellness. Food Standards Australia New Zealand (FSANZ) indicates that 66% of Australian consumers consider nutrition as a key factor in food selection, which indicates an increasing acceptance of fortified and enhanced beverages.
This tendency drives the growth of practical bottled water varieties, such as vitamin-enhanced, electrolyte-enriched, and relaxing formulations. Bottled water is being placed more and more outside of the fundamental hydration, which is consistent with lifestyle and wellness habits. The clean labels, science-based ingredients, and flavor diversity remain a strong force behind the category among health-conscious end users.
Australia Bottled Water Market Opportunity
Premiumisation Through Flavoured and Functional Formats
The increasing demand of functional drinks presents significant opportunities to bottled water brands in Australia. Consumers are becoming more ready to pay higher prices to beverages that offer additional wellness advantages in addition to hydration. The World Health Organization estimates that noncommunicable diseases cause almost 90% of all deaths in Australia, which supports the desire to make healthier daily consumption decisions.
Flavored and functional bottled water allows manufacturers to go beyond commodity pricing by positioning themselves as premium. Sugar-free flavored waters and vitamin-enriched versions meet the need of taste and functionality and enable brands to move beyond commodity pricing through premium positioning. These formats will be instrumental in maintaining category growth as wellness-based consumption continues to be the key factor in purchasing decisions.
Unlock Market Intelligence
Explore the market potential with our data-driven report
Australia Bottled Water Market Segmentation Analysis
By Type of Water
- Carbonated Bottled Water
- Flavoured Bottled Water
- Functional Bottled Water
- Still Bottled Water
The segment with the highest share under the Type of Water category is Still Bottled Water, accounting for around 35% of the market. This dominance reflects its continued relevance for daily hydration, driven by simplicity, affordability, and wide availability across off-trade channels. Still water remains the preferred choice for households purchasing multi-packs, particularly through supermarkets, where price-per-litre efficiency influences buying decisions.
Still bottled water also benefits from strong alignment with health-conscious consumption, as it is free from calories, sugars, and additives. Its versatility across consumption occasions—from home storage to on-the-go use—supports sustained demand. While flavoured and sparkling formats continue to grow, still bottled water remains the foundation of the category, anchoring overall volume performance in Australia.

By Sales Channel
- On Trade
- Restaurants
- Hotels
- Cafes
- Others
- Off Trade
- Grocery Retailers
- Convenience Retail
- Supermarkets
- Hypermarkets
- Small Local Grocer
- Non-Grocery Retailers
- General Merchandise Stores
- Vending
- E-commerce
- Grocery Retailers
The segment with the highest share under the Sales Channel category is Off-Trade, holding around 85% of the market. This dominance is supported by supermarkets and grocery stores, which offer extensive product variety, frequent promotions, and bulk purchasing options. Off-trade channels cater strongly to household consumption, reinforcing bottled water’s role as a staple beverage.
The growth of e-commerce within off-trade has further strengthened this channel’s position, allowing consumers to conveniently order larger pack sizes online. This has been particularly attractive for value-conscious households seeking cost-effective hydration solutions. As promotional activity and private label offerings continue to expand, off-trade channels are expected to remain the primary engine of bottled water sales in Australia.
List of Companies Covered in Australia Bottled Water Market
The companies listed below are highly influential in the Australia bottled water market, with a significant market share and a strong impact on industry developments.
- Nexba Beverages Pty Ltd
- Noble Beverages Pty Ltd
- Nu-Pure Pty Ltd
- Coca-Cola Europacific Partners plc
- Schweppes Australia Pty Ltd
- San Pellegrino SpA
- Made (Aust) Pty Ltd
- Refresco Australia Pty Ltd
- Bickford's Australia Pty Ltd
- Fresh Local Pty Ltd
Competitive Landscape
Australia’s Bottled Water Market in 2025 is led by Mount Franklin, owned by Coca-Cola Europacific Partners, supported by extensive distribution across grocery, convenience, and impulse channels and strong consumer trust. The brand’s presence in both still and sparkling formats, alongside the use of recycled PET packaging, has strengthened its sustainability credentials and retailer support. At the same time, private label continues to intensify competition, with major supermarket chains such as Woolworths and Coles expanding fruit-infused sparkling bottled water ranges. These value-driven offerings appeal to health- and price-conscious end users, reshaping competitive dynamics and challenging branded players to differentiate through innovation and sustainability.
Frequently Asked Questions
Related Report
1. Market Segmentation
1.1. Research Scope
1.2. Research Methodology
1.3. Definitions and Assumptions
2. Executive Summary
3. Australia Bottled Water Market Policies, Regulations, and Standards
4. Australia Bottled Water Market Dynamics
4.1. Growth Factors
4.2. Challenges
4.3. Trends
4.4. Opportunities
5. Australia Bottled Water Market Statistics, 2022-2032F
5.1. Market Size & Growth Outlook
5.1.1.By Revenues in USD Million
5.1.2.By Volume (Million Litres)
5.2. Market Segmentation & Growth Outlook
5.2.1.By Type of Water
5.2.1.1. Carbonated Bottled Water- Market Insights and Forecast 2022-2032, USD Million
5.2.1.2. Flavoured Bottled Water- Market Insights and Forecast 2022-2032, USD Million
5.2.1.3. Functional Bottled Water- Market Insights and Forecast 2022-2032, USD Million
5.2.1.4. Still Bottled Water- Market Insights and Forecast 2022-2032, USD Million
5.2.2.By Sub Types
5.2.2.1. Purified- Market Insights and Forecast 2022-2032, USD Million
5.2.2.1.1. Desalinated- Market Insights and Forecast 2022-2032, USD Million
5.2.2.1.2. Atmospheric Generated- Market Insights and Forecast 2022-2032, USD Million
5.2.2.1.3. Others- Market Insights and Forecast 2022-2032, USD Million
5.2.2.2. Mineral- Market Insights and Forecast 2022-2032, USD Million
5.2.2.3. Other (Spring, Alkaline, Other) - Market Insights and Forecast 2022-2032, USD Million
5.2.3.By Packaging Material
5.2.3.1. Flexible Packaging- Market Insights and Forecast 2022-2032, USD Million
5.2.3.1.1. Aluminium- Market Insights and Forecast 2022-2032, USD Million
5.2.3.1.2. Pouches- Market Insights and Forecast 2022-2032, USD Million
5.2.3.2. Glass- Market Insights and Forecast 2022-2032, USD Million
5.2.3.3. Rigid Plastic- Market Insights and Forecast 2022-2032, USD Million
5.2.3.3.1. PET Bottles- Market Insights and Forecast 2022-2032, USD Million
5.2.3.3.2. Thin Wall Plastic Containers- Market Insights and Forecast 2022-2032, USD Million
5.2.3.3.3. Others- Market Insights and Forecast 2022-2032, USD Million
5.2.4.By Price Category
5.2.4.1. Budget- Market Insights and Forecast 2022-2032, USD Million
5.2.4.2. Economy- Market Insights and Forecast 2022-2032, USD Million
5.2.4.3. Premium- Market Insights and Forecast 2022-2032, USD Million
5.2.5.By Pack Size
5.2.5.1. 100 ml- Market Insights and Forecast 2022-2032, USD Million
5.2.5.2. 125 ml- Market Insights and Forecast 2022-2032, USD Million
5.2.5.3. 200 ml- Market Insights and Forecast 2022-2032, USD Million
5.2.5.4. 250 ml- Market Insights and Forecast 2022-2032, USD Million
5.2.5.5. 330 ml- Market Insights and Forecast 2022-2032, USD Million
5.2.5.6. 370 ml- Market Insights and Forecast 2022-2032, USD Million
5.2.5.7. 450 ml- Market Insights and Forecast 2022-2032, USD Million
5.2.5.8. 500 ml- Market Insights and Forecast 2022-2032, USD Million
5.2.5.9. 591 ml- Market Insights and Forecast 2022-2032, USD Million
5.2.5.10. 750 ml- Market Insights and Forecast 2022-2032, USD Million
5.2.5.11. 1,000 ml- Market Insights and Forecast 2022-2032, USD Million
5.2.5.12. 1,500 ml- Market Insights and Forecast 2022-2032, USD Million
5.2.5.13. 4,000 ml- Market Insights and Forecast 2022-2032, USD Million
5.2.5.14. 5,000 ml- Market Insights and Forecast 2022-2032, USD Million
5.2.5.15. Others- Market Insights and Forecast 2022-2032, USD Million
5.2.6.By Sales Channel
5.2.6.1. On Trade- Market Insights and Forecast 2022-2032, USD Million
5.2.6.1.1. Restaurants- Market Insights and Forecast 2022-2032, USD Million
5.2.6.1.2. Hotels- Market Insights and Forecast 2022-2032, USD Million
5.2.6.1.3. Cafes- Market Insights and Forecast 2022-2032, USD Million
5.2.6.1.4. Others- Market Insights and Forecast 2022-2032, USD Million
5.2.6.2. Off Trade- Market Insights and Forecast 2022-2032, USD Million
5.2.6.2.1. Grocery Retailers- Market Insights and Forecast 2022-2032, USD Million
5.2.6.2.1.1. Convenience Retail- Market Insights and Forecast 2022-2032, USD Million
5.2.6.2.1.2. Supermarkets- Market Insights and Forecast 2022-2032, USD Million
5.2.6.2.1.3. Hypermarkets- Market Insights and Forecast 2022-2032, USD Million
5.2.6.2.1.4. Small Local Grocer- Market Insights and Forecast 2022-2032, USD Million
5.2.6.2.2. Non-Grocery Retailers- Market Insights and Forecast 2022-2032, USD Million
5.2.6.2.2.1. General Merchandise Stores- Market Insights and Forecast 2022-2032, USD Million
5.2.6.2.3. Vending- Market Insights and Forecast 2022-2032, USD Million
5.2.6.2.4. E-commerce- Market Insights and Forecast 2022-2032, USD Million
5.2.7.By Region
5.2.7.1. Queensland
5.2.7.2. New South Wales
5.2.7.3. Victoria
5.2.7.4. South Australia
5.2.7.5. Others
5.2.8.By Competitors
5.2.8.1. Competition Characteristics
5.2.8.2. Market Share & Analysis
6. Australia Carbonated Bottled Water Market Statistics, 2022-2032
6.1. Market Size & Growth Outlook
6.1.1.By Revenues in USD Million
6.1.2.By Volume (Million Litres)
6.2. Market Segmentation & Growth Outlook
6.2.1.By Packaging Material- Market Insights and Forecast 2022-2032, USD Million
6.2.2.By Price Point- Market Insights and Forecast 2022-2032, USD Million
6.2.3.By Sales Channel- Market Insights and Forecast 2022-2032, USD Million
6.2.4.By Region- Market Insights and Forecast 2022-2032, USD Million
7. Australia Flavoured Bottled Water Market Statistics, 2022-2032
7.1. Market Size & Growth Outlook
7.1.1.By Revenues in USD Million
7.1.2.By Volume (Million Litres)
7.2. Market Segmentation & Growth Outlook
7.2.1.By Packaging Material- Market Insights and Forecast 2022-2032, USD Million
7.2.2.By Price Point- Market Insights and Forecast 2022-2032, USD Million
7.2.3.By Sales Channel- Market Insights and Forecast 2022-2032, USD Million
7.2.4.By Region- Market Insights and Forecast 2022-2032, USD Million
8. Australia Functional Bottled Water Market Statistics, 2022-2032
8.1. Market Size & Growth Outlook
8.1.1.By Revenues in USD Million
8.1.2.By Volume (Million Litres)
8.2. Market Segmentation & Growth Outlook
8.2.1.By Packaging Material- Market Insights and Forecast 2022-2032, USD Million
8.2.2.By Price Point- Market Insights and Forecast 2022-2032, USD Million
8.2.3.By Sales Channel- Market Insights and Forecast 2022-2032, USD Million
8.2.4.By Region- Market Insights and Forecast 2022-2032, USD Million
9. Australia Still Bottled Water Market Statistics, 2022-2032
9.1. Market Size & Growth Outlook
9.1.1.By Revenues in USD Million
9.1.2.By Volume (Million Litres)
9.2. Market Segmentation & Growth Outlook
9.2.1.By Type of Water- Market Insights and Forecast 2022-2032, USD Million
9.2.2.By Packaging Material- Market Insights and Forecast 2022-2032, USD Million
9.2.3.By Price Point- Market Insights and Forecast 2022-2032, USD Million
9.2.4.By Sales Channel- Market Insights and Forecast 2022-2032, USD Million
9.2.5.By Region- Market Insights and Forecast 2022-2032, USD Million
10. Competitive Outlook
10.1. Company Profiles
10.1.1. Coca-Cola Europacific Partners plc
10.1.1.1. Business Description
10.1.1.2. Product Portfolio
10.1.1.3. Collaborations & Alliances
10.1.1.4. Recent Developments
10.1.1.5. Financial Details
10.1.1.6. Others
10.1.2. Schweppes Australia Pty Ltd
10.1.2.1. Business Description
10.1.2.2. Product Portfolio
10.1.2.3. Collaborations & Alliances
10.1.2.4. Recent Developments
10.1.2.5. Financial Details
10.1.2.6. Others
10.1.3. San Pellegrino SpA
10.1.3.1. Business Description
10.1.3.2. Product Portfolio
10.1.3.3. Collaborations & Alliances
10.1.3.4. Recent Developments
10.1.3.5. Financial Details
10.1.3.6. Others
10.1.4. Made (Aust) Pty Ltd
10.1.4.1. Business Description
10.1.4.2. Product Portfolio
10.1.4.3. Collaborations & Alliances
10.1.4.4. Recent Developments
10.1.4.5. Financial Details
10.1.4.6. Others
10.1.5. Refresco Australia Pty Ltd
10.1.5.1. Business Description
10.1.5.2. Product Portfolio
10.1.5.3. Collaborations & Alliances
10.1.5.4. Recent Developments
10.1.5.5. Financial Details
10.1.5.6. Others
10.1.6. Nexba Beverages Pty Ltd
10.1.6.1. Business Description
10.1.6.2. Product Portfolio
10.1.6.3. Collaborations & Alliances
10.1.6.4. Recent Developments
10.1.6.5. Financial Details
10.1.6.6. Others
10.1.7. Noble Beverages Pty Ltd
10.1.7.1. Business Description
10.1.7.2. Product Portfolio
10.1.7.3. Collaborations & Alliances
10.1.7.4. Recent Developments
10.1.7.5. Financial Details
10.1.7.6. Others
10.1.8. Nu-Pure Pty Ltd
10.1.8.1. Business Description
10.1.8.2. Product Portfolio
10.1.8.3. Collaborations & Alliances
10.1.8.4. Recent Developments
10.1.8.5. Financial Details
10.1.8.6. Others
10.1.9. Bickford's Australia Pty Ltd
10.1.9.1. Business Description
10.1.9.2. Product Portfolio
10.1.9.3. Collaborations & Alliances
10.1.9.4. Recent Developments
10.1.9.5. Financial Details
10.1.9.6. Others
10.1.10. Fresh Local Pty Ltd
10.1.10.1.Business Description
10.1.10.2.Product Portfolio
10.1.10.3.Collaborations & Alliances
10.1.10.4.Recent Developments
10.1.10.5.Financial Details
10.1.10.6.Others
11. Disclaimer
| Segment | Sub-Segment |
|---|---|
| By Type of Water |
|
| By Sub Types |
|
| By Packaging Material |
|
| By Price Category |
|
| By Pack Size |
|
| By Sales Channel |
|
| By Region |
|
Research Methodology
This study followed a structured approach comprising four key phases to assess the size and scope of the electro-oxidation market. The process began with thorough secondary research to collect data on the target market, related markets, and broader industry context. These findings, along with preliminary assumptions and estimates, were then validated through extensive primary research involving industry experts from across the value chain. To calculate the overall market size, both top-down and bottom-up methodologies were employed. Finally, market segmentation and data triangulation techniques were applied to refine and validate segment-level estimations.
Secondary Research
The secondary research phase involved gathering data from a wide range of credible and published sources. This step helped in identifying industry trends, defining market segmentation, and understanding the market landscape and value chain.
Sources consulted during this phase included:
- Company annual reports, investor presentations, and press releases
- Industry white papers and certified publications
- Trade directories and market-recognized databases
- Articles from authoritative authors and reputable journals
- Gold and silver standard websites
Secondary research was critical in mapping out the industry's value chain and monetary flow, identifying key market segments, understanding regional variations, and tracking significant industry developments.
Other key sources:
- Financial disclosures
- Industry associations and trade bodies
- News outlets and business magazines
- Academic journals and research studies
- Paid industry databases
Primary Research
To validate secondary data and gain deeper market insights, primary research was conducted with key stakeholders across both the supply and demand sides of the market.
On the demand side, participants included decision-makers and influencers from end-user industries—such as CIOs, CTOs, and CSOs—who provided first-hand perspectives on market needs, product usage, and future expectations.
On the supply side, interviews were conducted with manufacturers, industry associations, and institutional participants to gather insights into current offerings, product pipelines, and market challenges.
Primary interviews provided critical inputs such as:
- Market size and revenue data
- Product and service breakdowns
- Market forecasts
- Regional and application-specific trends
Stakeholders consulted included:
- Leading OEM and solution providers
- Channel and distribution partners
- End users across various applications
- Independent consultants and industry specialists
Market Size Estimation and Data Triangulation
- Identifying Key Market Participants (Secondary Research)
- Goal: To identify the major players or companies in the target market. This typically involves using publicly available data sources such as industry reports, market research publications, and financial statements of companies.
- Tools: Reports from firms like Gartner, Forrester, Euromonitor, Statista, IBISWorld, and others. Public financial statements, news articles, and press releases from top market players.
- Extracting Earnings of Key Market Participants
- Goal: To estimate the earnings generated from the product or service being analyzed. This step helps in understanding the revenue potential of each market player in a specific geography.
- Methods: Earnings data can be gathered from:
- Publicly available financial reports (for listed companies).
- Interviews and primary data sources from professionals, such as Directors, VPs, SVPs, etc. This is especially useful for understanding more nuanced, internal data that isn't publicly disclosed.
- Annual reports and investor presentations of key players.
- Data Collation and Development of a Relevant Data Model
- Goal: To collate inputs from both primary and secondary sources into a structured, data-driven model for market estimation. This model will incorporate key market KPIs and any independent variables relevant to the market.
- Key KPIs: These could include:
- Market size, growth rate, and demand drivers.
- Industry-specific metrics like market share, average revenue per customer (ARPC), or average deal size.
- External variables, such as economic growth rates, inflation rates, or commodity prices, that could affect the market.
- Data Modeling: Based on this data, the market forecasts are developed for the next 5 years. A combination of trend analysis, scenario modeling, and statistical regression might be used to generate projections.
- Scenario Analysis
- Goal: To test different assumptions and validate how sensitive the market is to changes in key variables (e.g., market demand, regulatory changes, technological disruptions).
- Types of Scenarios:
- Base Case: Based on current assumptions and historical data.
- Best-Case Scenario: Assuming favorable market conditions, regulatory environments, and technological advancements.
- Worst-Case Scenario: Accounting for adverse factors, such as economic downturns, stricter regulations, or unexpected disruptions.


