Australia Beer Market Report: Trends, Growth and Forecast (2026-2032)
Product Type (Dark Beer (Ale, Sorghum Beer, Weissbier/Weizen/Wheat Beer), Lager (Flavoured/Mixed Lager, Standard Lager (Premium Lager (Domestic Premium Lager, Imported Premium Lager), Mid-Priced Lager (Domestic Mid-Priced Lager, Imported Mid-Priced Lager), Economy Lager (Domestic Economy Lager, Imported Economy Lager))), Non/Low Alcohol Beer (Low Alcohol Beer, Non Alcoholic Beer), Stout, Others (Porter, Malt etc.)), Production (Macro Brewery, Micro Brewery, Craft Brewery), Packaging Type (Bottles, Cans, Others), Sales Channel (On-Trade, Off-Trade) ... Read more
|
Major Players
|
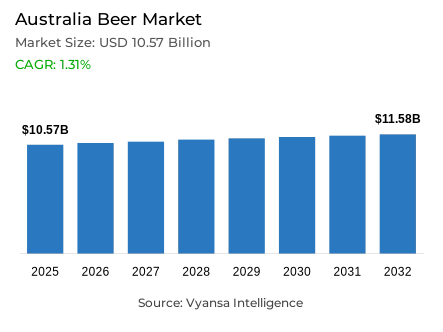
Australia Beer Market Statistics and Insights, 2026
- Market Size Statistics
- Beer in Australia is estimated at USD 10.57 billion.
- The market size is expected to grow to USD 11.58 billion by 2032.
- Market to register a cagr of around 1.31% during 2026-32.
- Product Type Shares
- Lager grabbed market share of 70%.
- Lager to witness a volume cagr of around 0.78%.
- Competition
- More than 5 companies are actively engaged in producing beer in Australia.
- Top 5 companies acquired around 70% of the market share.
- Asahi Group Holdings Ltd, Coca-Cola Amatil (Aust) Pty Ltd, Matso's Broome Brewery, Carlton & United Breweries Ltd, Lion Pty Ltd etc., are few of the top companies.
- Sales Channel
- Off-trade grabbed 70% of the market.
Australia Beer Market Outlook
The Australia beer market is expected to be valued at USD 10.57 billion by 2025 and further projected to develop to USD 11.58 billion by 2032, averaging around 1.31 percent CAGR in 2026-32. The beer market will continue to grow modestly as end users preferences diverge towards health and wellness and the development of new products in lower carb and non-alcohol segments continues. With inflationary pressures and rising cost of living expected to promote end users trading down from higher priced craft beers to affordable mainstream beers, the mixed beer category will benefit.
Lager is still the leading product type, enjoying approximately 70% share of overall beer sales. The segment is expected to see a stable growth through 2032, driven by its clean refreshing taste and expanding alignment with health trends through low-carb and mid-strength variants such as Hahn Super Dry Low Carb and Carlton 2.5%. Innovation in this segment is expected to continue meeting the requirements of health-conscious end users while maintaining flavor and brand loyalty.
This means that the non-alcoholic beer category will be the most dynamic in the forecast period, reflecting Australia increasing shift towards more mindful drinking. Younger generations are driving demand for options that use moderation as a front engaging healthier end userss, while breweries like Heaps Normal are harnessing wellness culture and social media to capture new audiences. Disposal of alcohol-free alternatives in bottled format will make an important contribution to overall market growth.
Off-trade is still the leading channel, capturing almost 70% of the market share in 2024, thereby fuelled by supermarkets, liquor chains and food/drink/tobacco specialists. Retailers, such as Coles Liquor and Thirsty Camel are building customer attention by adding into their services loyalty programs and click and collect for a more convenient experience, and increased engagement for the digital end users. Off-trade is recovering slowly with the easing of inflation, but bars and pubs remain reliant on younger generations seeking a more social experience which adds value to both off and on-trade markets.

Australia Beer Market Growth DriverIncreasing demand for low-carb and non-alcoholic beers
The Australia Beer Market is now guided by health and wellness. With renewed emphasis on mindful drinking and balance in the lifestyles of Australia, the consumption movement continues to shift in the direction of low-carb and non-alcohol styles. Brands have responded to meet this demand through new product innovation and product launches. Carlton & United Breweries extended their offerings to include VB Low Carb and Carlton 2.5% targeting end users looking for lighter, health-oriented options but not compromising on flavor.
This is also indicative of wider changes in consumption behavior focusing on younger and health-oriented end userss looking for moderation over indulgence. Non-alcohol brands like Heaps Normal have been able to engage with these end users by leading with wellness and cultural positioning. The new product innovations in low-carb and alcohol-free would continue to shape the beer category with health-oriented formats beginning to gain importance as a growth driver within the changing beer landscape in Australia.
Australia Beer Market ChallengeInflationary Pressures Hamper Growth of Craft Beer
The impact of inflation and rising household costs is significantly affecting the Australia Beer Market, particularly the craft beer segment. Rising production, packaging, and distribution costs are forcing breweries to raise prices, which in turn are pushing some end userss out of the premium craft beer market and back to mainstream brands, where the value proposition is better. Furthermore, with increasing living expenses, each year, more Australia are gravitating toward cheaper, mainstream brands, which is putting an end to or reversing the premiumization trend that historically contributed to strong growth of the category.
Independent breweries are especially impacted, as they continue to struggle with high operational costs and legacy debt from the pandemic, forcing several to shut down and hampering their ability to innovate; they're merely trying to survive, rather than innovate. The loss of new product range development and margin contraction can have adverse impacts on category diversity and competition. Inflation presents one of the most significant challenges to continuing to develop the industry.
Unlock Market Intelligence
Explore the market potential with our data-driven report
Australia Beer Market TrendPremiumisation and Brand Innovation Redefining the Market
Premiumization continues to be one of the biggest drivers within the Australia Beer Market, but economic conditions are impacting end users behavior. While some end users are gravitating towards affordable options, within the mainstream segments, there is still strong intent behind premium experiences and authentic flavors. This is encouraging brands to leverage existing portfolios and innovate, adding value while maintaining quality and relevance. Premium lagers, such as Corona Extra and Japanese-inspired Kirin, have been successful in appealing to demand amongst unique, international flavor emulsions.
At the same time, leading players are also launching healthy and mid-strength versions to account for changing lifestyles. Low carb and refreshing lagers that appeal to the health conscious end user are increasingly becoming part of product development. While the evolution shows that premiumization is not ending, changing - balancing affordability with their desire for better taste and quality and wellness orientated options across the Australia beer market.
Australia Beer Market OpportunityAI Integration to Boost Efficiency and Competitiveness
Artificial intelligence is quickly becoming a strong source of innovation, helping breweries improve the efficiency of production, optimize supply chains, and provide other personalized product journeys. Economic pressures continue to affect companies, though an increasingly resilient independent brewing class continues experimenting with AI-supported technologies, focusing on cost efficiencies and operational enhancements. Alongside several other local brewers, businesses such as Deep Liquid are working to streamline their purchasing, warehousing, and logistics.
In the near-term, AI will become critical in predictive demand planning and supply chain management, as well as enhanced end users interactions, much more effectively than ever before. In the meantime, the major breweries are buying into this future too, utilizing AI to improve production planning and sales forecasting. As more and more companies invest into the technology, it will enhance efficiency for not only the major players in the industry, but also the smaller, independent brewers. Ultimately, AI will allow breweries to improve profitability, while also responding quickly to market changes and end users behaviour.
Unlock Market Intelligence
Explore the market potential with our data-driven report
Australia Beer Market Segmentation Analysis

By Product Type
- Dark Beer
- Lager
- Non/Low Alcohol Beer
- Stout
The segment with highest market share under Product Type is Lager accounting approximately 70% in the Australia Beer Market. Lager remains the most preferred type of beer in Australia, and this is highly because of its clean and crisp flavor with lower alcohol content, which suits the warm climate and easy-drinking culture of the country.
The category continues to attract younger end users seeking refreshing and lower-strength options. Additionally, innovation in the low-carb and mid-strength variants has supported lager appeal to health-conscious drinkers. Companies like Lion Pty Ltd and Carlton & United Breweries introduce products to market that fit into evolving wellness preferences, including low-carb and reduced-calorie options. lager continues to dominate due to ongoing innovation from breweries, strong brand loyalt.
By Sales Channel
- On-Trade
- Off-Trade
The segment with highest market share under Sales Channel is Off-Trade with close to 70% of the total market. Further driven by increased overall beer consumption, it is evident more of the beer is being purchased to be consumed at home reflecting your rising cost of living. Off-Trade sales channels are critical for appealing to value-oriented end users through pricing and large selection of products, even some private label options, as highlighted through the supermarket sales format, spirits-based liquor chains, and food/drink/tobacco specialists such as Liquorland and Dan Murphy's.
Underscoring the stronger Off-Trade channel is the consolidation or expansion strategies of major retailers to drive economies of scale and availability for end users. An example of that is Coles Liquor consolidating under Liquorland, strongly entrenching themselves across the country. The comparative ease of the purchase of beer from an Off-Trade channel, in addition to the growth in multipack formats consumed as a relative value for money format, promotions, sales, and deals makes for very strong sale overall. There is no doubt Off-Trade sale channels will remain the largest contributor to beer category sales value in the beer market in Australia.
Top Companies in Australia Beer Market
The top companies operating in the market include Asahi Group Holdings Ltd, Coca-Cola Amatil (Aust) Pty Ltd, Matso's Broome Brewery, Carlton & United Breweries Ltd, Lion Pty Ltd, Coopers Brewery Ltd, Stone & Wood Brewing Co, Drinkworks Pty Ltd, etc., are the top players operating in the Australia beer market.
Frequently Asked Questions
Related Report
1. Market Segmentation
1.1. Research Scope
1.2. Research Methodology
1.3. Definitions and Assumptions
2. Executive Summary
3. Netherland Beer Market Policies, Regulations, and Standards
4. Netherland Beer Market Dynamics
4.1. Growth Factors
4.2. Challenges
4.3. Trends
4.4. Opportunities
5. Netherland Beer Market Statistics, 2022-2032F
5.1. Market Size & Growth Outlook
5.1.1.By Revenues in US$ Million
5.1.2.By Quantity Sold in Million Litres
5.2. Market Segmentation & Growth Outlook
5.2.1.By Product Type
5.2.1.1. Dark Beer- Market Insights and Forecast 2022-2032, USD Million
5.2.1.1.1. Ale- Market Insights and Forecast 2022-2032, USD Million
5.2.1.1.2. Sorghum Beer- Market Insights and Forecast 2022-2032, USD Million
5.2.1.1.3. Weissbier/Weizen/Wheat Beer- Market Insights and Forecast 2022-2032, USD Million
5.2.1.2. Lager- Market Insights and Forecast 2022-2032, USD Million
5.2.1.2.1. Flavoured/Mixed Lager- Market Insights and Forecast 2022-2032, USD Million
5.2.1.2.2. Standard Lager- Market Insights and Forecast 2022-2032, USD Million
5.2.1.2.2.1. Premium Lager- Market Insights and Forecast 2022-2032, USD Million
5.2.1.2.2.1.1. Domestic Premium Lager- Market Insights and Forecast 2022-2032, USD Million
5.2.1.2.2.1.2. Imported Premium Lager- Market Insights and Forecast 2022-2032, USD Million
5.2.1.2.2.2. Mid-Priced Lager- Market Insights and Forecast 2022-2032, USD Million
5.2.1.2.2.2.1. Domestic Mid-Priced Lager- Market Insights and Forecast 2022-2032, USD Million
5.2.1.2.2.2.2. Imported Mid-Priced Lager- Market Insights and Forecast 2022-2032, USD Million
5.2.1.2.2.3. Economy Lager- Market Insights and Forecast 2022-2032, USD Million
5.2.1.2.2.3.1. Domestic Economy Lager- Market Insights and Forecast 2022-2032, USD Million
5.2.1.2.2.3.2. Imported Economy Lager- Market Insights and Forecast 2022-2032, USD Million
5.2.1.3. Non/Low Alcohol Beer- Market Insights and Forecast 2022-2032, USD Million
5.2.1.3.1. Low Alcohol Beer- Market Insights and Forecast 2022-2032, USD Million
5.2.1.3.2. Non Alcoholic Beer- Market Insights and Forecast 2022-2032, USD Million
5.2.1.4. Stout- Market Insights and Forecast 2022-2032, USD Million
5.2.1.5. Others (Porter, Malt etc.) - Market Insights and Forecast 2022-2032, USD Million
5.2.2.By Production
5.2.2.1. Macro Brewery- Market Insights and Forecast 2022-2032, USD Million
5.2.2.2. Micro Brewery- Market Insights and Forecast 2022-2032, USD Million
5.2.2.3. Craft Brewery- Market Insights and Forecast 2022-2032, USD Million
5.2.3.By Packaging Type
5.2.3.1. Bottles- Market Insights and Forecast 2022-2032, USD Million
5.2.3.2. Cans- Market Insights and Forecast 2022-2032, USD Million
5.2.3.3. Others- Market Insights and Forecast 2022-2032, USD Million
5.2.4.By Sales Channel
5.2.4.1. On-Trade- Market Insights and Forecast 2022-2032, USD Million
5.2.4.2. Off-Trade- Market Insights and Forecast 2022-2032, USD Million
5.2.5.By Competitors
5.2.5.1. Competition Characteristics
5.2.5.2. Market Share & Analysis
6. Netherland Dark Beer Market Statistics, 2022-2032F
6.1. Market Size & Growth Outlook
6.1.1.By Revenues in US$ Million
6.1.2.By Quantity Sold in Million Litres
6.2. Market Segmentation & Growth Outlook
6.2.1.By Product Type- Market Insights and Forecast 2022-2032, USD Million
6.2.2.By Production- Market Insights and Forecast 2022-2032, USD Million
6.2.3.By Packaging Type- Market Insights and Forecast 2022-2032, USD Million
6.2.4.By Sales Channel- Market Insights and Forecast 2022-2032, USD Million
7. Netherland Lager Beer Market Statistics, 2022-2032F
7.1. Market Size & Growth Outlook
7.1.1.By Revenues in US$ Million
7.1.2.By Quantity Sold in Million Litres
7.2. Market Segmentation & Growth Outlook
7.2.1.By Product Type- Market Insights and Forecast 2022-2032, USD Million
7.2.2.By Production- Market Insights and Forecast 2022-2032, USD Million
7.2.3.By Packaging Type- Market Insights and Forecast 2022-2032, USD Million
7.2.4.By Sales Channel- Market Insights and Forecast 2022-2032, USD Million
8. Netherland Non/Low Alcohol Beer Market Statistics, 2022-2032F
8.1. Market Size & Growth Outlook
8.1.1.By Revenues in US$ Million
8.1.2.By Quantity Sold in Million Litres
8.2. Market Segmentation & Growth Outlook
8.2.1.By Production- Market Insights and Forecast 2022-2032, USD Million
8.2.2.By Packaging Type- Market Insights and Forecast 2022-2032, USD Million
8.2.3.By Sales Channel- Market Insights and Forecast 2022-2032, USD Million
9. Netherland Stout Beer Market Statistics, 2022-2032F
9.1. Market Size & Growth Outlook
9.1.1.By Revenues in US$ Million
9.1.2.By Quantity Sold in Million Litres
9.2. Market Segmentation & Growth Outlook
9.2.1.By Production- Market Insights and Forecast 2022-2032, USD Million
9.2.2.By Packaging Type- Market Insights and Forecast 2022-2032, USD Million
9.2.3.By Sales Channel- Market Insights and Forecast 2022-2032, USD Million
10. Competitive Outlook
10.1.1. Carlton & United Breweries Ltd
10.1.1.1. Business Description
10.1.1.2. Product Portfolio
10.1.1.3. Collaborations & Alliances
10.1.1.4. Recent Developments
10.1.1.5. Financial Details
10.1.1.6. Others
10.1.2. Lion Pty Ltd
10.1.2.1. Business Description
10.1.2.2. Product Portfolio
10.1.2.3. Collaborations & Alliances
10.1.2.4. Recent Developments
10.1.2.5. Financial Details
10.1.2.6. Others
10.1.3. Coopers Brewery Ltd
10.1.3.1. Business Description
10.1.3.2. Product Portfolio
10.1.3.3. Collaborations & Alliances
10.1.3.4. Recent Developments
10.1.3.5. Financial Details
10.1.3.6. Others
10.1.4. Stone & Wood Brewing Co
10.1.4.1. Business Description
10.1.4.2. Product Portfolio
10.1.4.3. Collaborations & Alliances
10.1.4.4. Recent Developments
10.1.4.5. Financial Details
10.1.4.6. Others
10.1.5. Drinkworks Pty Ltd
10.1.5.1. Business Description
10.1.5.2. Product Portfolio
10.1.5.3. Collaborations & Alliances
10.1.5.4. Recent Developments
10.1.5.5. Financial Details
10.1.5.6. Others
10.1.6. Asahi Group Holdings Ltd
10.1.6.1. Business Description
10.1.6.2. Product Portfolio
10.1.6.3. Collaborations & Alliances
10.1.6.4. Recent Developments
10.1.6.5. Financial Details
10.1.6.6. Others
10.1.7. Coca-Cola Amatil (Aust) Pty Ltd
10.1.7.1. Business Description
10.1.7.2. Product Portfolio
10.1.7.3. Collaborations & Alliances
10.1.7.4. Recent Developments
10.1.7.5. Financial Details
10.1.7.6. Others
10.1.8. Matso's Broome Brewery
10.1.8.1. Business Description
10.1.8.2. Product Portfolio
10.1.8.3. Collaborations & Alliances
10.1.8.4. Recent Developments
10.1.8.5. Financial Details
10.1.8.6. Others
10.1.9. Foster's Group Pty Ltd
10.1.9.1. Business Description
10.1.9.2. Product Portfolio
10.1.9.3. Collaborations & Alliances
10.1.9.4. Recent Developments
10.1.9.5. Financial Details
10.1.9.6. Others
11. Disclaimer
| Segment | Sub-Segment |
|---|---|
| By Product Type |
|
| By Production |
|
| By Packaging Type |
|
| By Sales Channel |
|
Research Methodology
This study followed a structured approach comprising four key phases to assess the size and scope of the electro-oxidation market. The process began with thorough secondary research to collect data on the target market, related markets, and broader industry context. These findings, along with preliminary assumptions and estimates, were then validated through extensive primary research involving industry experts from across the value chain. To calculate the overall market size, both top-down and bottom-up methodologies were employed. Finally, market segmentation and data triangulation techniques were applied to refine and validate segment-level estimations.
Secondary Research
The secondary research phase involved gathering data from a wide range of credible and published sources. This step helped in identifying industry trends, defining market segmentation, and understanding the market landscape and value chain.
Sources consulted during this phase included:
- Company annual reports, investor presentations, and press releases
- Industry white papers and certified publications
- Trade directories and market-recognized databases
- Articles from authoritative authors and reputable journals
- Gold and silver standard websites
Secondary research was critical in mapping out the industry's value chain and monetary flow, identifying key market segments, understanding regional variations, and tracking significant industry developments.
Other key sources:
- Financial disclosures
- Industry associations and trade bodies
- News outlets and business magazines
- Academic journals and research studies
- Paid industry databases
Primary Research
To validate secondary data and gain deeper market insights, primary research was conducted with key stakeholders across both the supply and demand sides of the market.
On the demand side, participants included decision-makers and influencers from end-user industries—such as CIOs, CTOs, and CSOs—who provided first-hand perspectives on market needs, product usage, and future expectations.
On the supply side, interviews were conducted with manufacturers, industry associations, and institutional participants to gather insights into current offerings, product pipelines, and market challenges.
Primary interviews provided critical inputs such as:
- Market size and revenue data
- Product and service breakdowns
- Market forecasts
- Regional and application-specific trends
Stakeholders consulted included:
- Leading OEM and solution providers
- Channel and distribution partners
- End users across various applications
- Independent consultants and industry specialists
Market Size Estimation and Data Triangulation
- Identifying Key Market Participants (Secondary Research)
- Goal: To identify the major players or companies in the target market. This typically involves using publicly available data sources such as industry reports, market research publications, and financial statements of companies.
- Tools: Reports from firms like Gartner, Forrester, Euromonitor, Statista, IBISWorld, and others. Public financial statements, news articles, and press releases from top market players.
- Extracting Earnings of Key Market Participants
- Goal: To estimate the earnings generated from the product or service being analyzed. This step helps in understanding the revenue potential of each market player in a specific geography.
- Methods: Earnings data can be gathered from:
- Publicly available financial reports (for listed companies).
- Interviews and primary data sources from professionals, such as Directors, VPs, SVPs, etc. This is especially useful for understanding more nuanced, internal data that isn't publicly disclosed.
- Annual reports and investor presentations of key players.
- Data Collation and Development of a Relevant Data Model
- Goal: To collate inputs from both primary and secondary sources into a structured, data-driven model for market estimation. This model will incorporate key market KPIs and any independent variables relevant to the market.
- Key KPIs: These could include:
- Market size, growth rate, and demand drivers.
- Industry-specific metrics like market share, average revenue per customer (ARPC), or average deal size.
- External variables, such as economic growth rates, inflation rates, or commodity prices, that could affect the market.
- Data Modeling: Based on this data, the market forecasts are developed for the next 5 years. A combination of trend analysis, scenario modeling, and statistical regression might be used to generate projections.
- Scenario Analysis
- Goal: To test different assumptions and validate how sensitive the market is to changes in key variables (e.g., market demand, regulatory changes, technological disruptions).
- Types of Scenarios:
- Base Case: Based on current assumptions and historical data.
- Best-Case Scenario: Assuming favorable market conditions, regulatory environments, and technological advancements.
- Worst-Case Scenario: Accounting for adverse factors, such as economic downturns, stricter regulations, or unexpected disruptions.


