Australia Analgesics Market Report: Trends, Growth and Forecast (2026-2032)
By Product (Systemic Analgesics (Adult Analgesics, Paediatric Analgesics, Combined Systemic Analgesics), Topical Analgesics/Anaesthetic), By Drug Type (Opioid Analgesics (Strong Opioids, Weak Opioids), Non-opioid Analgesics (Acetaminophen, Aspirin, Combination Products, Diclofenac, Dipyrone, Ibuprofen, Ketoprofen, Naproxen, OTC Triptans), Compound/Combination Analgesics (Opioid + Non-Opioid Combinations, Multi-Ingredient Non-Opioid Combinations)), By Route of Administration (Oral, Parenteral/Injectable, Topical/External, Transdermal, Rectal/Other), By Pain Type (Acute Pain, Chronic Pain, Breakthrough Pain), By Application (Surgical & Post-operative Pain, Musculoskeletal Pain, Neuropathic Pain, Cancer Pain, Migraine/Headache, Dental Pain, Others), By Sales Channel (Retail Offline (Offline Pharmacies, Hospital Pharmacies, Retail Online), Online Pharmacies), By Prescription Type (Prescription, OTC), By Formulation (Tablets, Capsules, Liquids, Injectables, Gels/Creams, Patches), By End User (Hospitals, Clinics/ASCs, Homecare), By By Region (Queensland, New South Wales, Victoria, South Australia, Others) ... Read more
|
Major Players
|
Australia Analgesics Market Statistics and Insights, 2026
- Market Size Statistics
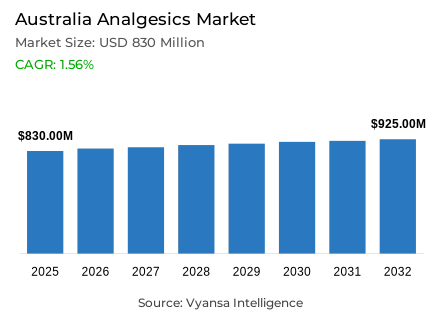
- Analgesics market size in Australia was valued at USD 830 million in 2025 and is estimated at USD 850 million in 2026.
- The market size is expected to grow to USD 925 million by 2032.
- Market to register a CAGR of around 1.56% during 2026-32.
- Product Shares
- Systemic analgesics grabbed market share of 85%.
- Competition
- More than 15 companies are actively engaged in producing analgesics in Australia.
- Top 5 companies acquired around 70% of the market share.
- Perrigo Australia, Opella Consumer Healthcare ANZ, Bayer Australia Pty Ltd, Haleon Australia Pty Ltd, Reckitt Benckiser (Australia) Pty Ltd etc., are few of the top companies.
- Sales Channel
- Retail offline grabbed 85% of the market.
Australia Analgesics Market Outlook
The Australia analgesics market size was valued at USD 830 million in 2025 and is projected to grow from USD 850 million in 2026 to USD 925 million by 2032, exhibiting a CAGR of around 1.56% during the forecast period. Growth is being supported by steady pain relief demand as more adults live with ongoing health needs that require regular symptom management. OTC products remain important for day to day relief from joint, muscle, back, and other recurring pain conditions.
Demand stays firm because pain management remains relevant for older and multi condition adults. ABS reports that 4.5 million people aged 45 years and over were retired in 2024-25, up from 4.2 million in 2022-23, while the average retirement age reached 57.3 years. The PaRIS Australian National Report 2025 also states that 39% of surveyed adults aged 45 years and over with chronic conditions live with three or more chronic conditions. This keeps analgesics closely linked with regular self care between medical visits.
A key challenge comes from tighter paracetamol regulation, which is changing how products are sold, packaged, and distributed across channels. At the same time, convenience led innovation is keeping the category active, with brands expanding into liquid capsules and orally disintegrating formats that are easier to carry and use. Within analgesics, systemic analgesics holds the highest product share at around 85%, supported by strong demand for practical everyday pain relief.
A wider digital care environment is also supporting more connected pain management through telehealth, clinician guided online programmes, and structured self management tools. The PaRIS Australian National Report 2025 finds that 96% of patients who accessed telehealth rated the quality of care positively. Alongside this, retail offline accounts for around 85% of sales, showing that analgesics continue to depend strongly on physical retail access, compliance led pack control, and convenient OTC purchasing across Australia.

Australia Analgesics Market Growth Driver
Rising Pain Burden Keeps Relief Products Essential
There is still a significant need for pain relief in Australia as more adults have long term health problems, which requires regular use of medications to manage their symptoms. Analgesics continue to play an important role in day to day relief for joint, muscle, back, and other recurring pain conditions, especially when consumers want practical OTC options that fit daily self care and help manage discomfort between medical visits.
ABS reports that 4.5 million people aged 45 years and over are retired in 2024-25, up from 4.2 million in 2022-23, while the average retirement age reaches 57.3 years. The PaRIS Australian National Report 2025 has also indicated that of those adult respondents aged 45 years and above with at least one chronic condition, 39% have 3 or more chronic conditions. This means that there will still be a strong need for pain management, and it will continue to drive regular use of analgesic medication between younger people and older people who have multiple chronic conditions.
Australia Analgesics Market Challenge
Stricter Paracetamol Rules Limit Pack Flexibility
Tighter regulation around paracetamol is becoming a key challenge in Australia because it changes how products are sold, packaged, and distributed across channels. This puts more pressure on brands and retailers to manage pack formats carefully, especially where larger take home packs previously supported convenience and value focused buying in general retail outlets.
The Therapeutic Goods Administration states that around 225 people in Australia are hospitalised with liver injury each year and 50 people die from paracetamol overdose. From 1 February 2025, general sale packs are reduced from 20 to 16 tablets or capsules, pharmacy packs without pharmacist supervision are reduced from 100 to 50, and larger packs up to 100 now require pharmacist supervision. Tablets and capsules for general and pharmacy sale also require blister packaging.
Unlock Market Intelligence
Explore the market potential with our data-driven report
Australia Analgesics Market Trend
Easier-to-Use Formats Gain More Visibility
Convenience led product design is becoming more visible across analgesics in Australia. Brands are expanding beyond standard tablets into liquid capsules and orally disintegrating formats that are easier to carry, easier to take, and better suited to on the go use. This keeps product innovation active in a mature category where ease of use and format differentiation matter more in purchase decisions.
TGA registration records show this movement clearly. ADVIL LIQUID CAPS ibuprofen 200 mg soft capsule blister pack carries an ARTG date of 2 December 2024. STRIDES IBUPROFEN MELTS ibuprofen 200 mg orally disintegrating tablets blister pack carries an ARTG date of 9 May 2025. PHARMACY CHOICE PARACETAMOL 500 MG LIQUID CAPSULES soft capsule blister pack (new formulation) carries an ARTG date of 22 December 2025. These launches reflect growing attention to faster, simpler, and more convenient pain relief formats.
Australia Analgesics Market Opportunity
Digital Support Expands Care Touchpoints
A wider digital care environment is creating room for more connected pain management in Australia. Analgesics are increasingly used within a broader support journey that includes telehealth, clinician guided online programmes, and structured self management tools. This improves access to support for people living with chronic pain and keeps pain relief products closely linked with ongoing everyday care rather than one time treatment only.
The PaRIS Australian National Report 2025 finds that 96% of patients who accessed telehealth rate the quality of care positively, and it also describes Australia as being among the leading countries for digital health integration. Healthdirect lists the Chronic Conditions Course as free for adults aged 18 years and older, while its Chronic Pain Program is free to enrol under clinician guidance for adults experiencing chronic pain. This strengthens access led support around pain management across the country.
Unlock Market Intelligence
Explore the market potential with our data-driven report
Australia Analgesics Market Segmentation Analysis
By Product
- Systemic Analgesics
- Adult Analgesics
- Paediatric Analgesics
- Combined Systemic Analgesics
- Topical Analgesics/Anaesthetic
The segment with the highest share under the product category is systemic analgesics, accounting for around 85% of the Australia analgesics market. This strong position is supported by steady demand for practical OTC pain relief among adults managing joint, muscle, back, and other recurring pain conditions. As more people live with ongoing health needs and need regular symptom management, systemic products remain widely used for day to day relief that fits daily self care between medical visits.
Its leading share is also supported by continued format innovation within the category. Brands are expanding beyond standard tablets into liquid capsules and orally disintegrating options that are easier to carry, easier to take, and better suited to on the go use. These convenient formats help keep systemic pain relief relevant in a mature category where ease of use and simple everyday management matter strongly in purchase decisions.

By Sales Channel
- Retail Offline
- Offline Pharmacies
- Hospital Pharmacies
- Retail Online
- Online Pharmacies
The segment with the highest share under the sales channel category is retail offline, holding around 85% of the Australia analgesics market. This leading position is supported by the way analgesics are sold, packaged, and distributed across physical retail channels. Consumers continue to rely on practical OTC options for regular pain management, while stores remain important for convenient access to products used for joint, muscle, back, and other recurring pain conditions.
Its dominance is also reinforced by tighter paracetamol regulation, which is placing greater focus on pack formats and pharmacist supervision in offline settings. From February 2025, smaller general sale packs, reduced pharmacy pack sizes, and pharmacist oversight for larger packs have made physical retail channels even more important in category sales. This keeps retail offline closely tied to compliance, product access, and everyday pain relief purchases across Australia.
List of Companies Covered in Australia Analgesics Market
The companies listed below are highly influential in the Australia analgesics market, with a significant market share and a strong impact on industry developments.
- Perrigo Australia
- Opella Consumer Healthcare ANZ
- Bayer Australia Pty Ltd
- Haleon Australia Pty Ltd
- Reckitt Benckiser (Australia) Pty Ltd
- Pharmacor Pty Ltd
- iNova Pharmaceuticals (Australia) Pty Ltd
- Aspen Pharmacare Australia Pty Ltd
- Sigma Healthcare Ltd
- Church & Dwight (Australia) Pty Ltd
Competitive Landscape
In 2025, the analgesics market in Australia was led by Haleon, primarily due to the strong performance of its Panadol brand within acetaminophen, supported by a wide product portfolio and continued innovation including plant-based offerings, while Reckitt Benckiser Group Plc remained a key competitor through its Nurofen brand, focusing on pain relief solutions and awareness campaigns such as addressing the gender pain gap, with both companies navigating increasing competition from private label products and responding through innovation, marketing initiatives, and sustainability efforts.
Frequently Asked Questions
Related Report
- Market Segmentation
- Research Scope
- Research Methodology
- Definitions and Assumptions
- Executive Summary
- Australia Analgesics Market Policies, Regulations, and Standards
- Australia Analgesics Market Dynamics
- Growth Factors
- Challenges
- Trends
- Opportunities
- Australia Analgesics Market Statistics, 2022-2032F
- Market Size & Growth Outlook
- By Revenues in USD Million
- Market Segmentation & Growth Outlook
- By Product
- Systemic Analgesics- Market Insights and Forecast 2022-2032, USD Million
- Adult Analgesics- Market Insights and Forecast 2022-2032, USD Million
- Paediatric Analgesics- Market Insights and Forecast 2022-2032, USD Million
- Combined Systemic Analgesics- Market Insights and Forecast 2022-2032, USD Million
- Topical Analgesics/Anaesthetic- Market Insights and Forecast 2022-2032, USD Million
- Systemic Analgesics- Market Insights and Forecast 2022-2032, USD Million
- By Drug Type
- Opioid Analgesics- Market Insights and Forecast 2022-2032, USD Million
- Strong Opioids- Market Insights and Forecast 2022-2032, USD Million
- Weak Opioids- Market Insights and Forecast 2022-2032, USD Million
- Non-opioid Analgesics- Market Insights and Forecast 2022-2032, USD Million
- Acetaminophen- Market Insights and Forecast 2022-2032, USD Million
- Aspirin- Market Insights and Forecast 2022-2032, USD Million
- Combination Products- Market Insights and Forecast 2022-2032, USD Million
- Diclofenac- Market Insights and Forecast 2022-2032, USD Million
- Dipyrone- Market Insights and Forecast 2022-2032, USD Million
- Ibuprofen- Market Insights and Forecast 2022-2032, USD Million
- Ketoprofen- Market Insights and Forecast 2022-2032, USD Million
- Naproxen- Market Insights and Forecast 2022-2032, USD Million
- OTC Triptans- Market Insights and Forecast 2022-2032, USD Million
- Compound/Combination Analgesics- Market Insights and Forecast 2022-2032, USD Million
- Opioid + Non-Opioid Combinations- Market Insights and Forecast 2022-2032, USD Million
- Multi-Ingredient Non-Opioid Combinations- Market Insights and Forecast 2022-2032, USD Million
- Opioid Analgesics- Market Insights and Forecast 2022-2032, USD Million
- By Route of Administration
- Oral- Market Insights and Forecast 2022-2032, USD Million
- Parenteral/Injectable- Market Insights and Forecast 2022-2032, USD Million
- Topical/External- Market Insights and Forecast 2022-2032, USD Million
- Transdermal- Market Insights and Forecast 2022-2032, USD Million
- Rectal/Other- Market Insights and Forecast 2022-2032, USD Million
- By Pain Type
- Acute Pain- Market Insights and Forecast 2022-2032, USD Million
- Chronic Pain- Market Insights and Forecast 2022-2032, USD Million
- Breakthrough Pain- Market Insights and Forecast 2022-2032, USD Million
- By Application
- Surgical & Post-operative Pain- Market Insights and Forecast 2022-2032, USD Million
- Musculoskeletal Pain- Market Insights and Forecast 2022-2032, USD Million
- Neuropathic Pain- Market Insights and Forecast 2022-2032, USD Million
- Cancer Pain- Market Insights and Forecast 2022-2032, USD Million
- Migraine/Headache- Market Insights and Forecast 2022-2032, USD Million
- Dental Pain- Market Insights and Forecast 2022-2032, USD Million
- Others- Market Insights and Forecast 2022-2032, USD Million
- By Sales Channel
- Retail Offline- Market Insights and Forecast 2022-2032, USD Million
- Offline Pharmacies- Market Insights and Forecast 2022-2032, USD Million
- Hospital Pharmacies- Market Insights and Forecast 2022-2032, USD Million
- Retail Online- Market Insights and Forecast 2022-2032, USD Million
- Online Pharmacies- Market Insights and Forecast 2022-2032, USD Million
- Retail Offline- Market Insights and Forecast 2022-2032, USD Million
- By Prescription Type
- Prescription- Market Insights and Forecast 2022-2032, USD Million
- OTC- Market Insights and Forecast 2022-2032, USD Million
- By Formulation
- Tablets- Market Insights and Forecast 2022-2032, USD Million
- Capsules- Market Insights and Forecast 2022-2032, USD Million
- Liquids- Market Insights and Forecast 2022-2032, USD Million
- Injectables- Market Insights and Forecast 2022-2032, USD Million
- Gels/Creams- Market Insights and Forecast 2022-2032, USD Million
- Patches- Market Insights and Forecast 2022-2032, USD Million
- By End User
- Hospitals- Market Insights and Forecast 2022-2032, USD Million
- Clinics/ASCs- Market Insights and Forecast 2022-2032, USD Million
- Homecare- Market Insights and Forecast 2022-2032, USD Million
- By Region
- Queensland
- New South Wales
- Victoria
- South Australia
- Others
- By Competitors
- Competition Characteristics
- Market Share & Analysis
- By Product
- Market Size & Growth Outlook
- Australia Systemic Analgesics Market Statistics, 2022-2032
- Market Size & Growth Outlook
- By Revenues in USD Million
- Market Segmentation & Growth Outlook
- By Drug Type- Market Insights and Forecast 2022-2032, USD Million
- By Route of Administration- Market Insights and Forecast 2022-2032, USD Million
- By Pain Type- Market Insights and Forecast 2022-2032, USD Million
- By Application- Market Insights and Forecast 2022-2032, USD Million
- By Sales Channel- Market Insights and Forecast 2022-2032, USD Million
- By Prescription Type- Market Insights and Forecast 2022-2032, USD Million
- By Formulation- Market Insights and Forecast 2022-2032, USD Million
- By End User- Market Insights and Forecast 2022-2032, USD Million
- By Region- Market Insights and Forecast 2022-2032, USD Million
- Market Size & Growth Outlook
- Australia Topical Analgesics/Anaesthetic Market Statistics, 2022-2032
- Market Size & Growth Outlook
- By Revenues in USD Million
- Market Segmentation & Growth Outlook
- By Drug Type- Market Insights and Forecast 2022-2032, USD Million
- By Route of Administration- Market Insights and Forecast 2022-2032, USD Million
- By Pain Type- Market Insights and Forecast 2022-2032, USD Million
- By Application- Market Insights and Forecast 2022-2032, USD Million
- By Sales Channel- Market Insights and Forecast 2022-2032, USD Million
- By Prescription Type- Market Insights and Forecast 2022-2032, USD Million
- By Formulation- Market Insights and Forecast 2022-2032, USD Million
- By End User- Market Insights and Forecast 2022-2032, USD Million
- By Region- Market Insights and Forecast 2022-2032, USD Million
- Market Size & Growth Outlook
- Competitive Outlook
- Company Profiles
- Haleon Australia Pty Ltd
- Business Description
- Product Portfolio
- Collaborations & Alliances
- Recent Developments
- Financial Details
- Others
- Reckitt Benckiser (Australia) Pty Ltd
- Business Description
- Product Portfolio
- Collaborations & Alliances
- Recent Developments
- Financial Details
- Others
- Pharmacor Pty Ltd
- Business Description
- Product Portfolio
- Collaborations & Alliances
- Recent Developments
- Financial Details
- Others
- iNova Pharmaceuticals (Australia) Pty Ltd
- Business Description
- Product Portfolio
- Collaborations & Alliances
- Recent Developments
- Financial Details
- Others
- Aspen Pharmacare Australia Pty Ltd
- Business Description
- Product Portfolio
- Collaborations & Alliances
- Recent Developments
- Financial Details
- Others
- Perrigo Australia
- Business Description
- Product Portfolio
- Collaborations & Alliances
- Recent Developments
- Financial Details
- Others
- Opella Consumer Healthcare ANZ
- Business Description
- Product Portfolio
- Collaborations & Alliances
- Recent Developments
- Financial Details
- Others
- Bayer Australia Pty Ltd
- Business Description
- Product Portfolio
- Collaborations & Alliances
- Recent Developments
- Financial Details
- Others
- Sigma Healthcare Ltd
- Business Description
- Product Portfolio
- Collaborations & Alliances
- Recent Developments
- Financial Details
- Others
- Church & Dwight (Australia) Pty Ltd
- Business Description
- Product Portfolio
- Collaborations & Alliances
- Recent Developments
- Financial Details
- Others
- Haleon Australia Pty Ltd
- Company Profiles
- Disclaimer
| Segment | Sub-Segment |
|---|---|
| By Product |
|
| By Drug Type |
|
| By Route of Administration |
|
| By Pain Type |
|
| By Application |
|
| By Sales Channel |
|
| By Prescription Type |
|
| By Formulation |
|
| By End User |
|
| By Region |
|
Research Methodology
This study followed a structured approach comprising four key phases to assess the size and scope of the electro-oxidation market. The process began with thorough secondary research to collect data on the target market, related markets, and broader industry context. These findings, along with preliminary assumptions and estimates, were then validated through extensive primary research involving industry experts from across the value chain. To calculate the overall market size, both top-down and bottom-up methodologies were employed. Finally, market segmentation and data triangulation techniques were applied to refine and validate segment-level estimations.
Secondary Research
The secondary research phase involved gathering data from a wide range of credible and published sources. This step helped in identifying industry trends, defining market segmentation, and understanding the market landscape and value chain.
Sources consulted during this phase included:
- Company annual reports, investor presentations, and press releases
- Industry white papers and certified publications
- Trade directories and market-recognized databases
- Articles from authoritative authors and reputable journals
- Gold and silver standard websites
Secondary research was critical in mapping out the industry's value chain and monetary flow, identifying key market segments, understanding regional variations, and tracking significant industry developments.
Other key sources:
- Financial disclosures
- Industry associations and trade bodies
- News outlets and business magazines
- Academic journals and research studies
- Paid industry databases
Primary Research
To validate secondary data and gain deeper market insights, primary research was conducted with key stakeholders across both the supply and demand sides of the market.
On the demand side, participants included decision-makers and influencers from end-user industries—such as CIOs, CTOs, and CSOs—who provided first-hand perspectives on market needs, product usage, and future expectations.
On the supply side, interviews were conducted with manufacturers, industry associations, and institutional participants to gather insights into current offerings, product pipelines, and market challenges.
Primary interviews provided critical inputs such as:
- Market size and revenue data
- Product and service breakdowns
- Market forecasts
- Regional and application-specific trends
Stakeholders consulted included:
- Leading OEM and solution providers
- Channel and distribution partners
- End users across various applications
- Independent consultants and industry specialists
Market Size Estimation and Data Triangulation
- Identifying Key Market Participants (Secondary Research)
- Goal: To identify the major players or companies in the target market. This typically involves using publicly available data sources such as industry reports, market research publications, and financial statements of companies.
- Tools: Reports from firms like Gartner, Forrester, Euromonitor, Statista, IBISWorld, and others. Public financial statements, news articles, and press releases from top market players.
- Extracting Earnings of Key Market Participants
- Goal: To estimate the earnings generated from the product or service being analyzed. This step helps in understanding the revenue potential of each market player in a specific geography.
- Methods: Earnings data can be gathered from:
- Publicly available financial reports (for listed companies).
- Interviews and primary data sources from professionals, such as Directors, VPs, SVPs, etc. This is especially useful for understanding more nuanced, internal data that isn't publicly disclosed.
- Annual reports and investor presentations of key players.
- Data Collation and Development of a Relevant Data Model
- Goal: To collate inputs from both primary and secondary sources into a structured, data-driven model for market estimation. This model will incorporate key market KPIs and any independent variables relevant to the market.
- Key KPIs: These could include:
- Market size, growth rate, and demand drivers.
- Industry-specific metrics like market share, average revenue per customer (ARPC), or average deal size.
- External variables, such as economic growth rates, inflation rates, or commodity prices, that could affect the market.
- Data Modeling: Based on this data, the market forecasts are developed for the next 5 years. A combination of trend analysis, scenario modeling, and statistical regression might be used to generate projections.
- Scenario Analysis
- Goal: To test different assumptions and validate how sensitive the market is to changes in key variables (e.g., market demand, regulatory changes, technological disruptions).
- Types of Scenarios:
- Base Case: Based on current assumptions and historical data.
- Best-Case Scenario: Assuming favorable market conditions, regulatory environments, and technological advancements.
- Worst-Case Scenario: Accounting for adverse factors, such as economic downturns, stricter regulations, or unexpected disruptions.


