Asia Pacific Robotaxi Market Report: Trends, Growth and Forecast (2026-2032)
By Level of Autonomy (Level 4, Level 5), By Vehicle Type (Cars, Shuttles/Vans, Purpose-Built Pods, Others), By Propulsion Type (Electric Vehicles (BEV), Hybrid Electric Vehicles (HEV), Fuel Cell Vehicles (FCV)), By Application (Passenger Transportation, Goods Transportation, Others), By Service Type (Ride-Hailing (On-Demand), Station-Based Shuttles, Goods Delivery, Others), By Component Type (LiDAR, Radar (mmWave), Camera, Ultrasonic Sensors, Sensor Fusion Systems, Others), By Country (China, Japan, India, South Korea, Australia & New Zealand, Indonesia, Thailand, Vietnam, Rest of Asia Pacific) ... Read more
|
Major Players
|
Asia Pacific Robotaxi Market Statistics and Insights, 2026
- Market Size Statistics
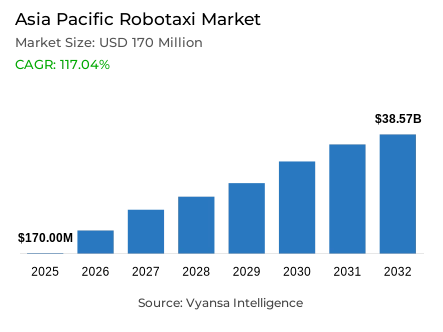
- Robotaxi market size in Asia Pacific was valued at USD 170 million in 2025 and is estimated at USD 178 million in 2026.
- The market size is expected to grow to USD 38.57 billion by 2032.
- Market to register a CAGR of around 117.04% during 2026-32.
- Application Shares
- Passenger transportation grabbed market share of 85%.
- Competition
- Robotaxi in Asia Pacific is currently being catered to by more than 10 companies.
- Top 5 companies acquired around 85% of the market share in 2026.
- Xiangdao Chuxing (Shanghai) Technology Co. Ltd. (Xiangdao Chuxing), TIER IV Inc., Waymo LLC, Baidu Apollo Network (Beijing) Limited (Apollo Go), Guangzhou WeRide Technologies Co. Ltd. (WeRide Go) etc., are few of the top companies.
- Service Type
- Ride-Hailing (On-Demand) grabbed 70% of the market.
- Country
- China leads with a 73% share of the Asia Pacific market.
Asia Pacific Robotaxi Market Outlook
Mobility systems are shifting toward fleet services that combine Level 4 vehicles, ride-booking platforms, remote supervision, mapping, charging, and depot operations. The Asia Pacific robotaxi market serves ride-hailing operators, transport agencies, airports, and logistics networks through driverless cars, shuttles, vans, and purpose-built pods. Valued at USD 170 million in 2025, it reaches USD 178 million in 2026 and is projected at USD 38.57 billion by 2032, reflecting a 117.04% CAGR during 2026-2032.
Policy clarity, road infrastructure, electrification, and app-based dispatch are accelerating commercial robotaxi deployment. The Asia Pacific robotaxi market benefits from expansion of Level 4 operating permits, vehicle-road-cloud integration, high-definition mapping, and remote fleet supervision. These capabilities allow The Asia Pacific robotaxi industry to progress from controlled pilots toward fully driverless commercial operations across urban corridors, airports, railway stations, business districts, and residential communities, while improving fleet availability and extending operating hours beyond conventional taxi models.
Commercial scaling affects vehicle manufacturing, sensor procurement, cloud computing, charging infrastructure, maintenance, insurance, and mobility-platform integration. The Asia Pacific robotaxi market strengthens demand for autonomous driving stacks, redundant controls, LiDAR, cameras, mapping, and fleet-management software. As utilization rises, The Asia Pacific robotaxi industry can lower per-ride operating costs, improve asset productivity, support broader public-transport coverage, and sustainably increase procurement visibility for automakers, technology suppliers, depot operators, municipal transport agencies, investors, and financiers across the region.
Commercial priorities in 2026 center on expanding fully driverless operating zones, lowering vehicle and sensor costs, strengthening remote supervision, and integrating autonomous services with established transport platforms. Investment is increasingly directed toward mass-produced Level 4 fleets, charging and depot infrastructure, safety validation, and cross-city deployment capability. These developments improve operating scalability, broaden service accessibility, and reinforce competitive positioning across The Asia Pacific robotaxi market and the wider Asia Pacific Robotaxi Industry during commercial expansion.

Asia Pacific Robotaxi Market Growth Driver
Urban Capacity Pressures Accelerate Autonomous Mobility Demand
Round-the-clock urban mobility demand is increasing pressure on cities to expand passenger capacity without matching growth in driver supply. The Asia Pacific robotaxi market addresses this constraint through autonomous ride-hailing, centralized dispatch, and scalable fleet operations. Dense metropolitan travel patterns, airport transfers, railway connectivity, and first-mile and last-mile connectivity demand support higher vehicle utilization, while electric robotaxi fleet deployment can reduce fuel exposure and align mobility procurement with municipal decarbonization and smart-city priorities across Asia.
Evidence confirms that demand is moving beyond experimentation. Baidu reported that Apollo Go completed 3.2 million fully driverless operational rides in the first quarter of 2026, with weekly volume exceeding 350,000 and cumulative public rides surpassing 22 million by April. Source This scale demonstrates how The Asia Pacific robotaxi industry is converting platform adoption into recurring mobility usage, supporting fleet expansion, depot investment, and procurement of autonomous vehicles and operating systems across markets.
Asia Pacific Robotaxi Market Challenge
Safety Validation and Regulatory Fragmentation Slow Scaling
Fragmented autonomous vehicle regulations, safety certification, insurance requirements, and operational-design-domain restrictions raise entry costs across national and municipal markets. The Asia Pacific robotaxi market must navigate different rules for testing, fare collection, safety operators, remote intervention, data retention, and passenger liability. These variations slow cross-city replication, complicate vehicle homologation, and require operators to maintain localized compliance teams, reducing the speed at which one validated autonomous driving stack can support multi-country commercial deployment during scaled deployment.
Singapore’s Land Transport Authority requires every autonomous vehicle to pass CETRAN safety assessments before road deployment, carry comprehensive third-party liability and property-damage insurance, and use a blackbox data recorder for investigations. Source These safeguards strengthen trust but increase validation time, documentation, testing mileage, and operating expenditure. For The Asia Pacific robotaxi industry, compliance complexity can delay fleet availability, restrict service areas, and disadvantage smaller operators lacking regulatory, insurance, and engineering resources across emerging commercial corridors.
Unlock Market Intelligence
Explore the market potential with our data-driven report
Asia Pacific Robotaxi Market Trend
Purpose-Built Platforms Push Fleets Toward Mass Production
Purpose-built robotaxi platforms and factory-integrated autonomy are replacing expensive retrofits as operators prepare for larger fleets. The Asia Pacific robotaxi market is moving toward standardized vehicle architectures, vehicle-grade computing, modular sensors, redundant braking and steering, and designs optimized for high annual mileage. Lower hardware costs and longer service life improve total cost of ownership, while common platforms simplify maintenance, spare-parts planning, technician training, and software deployment across multiple cities and operating partners at regional scale.
Shanghai’s official portal reported that Pony.ai’s seventh-generation Level 4 system has a designed life of 10 years or 600,000 kilometers and reduces hardware cost by 70% versus the previous generation. It supports three models developed with Toyota, BAIC, and GAC. Source Such scalable production architecture strengthens The Asia Pacific robotaxi industry by improving procurement economics, diversifying vehicle supply, and allowing operators to match autonomous platforms with different passenger and route requirements more efficiently.
Asia Pacific Robotaxi Market Opportunity
Transit Integration Opens New Deployment Corridors
First-mile and last-mile integration creates a scalable opportunity beyond premium city-center trips. The Asia Pacific robotaxi market can expand through feeder routes linking residential districts with metro stations, clinics, commercial centers, airports, and business parks. Structured corridors reduce route complexity, support predictable charging and maintenance cycles, and create measurable service-level outcomes for public agencies. Partnerships with transit authorities and established ride-hailing platforms can also improve demand aggregation, booking access, and public acceptance across regional networks.
Singapore’s Land Transport Authority announced three fixed-route autonomous shuttle services in Punggol, designed to connect residents with transport nodes and amenities while cutting public-transport travel time by up to 15 minutes. Grab and ComfortDelGro operate the routes using WeRide and Pony.ai platforms. Source This model creates procurement opportunities for vehicles, fleet software, charging, remote monitoring, and maintenance providers, while demonstrating how public-private operating structures can unlock underpenetrated suburban demand across additional Asia Pacific cities.
Asia Pacific Robotaxi Market Country Analysis
By Country
- China
- Japan
- India
- South Korea
- Australia & New Zealand
- Indonesia
- Thailand
- Vietnam
- Rest of Asia Pacific
China holds a 73% country share, supported by dense megacity demand, extensive testing zones, strong domestic autonomous-driving suppliers, and municipal willingness to license commercial services. The Asia Pacific robotaxi industry is therefore shaped heavily by Chinese fleet economics, vehicle-platform partnerships, and regulatory experimentation. Beijing, Shanghai, Guangzhou, Shenzhen, and Wuhan provide diversified operating environments that accelerate validation across airports, railway stations, residential districts, business zones, and mixed-traffic corridors while strengthening domestic supply-chain learning across national ecosystems.
Beijing’s municipal government reported that regulations effective April 1, 2025 cover infrastructure planning, road management, and safety assurance for Level 3 and higher autonomous vehicles. The city had already developed intelligent infrastructure across 600 square kilometers. Source This regulatory depth strengthens China’s commercialization lead by improving testing access, compliance visibility, and deployment readiness for Baidu, Pony.ai, WeRide, and other operators seeking larger fleets and wider operating domains across multiple high-demand urban mobility service environments.
Unlock Market Intelligence
Explore the market potential with our data-driven report
Asia Pacific Robotaxi Market Segmentation Analysis
By Application
- Passenger Transportation
- Goods Transportation
- Others
Passenger Transportation holds an 85% share under application, reflecting the strongest immediate monetization path for autonomous fleets. The Asia Pacific robotaxi market benefits from recurring urban trips, airport transfers, commuter journeys, and app-based robotaxi services that generate higher utilization than narrowly scheduled logistics use cases. Passenger operations also provide richer route data, faster feedback cycles, and broader platform visibility, helping operators refine dispatch, pricing, cabin design, accessibility, and service reliability across commercial operating zones regionwide.
Pony.ai reported in March 2026 that its robotaxi fleet had surpassed 1,159 vehicles after launching fully driverless ride-hailing across Beijing, Shanghai, Guangzhou, and Shenzhen. The company targets more than 3,000 vehicles by year-end. Source This passenger-focused scale supports stronger vehicle procurement, platform integration, and fleet-management demand, while demonstrating that high-density metropolitan operations can generate sufficient trip volume to justify larger depots, maintenance capacity, and autonomous system deployment across broader regional service networks.

By Service Type
- Ride-Hailing (On-Demand)
- Station-Based Shuttles
- Goods Delivery
- Others
Ride-Hailing (On-Demand) holds a 70% share under service type because flexible booking aligns autonomous fleets with variable passenger demand. The Asia Pacific robotaxi market gains from digital dispatch, dynamic routing, cashless payment, user authentication, and real-time vehicle allocation. Unlike fixed schedules, on-demand services can redirect capacity toward airports, business districts, entertainment zones, and peak commuter corridors, improving utilization while giving operators granular demand data for fleet sizing, pricing, and geographic expansion decisions at commercial scale.
Shanghai’s official portal reported that 2025 demonstration operation licenses authorized paid driverless taxi services in designated zones. Passengers could request Pony.ai rides through a WeChat mini-program, while fares were positioned alongside conventional taxi services. Source The transition from testing permits to fare-charging operations strengthens on-demand service economics, improves booking-platform adoption, and gives operators clearer evidence for expanding fleets, pickup points, operating hours, and partnerships with established mobility providers throughout additional high-density regional transport corridors.
Various Market Players in Asia Pacific Robotaxi Market
The companies mentioned below are highly active in the Asia Pacific robotaxi market, occupying a considerable portion of the market and shaping industry progress.
- Xiangdao Chuxing (Shanghai) Technology Co. Ltd. (Xiangdao Chuxing)
- TIER IV Inc.
- Waymo LLC
- Baidu Apollo Network (Beijing) Limited (Apollo Go)
- Guangzhou WeRide Technologies Co. Ltd. (WeRide Go)
- Pony.ai Inc. (PonyPilot)
- DiDi Global Inc. (DiDi Autonomous Driving)
- Guangzhou Qichen Technology Co. Ltd. (Ruqi Mobility)
- Nissan Motor Co. LTD
- SWM Co. Ltd.
- Kakao Mobility Corp. (Kakao T)
- Rideflux Inc.
Market News & Updates
- DiDi Global Inc. (DiDi Autonomous Driving), 2026:
DiDi Autonomous Driving and GAC Aion began delivering the R2, their next-generation Robotaxi developed for autonomous ride-hailing. The vehicle adds upgraded autonomous driving capabilities and a cabin designed for passenger service. The delivery moves DiDi from prototype development toward standardized fleet deployment and supports wider integration of autonomous vehicles with its ride-hailing platform in China.
- Nissan Motor Co. LTD, 2026:
Nissan, Wayve, and Uber introduced a Nissan LEAF-based Robotaxi prototype for a planned Tokyo pilot. The vehicle combines Nissan’s redundant vehicle systems, the Wayve AI Driver, and NVIDIA DRIVE Hyperion, with rides intended to be available through Uber. The update establishes a defined pathway for autonomous passenger service deployment in Japan beginning later in 2026.
Frequently Asked Questions
Related Report
- Market Segmentation
- Research Scope
- Research Methodology
- Definitions and Assumptions
- Executive Summary
- Asia Pacific Robotaxi Market Policies, Regulations, and Standards
- Asia Pacific Robotaxi Market Dynamics
- Growth Factors
- Challenges
- Trends
- Opportunities
- Asia Pacific Robotaxi Market Statistics, 2022-2032F
- Market Size & Growth Outlook
- By Revenues in USD Million
- Market Segmentation & Growth Outlook
- By Level of Autonomy
- Level 4- Market Insights and Forecast 2022-2032, USD Million
- Level 5- Market Insights and Forecast 2022-2032, USD Million
- By Vehicle Type
- Cars- Market Insights and Forecast 2022-2032, USD Million
- Shuttles/Vans- Market Insights and Forecast 2022-2032, USD Million
- Purpose-Built Pods- Market Insights and Forecast 2022-2032, USD Million
- Others- Market Insights and Forecast 2022-2032, USD Million
- By Propulsion Type
- Electric Vehicles (BEV)- Market Insights and Forecast 2022-2032, USD Million
- Hybrid Electric Vehicles (HEV)- Market Insights and Forecast 2022-2032, USD Million
- Fuel Cell Vehicles (FCV)- Market Insights and Forecast 2022-2032, USD Million
- By Application
- Passenger Transportation- Market Insights and Forecast 2022-2032, USD Million
- Goods Transportation- Market Insights and Forecast 2022-2032, USD Million
- Others- Market Insights and Forecast 2022-2032, USD Million
- By Service Type
- Ride-Hailing (On-Demand)- Market Insights and Forecast 2022-2032, USD Million
- Station-Based Shuttles- Market Insights and Forecast 2022-2032, USD Million
- Goods Delivery- Market Insights and Forecast 2022-2032, USD Million
- Others- Market Insights and Forecast 2022-2032, USD Million
- By Component Type
- LiDAR- Market Insights and Forecast 2022-2032, USD Million
- Radar (mmWave)- Market Insights and Forecast 2022-2032, USD Million
- Camera- Market Insights and Forecast 2022-2032, USD Million
- Ultrasonic Sensors- Market Insights and Forecast 2022-2032, USD Million
- Sensor Fusion Systems- Market Insights and Forecast 2022-2032, USD Million
- Others- Market Insights and Forecast 2022-2032, USD Million
- By Country
- China
- Japan
- India
- South Korea
- Australia & New Zealand
- Indonesia
- Thailand
- Vietnam
- Rest of Asia Pacific
- By Competitors
- Competition Characteristics
- Market Share & Analysis
- By Level of Autonomy
- Market Size & Growth Outlook
- China Robotaxi Market Statistics, 2022-2032F
- Market Size & Growth Outlook
- By Revenues in USD Million
- Market Segmentation & Growth Outlook
- By Level of Autonomy- Market Insights and Forecast 2022-2032, USD Million
- By Vehicle Type- Market Insights and Forecast 2022-2032, USD Million
- By Propulsion Type- Market Insights and Forecast 2022-2032, USD Million
- By Application- Market Insights and Forecast 2022-2032, USD Million
- By Service Type- Market Insights and Forecast 2022-2032, USD Million
- By Component Type- Market Insights and Forecast 2022-2032, USD Million
- Market Size & Growth Outlook
- Japan Robotaxi Market Statistics, 2022-2032F
- Market Size & Growth Outlook
- By Revenues in USD Million
- Market Segmentation & Growth Outlook
- By Level of Autonomy- Market Insights and Forecast 2022-2032, USD Million
- By Vehicle Type- Market Insights and Forecast 2022-2032, USD Million
- By Propulsion Type- Market Insights and Forecast 2022-2032, USD Million
- By Application- Market Insights and Forecast 2022-2032, USD Million
- By Service Type- Market Insights and Forecast 2022-2032, USD Million
- By Component Type- Market Insights and Forecast 2022-2032, USD Million
- Market Size & Growth Outlook
- India Robotaxi Market Statistics, 2022-2032F
- Market Size & Growth Outlook
- By Revenues in USD Million
- Market Segmentation & Growth Outlook
- By Level of Autonomy- Market Insights and Forecast 2022-2032, USD Million
- By Vehicle Type- Market Insights and Forecast 2022-2032, USD Million
- By Propulsion Type- Market Insights and Forecast 2022-2032, USD Million
- By Application- Market Insights and Forecast 2022-2032, USD Million
- By Service Type- Market Insights and Forecast 2022-2032, USD Million
- By Component Type- Market Insights and Forecast 2022-2032, USD Million
- Market Size & Growth Outlook
- South Korea Robotaxi Market Statistics, 2022-2032F
- Market Size & Growth Outlook
- By Revenues in USD Million
- Market Segmentation & Growth Outlook
- By Level of Autonomy- Market Insights and Forecast 2022-2032, USD Million
- By Vehicle Type- Market Insights and Forecast 2022-2032, USD Million
- By Propulsion Type- Market Insights and Forecast 2022-2032, USD Million
- By Application- Market Insights and Forecast 2022-2032, USD Million
- By Service Type- Market Insights and Forecast 2022-2032, USD Million
- By Component Type- Market Insights and Forecast 2022-2032, USD Million
- Market Size & Growth Outlook
- Australia & New Zealand Robotaxi Market Statistics, 2022-2032F
- Market Size & Growth Outlook
- By Revenues in USD Million
- Market Segmentation & Growth Outlook
- By Level of Autonomy- Market Insights and Forecast 2022-2032, USD Million
- By Vehicle Type- Market Insights and Forecast 2022-2032, USD Million
- By Propulsion Type- Market Insights and Forecast 2022-2032, USD Million
- By Application- Market Insights and Forecast 2022-2032, USD Million
- By Service Type- Market Insights and Forecast 2022-2032, USD Million
- By Component Type- Market Insights and Forecast 2022-2032, USD Million
- Market Size & Growth Outlook
- Indonesia Robotaxi Market Statistics, 2022-2032F
- Market Size & Growth Outlook
- By Revenues in USD Million
- Market Segmentation & Growth Outlook
- By Level of Autonomy- Market Insights and Forecast 2022-2032, USD Million
- By Vehicle Type- Market Insights and Forecast 2022-2032, USD Million
- By Propulsion Type- Market Insights and Forecast 2022-2032, USD Million
- By Application- Market Insights and Forecast 2022-2032, USD Million
- By Service Type- Market Insights and Forecast 2022-2032, USD Million
- By Component Type- Market Insights and Forecast 2022-2032, USD Million
- Market Size & Growth Outlook
- Thailand Robotaxi Market Statistics, 2022-2032F
- Market Size & Growth Outlook
- By Revenues in USD Million
- Market Segmentation & Growth Outlook
- By Level of Autonomy- Market Insights and Forecast 2022-2032, USD Million
- By Vehicle Type- Market Insights and Forecast 2022-2032, USD Million
- By Propulsion Type- Market Insights and Forecast 2022-2032, USD Million
- By Application- Market Insights and Forecast 2022-2032, USD Million
- By Service Type- Market Insights and Forecast 2022-2032, USD Million
- By Component Type- Market Insights and Forecast 2022-2032, USD Million
- Market Size & Growth Outlook
- Vietnam Robotaxi Market Statistics, 2022-2032F
- Market Size & Growth Outlook
- By Revenues in USD Million
- Market Segmentation & Growth Outlook
- By Level of Autonomy- Market Insights and Forecast 2022-2032, USD Million
- By Vehicle Type- Market Insights and Forecast 2022-2032, USD Million
- By Propulsion Type- Market Insights and Forecast 2022-2032, USD Million
- By Application- Market Insights and Forecast 2022-2032, USD Million
- By Service Type- Market Insights and Forecast 2022-2032, USD Million
- By Component Type- Market Insights and Forecast 2022-2032, USD Million
- Market Size & Growth Outlook
- Competitive Outlook
- Company Profiles
- Baidu Apollo Network (Beijing) Limited (Apollo Go)
- Business Description
- Product Portfolio
- Collaborations & Alliances
- Recent Developments
- Financial Details
- Others
- Guangzhou WeRide Technologies Co. Ltd. (WeRide Go)
- Business Description
- Product Portfolio
- Collaborations & Alliances
- Recent Developments
- Financial Details
- Others
- Pony.ai Inc. (PonyPilot)
- Business Description
- Product Portfolio
- Collaborations & Alliances
- Recent Developments
- Financial Details
- Others
- DiDi Global Inc. (DiDi Autonomous Driving)
- Business Description
- Product Portfolio
- Collaborations & Alliances
- Recent Developments
- Financial Details
- Others
- Guangzhou Qichen Technology Co. Ltd. (Ruqi Mobility)
- Business Description
- Product Portfolio
- Collaborations & Alliances
- Recent Developments
- Financial Details
- Others
- Xiangdao Chuxing (Shanghai) Technology Co. Ltd. (Xiangdao Chuxing)
- Business Description
- Product Portfolio
- Collaborations & Alliances
- Recent Developments
- Financial Details
- Others
- TIER IV Inc.
- Business Description
- Product Portfolio
- Collaborations & Alliances
- Recent Developments
- Financial Details
- Others
- Waymo LLC
- Business Description
- Product Portfolio
- Collaborations & Alliances
- Recent Developments
- Financial Details
- Others
- Nissan Motor Co. LTD
- Business Description
- Product Portfolio
- Collaborations & Alliances
- Recent Developments
- Financial Details
- Others
- SWM Co. Ltd.
- Business Description
- Product Portfolio
- Collaborations & Alliances
- Recent Developments
- Financial Details
- Others
- Kakao Mobility Corp. (Kakao T)
- Business Description
- Product Portfolio
- Collaborations & Alliances
- Recent Developments
- Financial Details
- Others
- Rideflux Inc.
- Business Description
- Product Portfolio
- Collaborations & Alliances
- Recent Developments
- Financial Details
- Others
- Baidu Apollo Network (Beijing) Limited (Apollo Go)
- Company Profiles
- Disclaimer
| Segment | Sub-Segment |
|---|---|
| By Level of Autonomy |
|
| By Vehicle Type |
|
| By Propulsion Type |
|
| By Application |
|
| By Service Type |
|
| By Component Type |
|
| By Country |
|
Research Methodology
This study followed a structured approach comprising four key phases to assess the size and scope of the electro-oxidation market. The process began with thorough secondary research to collect data on the target market, related markets, and broader industry context. These findings, along with preliminary assumptions and estimates, were then validated through extensive primary research involving industry experts from across the value chain. To calculate the overall market size, both top-down and bottom-up methodologies were employed. Finally, market segmentation and data triangulation techniques were applied to refine and validate segment-level estimations.
Secondary Research
The secondary research phase involved gathering data from a wide range of credible and published sources. This step helped in identifying industry trends, defining market segmentation, and understanding the market landscape and value chain.
Sources consulted during this phase included:
- Company annual reports, investor presentations, and press releases
- Industry white papers and certified publications
- Trade directories and market-recognized databases
- Articles from authoritative authors and reputable journals
- Gold and silver standard websites
Secondary research was critical in mapping out the industry's value chain and monetary flow, identifying key market segments, understanding regional variations, and tracking significant industry developments.
Other key sources:
- Financial disclosures
- Industry associations and trade bodies
- News outlets and business magazines
- Academic journals and research studies
- Paid industry databases
Primary Research
To validate secondary data and gain deeper market insights, primary research was conducted with key stakeholders across both the supply and demand sides of the market.
On the demand side, participants included decision-makers and influencers from end-user industries—such as CIOs, CTOs, and CSOs—who provided first-hand perspectives on market needs, product usage, and future expectations.
On the supply side, interviews were conducted with manufacturers, industry associations, and institutional participants to gather insights into current offerings, product pipelines, and market challenges.
Primary interviews provided critical inputs such as:
- Market size and revenue data
- Product and service breakdowns
- Market forecasts
- Regional and application-specific trends
Stakeholders consulted included:
- Leading OEM and solution providers
- Channel and distribution partners
- End users across various applications
- Independent consultants and industry specialists
Market Size Estimation and Data Triangulation
- Identifying Key Market Participants (Secondary Research)
- Goal: To identify the major players or companies in the target market. This typically involves using publicly available data sources such as industry reports, market research publications, and financial statements of companies.
- Tools: Reports from firms like Gartner, Forrester, Euromonitor, Statista, IBISWorld, and others. Public financial statements, news articles, and press releases from top market players.
- Extracting Earnings of Key Market Participants
- Goal: To estimate the earnings generated from the product or service being analyzed. This step helps in understanding the revenue potential of each market player in a specific geography.
- Methods: Earnings data can be gathered from:
- Publicly available financial reports (for listed companies).
- Interviews and primary data sources from professionals, such as Directors, VPs, SVPs, etc. This is especially useful for understanding more nuanced, internal data that isn't publicly disclosed.
- Annual reports and investor presentations of key players.
- Data Collation and Development of a Relevant Data Model
- Goal: To collate inputs from both primary and secondary sources into a structured, data-driven model for market estimation. This model will incorporate key market KPIs and any independent variables relevant to the market.
- Key KPIs: These could include:
- Market size, growth rate, and demand drivers.
- Industry-specific metrics like market share, average revenue per customer (ARPC), or average deal size.
- External variables, such as economic growth rates, inflation rates, or commodity prices, that could affect the market.
- Data Modeling: Based on this data, the market forecasts are developed for the next 5 years. A combination of trend analysis, scenario modeling, and statistical regression might be used to generate projections.
- Scenario Analysis
- Goal: To test different assumptions and validate how sensitive the market is to changes in key variables (e.g., market demand, regulatory changes, technological disruptions).
- Types of Scenarios:
- Base Case: Based on current assumptions and historical data.
- Best-Case Scenario: Assuming favorable market conditions, regulatory environments, and technological advancements.
- Worst-Case Scenario: Accounting for adverse factors, such as economic downturns, stricter regulations, or unexpected disruptions.


