Global Agriculture Tire Market Report: Trends, Growth and Forecast (2026-2032)
By Type of Tire (Bias, Radial), By Tire Size (Tire Size 1, Tire Size 2, Tire Size 3, Tire Size 4, Tire Size 5), By Demand Type (OEM, Replacement), By Equipment Type (Tractors, Harvesters/Combine Harvesters, Planters/Seeders, Balers & Forage Equipment, Sprayers, Trailers/Carts, Other Agricultural Machinery), By End User (Large-Scale Commercial Farms, Small & Medium-Scale Farms, Agri-Contractors, Government/Public Sector (Agricultural Mechanization Programs)), By Region (North America, South America, Europe, Middle East & Africa, Asia Pacific) ... Read more
|
Major Players
|
Global Agriculture Tire Market Statistics and Insights, 2026
- Market Size Statistics
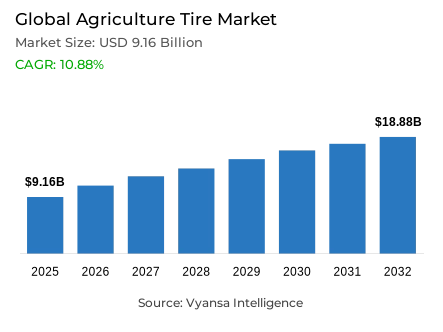
- Agriculture Tire market size was valued at USD 9.16 billion in 2025 and is estimated at USD 10.26 billion in 2026.
- The market size is expected to grow to USD 18.88 billion by 2032.
- Market to register a CAGR of around 10.88% during 2026-32.
- Type of Tire Shares
- Radial tires grabbed market share of 60%.
- Competition
- More than 30 companies are actively engaged in producing agriculture tire.
- Top 5 companies acquired around 35% of the market share.
- Continental AG, JK Tyre & Industries Ltd., MRF Limited, Michelin, Bridgestone etc., are few of the top companies.
- Equipment Type
- Tractors grabbed 65% of the market.
- Region
- Asia Pacific leads with a 36% share of the global market.
Global Agriculture Tire Market Outlook
The global agriculture tire market was valued at USD 9.16 billion in 2025 and is projected to grow from USD 10.26 billion in 2026 to USD 18.88 billion by 2032, registering a CAGR of 10.88% during the forecast period. Growth is supported by heavier farm equipment use, higher operating hours, and a replacement cycle driven by wear, field workload, and seasonal deployment patterns. Agricultural tires are therefore tied not only to machinery ownership, but to how intensely tractors and harvesters are used in the field.
Mechanization is the main structural backdrop for this market. FAO’s framing of mechanization emphasizes productivity, timeliness, resource efficiency, and improved market access, all of which raise equipment utilization and intensify tire wear. That makes agriculture tires an aftermarket-and-replacement story as much as an OEM story. As fleets become more productive and spend more time in field operations, tire replacement becomes a recurring operating requirement rather than an occasional purchase.
Product mix also reflects how the market is used in practice. Based on the study estimates in the uploaded material, radial tires hold a 60% share because they fit modern field operations better, while tractors lead the equipment mix with a 65% share because they remain the primary power unit across farming tasks. This keeps demand closely linked to tractor operating hours, traction requirements, and replacement frequency across large and medium-scale farm operations.
Regionally, Asia Pacific leads with a 36% share, supported by a large agricultural production base and a broad installed machinery fleet. OECD and FAO note that the region accounts for nearly a fifth of global agriculture and fish output in the 2020–22 base period, with China central to production and growth. That scale creates sustained demand for agriculture tire replacement across a wide range of farm equipment and operating conditions.

Global Agriculture Tire Market Growth Driver
Tire Wear Is Driving Repeat Demand
Farm equipment is being used more intensively, which is increasing tire wear and accelerating replacement demand. FAO’s mechanization framework links machinery use with better timeliness, labor efficiency, and productivity, but the tire-market implication is simpler: more field hours mean more wear cycles. Tractors, harvesters, sprayers, and other machines operating across seasonal workloads place recurring pressure on tire life.
That makes demand structurally different from many other tire markets. In agriculture, replacement buying is driven by operating hours, terrain conditions, and field workload rather than by passenger-vehicle-like usage patterns. As fleets modernize and farm operations scale up, agriculture tires are replaced more often to preserve traction, uptime, and productivity. This replacement cycle is the core growth engine for the market.
Global Agriculture Tire Market Challenge
Input Cost Volatility Is Restricting Pricing Flexibility
Raw-material and energy-cost volatility is the main constraint on the market. The World Bank has highlighted continued uncertainty in commodity and energy pricing, which affects manufacturing cost, transport expense, and final tire pricing stability. For tire makers, that creates a narrow margin environment because agricultural buyers are highly sensitive to total ownership cost.
The impact is especially visible in replacement purchases. When input costs rise, suppliers have less room to absorb price increases, while farmers may delay replacement if budgets are tight. That can soften aftermarket demand in price-sensitive markets and make distribution planning more difficult. The challenge is therefore not only inflationary pressure, but also the effect that cost volatility has on replacement timing and purchasing behavior.
Unlock Market Intelligence
Explore the market potential with our data-driven report
Global Agriculture Tire Market Trend
Precision Field Operations Are Favoring Lower-Compaction Designs
Tire selection is increasingly shaped by soil-protection and field-efficiency requirements. Precision agriculture, smart farming, and higher-horsepower tractors are pushing buyers toward tires that reduce soil compaction while maintaining traction and load handling. That trend supports radial construction, IF tires, VF tires, and high-flotation formats that perform better in soft-soil and high-load conditions.
The practical market effect is a shift toward tires that help preserve field productivity over repeated passes. Agriculture tire buyers are not only looking for durability; they are also looking for field efficiency, footprint reduction, and improved traction engineering. This is making tire design a part of farm productivity strategy, especially in row-crop and large-scale commercial farming environments.
Global Agriculture Tire Market Opportunity
Hire-Service Fleets Are Expanding the Replacement Pool
Farm mechanization hire services are creating a useful demand pocket for agriculture tires. FAO treats hire services as a viable business model within sustainable mechanization, especially where local operating conditions support high equipment utilization. That model matters because service fleets run more frequently than many owner-operated machines, increasing tire wear and replacement frequency.
This opens a clear opportunity for tire suppliers. When machinery is used as a service asset rather than a lightly utilized owned asset, tire consumption rises faster. The strongest demand pockets are therefore likely to come from markets with expanding farm contracting, equipment rental, and shared machinery fleets, where uptime and durability matter more than minimum upfront cost.
Global Agriculture Tire Market Regional Analysis

By Region
- North America
- South America
- Europe
- Middle East & Africa
- Asia Pacific
Asia Pacific leads the global agriculture tire market with an estimated 36% share. The region’s position is tied to its large agricultural output, broad machinery base, and sustained need for replacement tires across intensive farming operations. OECD and FAO data point to the region’s strong role in global agriculture and fish output, which translates into a large installed base of farm equipment.
China is central to that regional scale, while India, Brazil, and other large agricultural markets contribute to recurring demand for tractor, harvester, and sprayer tires. The combination of farm production scale, mechanization, and field wear makes Asia Pacific the strongest regional base for agriculture tire consumption. In practical terms, the region leads because it combines high farm activity with a large and continuously replenished machinery fleet.
Unlock Market Intelligence
Explore the market potential with our data-driven report
Global Agriculture Tire Market Segmentation Analysis
By Type of Tire
- Bias
- Radial
Radial agriculture tires hold the largest share in the tire-type mix, accounting for around 60% based on the study estimates provided. Their leadership reflects better fit with modern farming, where tractors need traction, load stability, and field efficiency across variable terrain and repeated passes. Radial construction supports those operating conditions more effectively than older designs.
The segment also benefits from lower soil disturbance and better field performance. Buyers increasingly value tires that support crop protection, efficient power transfer, and reduced compaction, especially in precision agriculture settings. As a result, radial tires are not leading simply because of market habit; they lead because they match how contemporary farm fleets are used.

By Equipment Type
- Tractors
- Harvesters/Combine Harvesters
- Planters/Seeders
- Balers & Forage Equipment
- Sprayers
- Trailers/Carts
- Other Agricultural Machinery
Tractors account for the largest share of equipment-based tire demand, at around 65% based on the study estimates provided. They remain the core workhorse across plowing, spraying, transport, planting, and harvest support, which makes them the dominant source of tire consumption in farming.
Their importance comes from utilization intensity. Tractors have the widest installed base, the highest operating hours, and some of the most frequent replacement needs because they work across multiple seasons and tasks. That is why tractor tires remain the largest demand center in the market, both for OEM fitment and aftermarket replacement.
Market Players in Global Agriculture Tire Market
These market players maintain a significant presence in the Global agriculture tire market and contribute to its ongoing evolution.
- Continental AG
- JK Tyre & Industries Ltd.
- MRF Limited
- Michelin
- Bridgestone
- Balkrishna Industries Limited (BKT)
- Nokian
- CEAT Ltd.
- Specialty Tires of America Inc.
- Sumitomo Rubber Industries Ltd.
- Pirelli
- The Carlstar Group LLC
- Titan International Inc.
- Trelleborg AB
- Yokohama
Market News & Updates
- Nokian Heavy Tyres, 2025:
Nokian Heavy Tyres introduced Intuitu™ 2.0 Smart Pressure Assistant for Nokian Tyres Soil King VF tractor tires at Agritechnica 2025. The technology uses a tire sensor and smartphone to provide pressure recommendations based on tractor operating weight and use conditions. The update supports smarter tire pressure management for agricultural tractors
- Trelleborg Tires, 2025:
Trelleborg Tires launched TM200 ProgressiveTraction® at Agritechnica 2025 for specialized farming applications. The tire combines VF and ProgressiveTraction® technologies and is designed for vineyards and orchards. The update expands Trelleborg’s agricultural tire portfolio for high-traction, stable, and longer-life field operations.
Frequently Asked Questions
Related Report
- Market Segmentation
- Research Scope
- Research Methodology
- Definitions and Assumptions
- Executive Summary
- Global Agriculture Tire Market Policies, Regulations, and Standards
- Global Agriculture Tire Production (Thousand Units) Trend 2022-2032
- Global Agriculture Tire Production (Thousand Units) Trend By Type of Tire
- Bias
- Radial
- Company Wise Production Plants and Statistics
- Installed Production Capacity
- Actual Production
- Planned Production Target
- Global Agriculture Tire Production (Thousand Units) Trend By Type of Tire
- Global Agriculture Tire Pricing Analysis 2022-2032
- Global Agriculture Tire Pricing Trend (USD/Unit) 2022-2032
- Global Agriculture Tire Pricing Trend (USD/Unit) By Regions 2022-2032
- North America
- South America
- Europe
- Middle East & Africa
- Asia Pacific
- Global Agriculture Tire Pricing Trend (USD/Unit) By Type of Tire 2022-2032
- Bias
- Radial
- Global Agriculture Tire Market Dynamics
- Growth Factors
- Challenges
- Trends
- Opportunities
- Global Agriculture Tire Market Statistics, 2022-2032F
- Market Size & Growth Outlook
- By Revenues in USD Million
- By Units Sold (Thousand Units)
- Market Segmentation & Growth Outlook
- By Type of Tire
- Bias- Market Insights and Forecast 2022-2032, Million Units
- Radial- Market Insights and Forecast 2022-2032, Million Units
- By Tire Size
- Tire Size 1- Market Insights and Forecast 2022-2032, Million Units
- Tire Size 2- Market Insights and Forecast 2022-2032, Million Units
- Tire Size 3- Market Insights and Forecast 2022-2032, Million Units
- Tire Size 4- Market Insights and Forecast 2022-2032, Million Units
- Tire Size 5- Market Insights and Forecast 2022-2032, Million Units
- By Demand Type
- OEM- Market Insights and Forecast 2022-2032, Million Units
- Replacement- Market Insights and Forecast 2022-2032, Million Units
- By Equipment Type
- Tractors- Market Insights and Forecast 2022-2032, Million Units
- Harvesters/Combine Harvesters- Market Insights and Forecast 2022-2032, Million Units
- Planters/Seeders- Market Insights and Forecast 2022-2032, Million Units
- Balers & Forage Equipment- Market Insights and Forecast 2022-2032, Million Units
- Sprayers- Market Insights and Forecast 2022-2032, Million Units
- Trailers/Carts- Market Insights and Forecast 2022-2032, Million Units
- Other Agricultural Machinery- Market Insights and Forecast 2022-2032, Million Units
- By End User
- Large-Scale Commercial Farms- Market Insights and Forecast 2022-2032, Million Units
- Small & Medium-Scale Farms- Market Insights and Forecast 2022-2032, Million Units
- Agri-Contractors- Market Insights and Forecast 2022-2032, Million Units
- Government/Public Sector (Agricultural Mechanization Programs)- Market Insights and Forecast 2022-2032, Million Units
- By Region
- North America
- South America
- Europe
- Middle East & Africa
- Asia Pacific
- By Competitors
- Competition Characteristics
- Market Share & Analysis
- By Type of Tire
- Market Size & Growth Outlook
- North America Agriculture Tire Market Statistics, 2022-2032F
- Market Size & Growth Outlook
- By Revenues in USD Million
- By Units Sold (Thousand Units)
- Market Segmentation & Growth Outlook
- By Type of Tire- Market Insights and Forecast 2022-2032, Million Units
- By Tire Size- Market Insights and Forecast 2022-2032, Million Units
- By Demand Type- Market Insights and Forecast 2022-2032, Million Units
- By Equipment Type- Market Insights and Forecast 2022-2032, Million Units
- By End User- Market Insights and Forecast 2022-2032, Million Units
- By Country
- The US
- Canada
- Mexico
- The US Agriculture Tire Market Statistics, 2022-2032F
- Market Size & Growth Outlook
- By Revenues in USD Million
- By Units Sold (Thousand Units)
- Market Segmentation & Growth Outlook
- By Type of Tire- Market Insights and Forecast 2022-2032, Million Units
- By Tire Size- Market Insights and Forecast 2022-2032, Million Units
- By Demand Type- Market Insights and Forecast 2022-2032, Million Units
- By Equipment Type- Market Insights and Forecast 2022-2032, Million Units
- By End User- Market Insights and Forecast 2022-2032, Million Units
- Market Size & Growth Outlook
- Canada Agriculture Tire Market Statistics, 2022-2032F
- Market Size & Growth Outlook
- By Revenues in USD Million
- By Units Sold (Thousand Units)
- Market Segmentation & Growth Outlook
- By Type of Tire- Market Insights and Forecast 2022-2032, Million Units
- By Tire Size- Market Insights and Forecast 2022-2032, Million Units
- By Demand Type- Market Insights and Forecast 2022-2032, Million Units
- By Equipment Type- Market Insights and Forecast 2022-2032, Million Units
- By End User- Market Insights and Forecast 2022-2032, Million Units
- Market Size & Growth Outlook
- Mexico Agriculture Tire Market Statistics, 2022-2032F
- Market Size & Growth Outlook
- By Revenues in USD Million
- By Units Sold (Thousand Units)
- Market Segmentation & Growth Outlook
- By Type of Tire- Market Insights and Forecast 2022-2032, Million Units
- By Tire Size- Market Insights and Forecast 2022-2032, Million Units
- By Demand Type- Market Insights and Forecast 2022-2032, Million Units
- By Equipment Type- Market Insights and Forecast 2022-2032, Million Units
- By End User- Market Insights and Forecast 2022-2032, Million Units
- Market Size & Growth Outlook
- Market Size & Growth Outlook
- South America Agriculture Tire Market Statistics, 2022-2032F
- Market Size & Growth Outlook
- By Revenues in USD Million
- By Units Sold (Thousand Units)
- Market Segmentation & Growth Outlook
- By Type of Tire- Market Insights and Forecast 2022-2032, Million Units
- By Tire Size- Market Insights and Forecast 2022-2032, Million Units
- By Demand Type- Market Insights and Forecast 2022-2032, Million Units
- By Equipment Type- Market Insights and Forecast 2022-2032, Million Units
- By End User- Market Insights and Forecast 2022-2032, Million Units
- By Country
- Brazil
- Argentina
- Rest of South America
- Brazil Agriculture Tire Market Statistics, 2022-2032F
- Market Size & Growth Outlook
- By Revenues in USD Million
- By Units Sold (Thousand Units)
- Market Segmentation & Growth Outlook
- By Type of Tire- Market Insights and Forecast 2022-2032, Million Units
- By Tire Size- Market Insights and Forecast 2022-2032, Million Units
- By Demand Type- Market Insights and Forecast 2022-2032, Million Units
- By Equipment Type- Market Insights and Forecast 2022-2032, Million Units
- By End User- Market Insights and Forecast 2022-2032, Million Units
- Market Size & Growth Outlook
- Argentina Agriculture Tire Market Statistics, 2022-2032F
- Market Size & Growth Outlook
- By Revenues in USD Million
- By Units Sold (Thousand Units)
- Market Segmentation & Growth Outlook
- By Type of Tire- Market Insights and Forecast 2022-2032, Million Units
- By Tire Size- Market Insights and Forecast 2022-2032, Million Units
- By Demand Type- Market Insights and Forecast 2022-2032, Million Units
- By Equipment Type- Market Insights and Forecast 2022-2032, Million Units
- By End User- Market Insights and Forecast 2022-2032, Million Units
- Market Size & Growth Outlook
- Market Size & Growth Outlook
- Europe Agriculture Tire Market Statistics, 2022-2032F
- Market Size & Growth Outlook
- By Revenues in USD Million
- By Units Sold (Thousand Units)
- Market Segmentation & Growth Outlook
- By Type of Tire- Market Insights and Forecast 2022-2032, Million Units
- By Tire Size- Market Insights and Forecast 2022-2032, Million Units
- By Demand Type- Market Insights and Forecast 2022-2032, Million Units
- By Equipment Type- Market Insights and Forecast 2022-2032, Million Units
- By End User- Market Insights and Forecast 2022-2032, Million Units
- By Country
- Germany
- UK
- France
- Italy
- Spain
- Denmark
- Sweden
- Rest of Europe
- Germany Agriculture Tire Market Statistics, 2022-2032F
- Market Size & Growth Outlook
- By Revenues in USD Million
- By Units Sold (Thousand Units)
- Market Segmentation & Growth Outlook
- By Type of Tire- Market Insights and Forecast 2022-2032, Million Units
- By Tire Size- Market Insights and Forecast 2022-2032, Million Units
- By Demand Type- Market Insights and Forecast 2022-2032, Million Units
- By Equipment Type- Market Insights and Forecast 2022-2032, Million Units
- By End User- Market Insights and Forecast 2022-2032, Million Units
- Market Size & Growth Outlook
- UK Agriculture Tire Market Statistics, 2022-2032F
- Market Size & Growth Outlook
- By Revenues in USD Million
- By Units Sold (Thousand Units)
- Market Segmentation & Growth Outlook
- By Type of Tire- Market Insights and Forecast 2022-2032, Million Units
- By Tire Size- Market Insights and Forecast 2022-2032, Million Units
- By Demand Type- Market Insights and Forecast 2022-2032, Million Units
- By Equipment Type- Market Insights and Forecast 2022-2032, Million Units
- By End User- Market Insights and Forecast 2022-2032, Million Units
- Market Size & Growth Outlook
- France Agriculture Tire Market Statistics, 2022-2032F
- Market Size & Growth Outlook
- By Revenues in USD Million
- By Units Sold (Thousand Units)
- Market Segmentation & Growth Outlook
- By Type of Tire- Market Insights and Forecast 2022-2032, Million Units
- By Tire Size- Market Insights and Forecast 2022-2032, Million Units
- By Demand Type- Market Insights and Forecast 2022-2032, Million Units
- By Equipment Type- Market Insights and Forecast 2022-2032, Million Units
- By End User- Market Insights and Forecast 2022-2032, Million Units
- Market Size & Growth Outlook
- Italy Agriculture Tire Market Statistics, 2022-2032F
- Market Size & Growth Outlook
- By Revenues in USD Million
- By Units Sold (Thousand Units)
- Market Segmentation & Growth Outlook
- By Type of Tire- Market Insights and Forecast 2022-2032, Million Units
- By Tire Size- Market Insights and Forecast 2022-2032, Million Units
- By Demand Type- Market Insights and Forecast 2022-2032, Million Units
- By Equipment Type- Market Insights and Forecast 2022-2032, Million Units
- By End User- Market Insights and Forecast 2022-2032, Million Units
- Market Size & Growth Outlook
- Spain Agriculture Tire Market Statistics, 2022-2032F
- Market Size & Growth Outlook
- By Revenues in USD Million
- By Units Sold (Thousand Units)
- Market Segmentation & Growth Outlook
- By Type of Tire- Market Insights and Forecast 2022-2032, Million Units
- By Tire Size- Market Insights and Forecast 2022-2032, Million Units
- By Demand Type- Market Insights and Forecast 2022-2032, Million Units
- By Equipment Type- Market Insights and Forecast 2022-2032, Million Units
- By End User- Market Insights and Forecast 2022-2032, Million Units
- Market Size & Growth Outlook
- Denmark Agriculture Tire Market Statistics, 2022-2032F
- Market Size & Growth Outlook
- By Revenues in USD Million
- By Units Sold (Thousand Units)
- Market Segmentation & Growth Outlook
- By Type of Tire- Market Insights and Forecast 2022-2032, Million Units
- By Tire Size- Market Insights and Forecast 2022-2032, Million Units
- By Demand Type- Market Insights and Forecast 2022-2032, Million Units
- By Equipment Type- Market Insights and Forecast 2022-2032, Million Units
- By End User- Market Insights and Forecast 2022-2032, Million Units
- Market Size & Growth Outlook
- Sweden Agriculture Tire Market Statistics, 2022-2032F
- Market Size & Growth Outlook
- By Revenues in USD Million
- By Units Sold (Thousand Units)
- Market Segmentation & Growth Outlook
- By Type of Tire- Market Insights and Forecast 2022-2032, Million Units
- By Tire Size- Market Insights and Forecast 2022-2032, Million Units
- By Demand Type- Market Insights and Forecast 2022-2032, Million Units
- By Equipment Type- Market Insights and Forecast 2022-2032, Million Units
- By End User- Market Insights and Forecast 2022-2032, Million Units
- Market Size & Growth Outlook
- Market Size & Growth Outlook
- Middle East & Africa Agriculture Tire Market Statistics, 2022-2032F
- Market Size & Growth Outlook
- By Revenues in USD Million
- By Units Sold (Thousand Units)
- Market Segmentation & Growth Outlook
- By Type of Tire- Market Insights and Forecast 2022-2032, Million Units
- By Tire Size- Market Insights and Forecast 2022-2032, Million Units
- By Demand Type- Market Insights and Forecast 2022-2032, Million Units
- By Equipment Type- Market Insights and Forecast 2022-2032, Million Units
- By End User- Market Insights and Forecast 2022-2032, Million Units
- By Country
- Saudi Arabia
- UAE
- Egypt
- South Africa
- Rest of Middle East & Africa
- Saudi Arabia Agriculture Tire Market Statistics, 2022-2032F
- Market Size & Growth Outlook
- By Revenues in USD Million
- By Units Sold (Thousand Units)
- Market Segmentation & Growth Outlook
- By Type of Tire- Market Insights and Forecast 2022-2032, Million Units
- By Tire Size- Market Insights and Forecast 2022-2032, Million Units
- By Demand Type- Market Insights and Forecast 2022-2032, Million Units
- By Equipment Type- Market Insights and Forecast 2022-2032, Million Units
- By End User- Market Insights and Forecast 2022-2032, Million Units
- Market Size & Growth Outlook
- UAE Agriculture Tire Market Statistics, 2022-2032F
- Market Size & Growth Outlook
- By Revenues in USD Million
- By Units Sold (Thousand Units)
- Market Segmentation & Growth Outlook
- By Type of Tire- Market Insights and Forecast 2022-2032, Million Units
- By Tire Size- Market Insights and Forecast 2022-2032, Million Units
- By Demand Type- Market Insights and Forecast 2022-2032, Million Units
- By Equipment Type- Market Insights and Forecast 2022-2032, Million Units
- By End User- Market Insights and Forecast 2022-2032, Million Units
- Market Size & Growth Outlook
- Egypt Agriculture Tire Market Statistics, 2022-2032F
- Market Size & Growth Outlook
- By Revenues in USD Million
- By Units Sold (Thousand Units)
- Market Segmentation & Growth Outlook
- By Type of Tire- Market Insights and Forecast 2022-2032, Million Units
- By Tire Size- Market Insights and Forecast 2022-2032, Million Units
- By Demand Type- Market Insights and Forecast 2022-2032, Million Units
- By Equipment Type- Market Insights and Forecast 2022-2032, Million Units
- By End User- Market Insights and Forecast 2022-2032, Million Units
- Market Size & Growth Outlook
- South Africa Agriculture Tire Market Statistics, 2022-2032F
- Market Size & Growth Outlook
- By Revenues in USD Million
- By Units Sold (Thousand Units)
- Market Segmentation & Growth Outlook
- By Type of Tire- Market Insights and Forecast 2022-2032, Million Units
- By Tire Size- Market Insights and Forecast 2022-2032, Million Units
- By Demand Type- Market Insights and Forecast 2022-2032, Million Units
- By Equipment Type- Market Insights and Forecast 2022-2032, Million Units
- By End User- Market Insights and Forecast 2022-2032, Million Units
- Market Size & Growth Outlook
- Market Size & Growth Outlook
- Asia Pacific Agriculture Tire Market Statistics, 2022-2032F
- Market Size & Growth Outlook
- By Revenues in USD Million
- By Units Sold (Thousand Units)
- Market Segmentation & Growth Outlook
- By Type of Tire- Market Insights and Forecast 2022-2032, Million Units
- By Tire Size- Market Insights and Forecast 2022-2032, Million Units
- By Demand Type- Market Insights and Forecast 2022-2032, Million Units
- By Equipment Type- Market Insights and Forecast 2022-2032, Million Units
- By End User- Market Insights and Forecast 2022-2032, Million Units
- By Country
- China
- India
- Japan
- South Korea
- Australia
- Thailand
- Rest of Asia Pacific
- China Agriculture Tire Market Statistics, 2022-2032F
- Market Size & Growth Outlook
- By Revenues in USD Million
- By Units Sold (Thousand Units)
- Market Segmentation & Growth Outlook
- By Type of Tire- Market Insights and Forecast 2022-2032, Million Units
- By Tire Size- Market Insights and Forecast 2022-2032, Million Units
- By Demand Type- Market Insights and Forecast 2022-2032, Million Units
- By Equipment Type- Market Insights and Forecast 2022-2032, Million Units
- By End User- Market Insights and Forecast 2022-2032, Million Units
- Market Size & Growth Outlook
- India Agriculture Tire Market Statistics, 2022-2032F
- Market Size & Growth Outlook
- By Revenues in USD Million
- By Units Sold (Thousand Units)
- Market Segmentation & Growth Outlook
- By Type of Tire- Market Insights and Forecast 2022-2032, Million Units
- By Tire Size- Market Insights and Forecast 2022-2032, Million Units
- By Demand Type- Market Insights and Forecast 2022-2032, Million Units
- By Equipment Type- Market Insights and Forecast 2022-2032, Million Units
- By End User- Market Insights and Forecast 2022-2032, Million Units
- Market Size & Growth Outlook
- Japan Agriculture Tire Market Statistics, 2022-2032F
- Market Size & Growth Outlook
- By Revenues in USD Million
- By Units Sold (Thousand Units)
- Market Segmentation & Growth Outlook
- By Type of Tire- Market Insights and Forecast 2022-2032, Million Units
- By Tire Size- Market Insights and Forecast 2022-2032, Million Units
- By Demand Type- Market Insights and Forecast 2022-2032, Million Units
- By Equipment Type- Market Insights and Forecast 2022-2032, Million Units
- By End User- Market Insights and Forecast 2022-2032, Million Units
- Market Size & Growth Outlook
- South Korea Agriculture Tire Market Statistics, 2022-2032F
- Market Size & Growth Outlook
- By Revenues in USD Million
- By Units Sold (Thousand Units)
- Market Segmentation & Growth Outlook
- By Type of Tire- Market Insights and Forecast 2022-2032, Million Units
- By Tire Size- Market Insights and Forecast 2022-2032, Million Units
- By Demand Type- Market Insights and Forecast 2022-2032, Million Units
- By Equipment Type- Market Insights and Forecast 2022-2032, Million Units
- By End User- Market Insights and Forecast 2022-2032, Million Units
- Market Size & Growth Outlook
- Australia Agriculture Tire Market Statistics, 2022-2032F
- Market Size & Growth Outlook
- By Revenues in USD Million
- By Units Sold (Thousand Units)
- Market Segmentation & Growth Outlook
- By Type of Tire- Market Insights and Forecast 2022-2032, Million Units
- By Tire Size- Market Insights and Forecast 2022-2032, Million Units
- By Demand Type- Market Insights and Forecast 2022-2032, Million Units
- By Equipment Type- Market Insights and Forecast 2022-2032, Million Units
- By End User- Market Insights and Forecast 2022-2032, Million Units
- Market Size & Growth Outlook
- Thailand Agriculture Tire Market Statistics, 2022-2032F
- Market Size & Growth Outlook
- By Revenues in USD Million
- By Units Sold (Thousand Units)
- Market Segmentation & Growth Outlook
- By Type of Tire- Market Insights and Forecast 2022-2032, Million Units
- By Tire Size- Market Insights and Forecast 2022-2032, Million Units
- By Demand Type- Market Insights and Forecast 2022-2032, Million Units
- By Equipment Type- Market Insights and Forecast 2022-2032, Million Units
- By End User- Market Insights and Forecast 2022-2032, Million Units
- Market Size & Growth Outlook
- Market Size & Growth Outlook
- Competitive Outlook
- Company Profiles
- Michelin
- Business Description
- Product Portfolio
- Collaborations & Alliances
- Recent Developments
- Financial Details
- Others
- Bridgestone
- Business Description
- Product Portfolio
- Collaborations & Alliances
- Recent Developments
- Financial Details
- Others
- Balkrishna Industries Limited (BKT)
- Business Description
- Product Portfolio
- Collaborations & Alliances
- Recent Developments
- Financial Details
- Others
- Nokian
- Business Description
- Product Portfolio
- Collaborations & Alliances
- Recent Developments
- Financial Details
- Others
- CEAT Ltd.
- Business Description
- Product Portfolio
- Collaborations & Alliances
- Recent Developments
- Financial Details
- Others
- Continental AG
- Business Description
- Product Portfolio
- Collaborations & Alliances
- Recent Developments
- Financial Details
- Others
- JK Tyre & Industries Ltd.
- Business Description
- Product Portfolio
- Collaborations & Alliances
- Recent Developments
- Financial Details
- Others
- MRF Limited
- Business Description
- Product Portfolio
- Collaborations & Alliances
- Recent Developments
- Financial Details
- Others
- Specialty Tires of America Inc.
- Business Description
- Product Portfolio
- Collaborations & Alliances
- Recent Developments
- Financial Details
- Others
- Sumitomo Rubber Industries Ltd.
- Business Description
- Product Portfolio
- Collaborations & Alliances
- Recent Developments
- Financial Details
- Others
- Pirelli
- Business Description
- Product Portfolio
- Collaborations & Alliances
- Recent Developments
- Financial Details
- Others
- The Carlstar Group LLC
- Business Description
- Product Portfolio
- Collaborations & Alliances
- Recent Developments
- Financial Details
- Others
- Titan International Inc.
- Business Description
- Product Portfolio
- Collaborations & Alliances
- Recent Developments
- Financial Details
- Others
- Trelleborg AB
- Business Description
- Product Portfolio
- Collaborations & Alliances
- Recent Developments
- Financial Details
- Others
- Yokohama (Including Its Brands)
- Business Description
- Product Portfolio
- Collaborations & Alliances
- Recent Developments
- Financial Details
- Others
- Triangle Tires
- Business Description
- Product Portfolio
- Collaborations & Alliances
- Recent Developments
- Financial Details
- Others
- Linglong Tire
- Business Description
- Product Portfolio
- Collaborations & Alliances
- Recent Developments
- Financial Details
- Others
- Double Coin Tires
- Business Description
- Product Portfolio
- Collaborations & Alliances
- Recent Developments
- Financial Details
- Others
- 13.1.18.7.
- Michelin
- Company Profiles
- Disclaimer
| Segment | Sub-Segment |
|---|---|
| By Type of Tire |
|
| By Tire Size |
|
| By Demand Type |
|
| By Equipment Type |
|
| By End User |
|
| By Region |
|
Research Methodology
This study followed a structured approach comprising four key phases to assess the size and scope of the electro-oxidation market. The process began with thorough secondary research to collect data on the target market, related markets, and broader industry context. These findings, along with preliminary assumptions and estimates, were then validated through extensive primary research involving industry experts from across the value chain. To calculate the overall market size, both top-down and bottom-up methodologies were employed. Finally, market segmentation and data triangulation techniques were applied to refine and validate segment-level estimations.
Secondary Research
The secondary research phase involved gathering data from a wide range of credible and published sources. This step helped in identifying industry trends, defining market segmentation, and understanding the market landscape and value chain.
Sources consulted during this phase included:
- Company annual reports, investor presentations, and press releases
- Industry white papers and certified publications
- Trade directories and market-recognized databases
- Articles from authoritative authors and reputable journals
- Gold and silver standard websites
Secondary research was critical in mapping out the industry's value chain and monetary flow, identifying key market segments, understanding regional variations, and tracking significant industry developments.
Other key sources:
- Financial disclosures
- Industry associations and trade bodies
- News outlets and business magazines
- Academic journals and research studies
- Paid industry databases
Primary Research
To validate secondary data and gain deeper market insights, primary research was conducted with key stakeholders across both the supply and demand sides of the market.
On the demand side, participants included decision-makers and influencers from end-user industries—such as CIOs, CTOs, and CSOs—who provided first-hand perspectives on market needs, product usage, and future expectations.
On the supply side, interviews were conducted with manufacturers, industry associations, and institutional participants to gather insights into current offerings, product pipelines, and market challenges.
Primary interviews provided critical inputs such as:
- Market size and revenue data
- Product and service breakdowns
- Market forecasts
- Regional and application-specific trends
Stakeholders consulted included:
- Leading OEM and solution providers
- Channel and distribution partners
- End users across various applications
- Independent consultants and industry specialists
Market Size Estimation and Data Triangulation
- Identifying Key Market Participants (Secondary Research)
- Goal: To identify the major players or companies in the target market. This typically involves using publicly available data sources such as industry reports, market research publications, and financial statements of companies.
- Tools: Reports from firms like Gartner, Forrester, Euromonitor, Statista, IBISWorld, and others. Public financial statements, news articles, and press releases from top market players.
- Extracting Earnings of Key Market Participants
- Goal: To estimate the earnings generated from the product or service being analyzed. This step helps in understanding the revenue potential of each market player in a specific geography.
- Methods: Earnings data can be gathered from:
- Publicly available financial reports (for listed companies).
- Interviews and primary data sources from professionals, such as Directors, VPs, SVPs, etc. This is especially useful for understanding more nuanced, internal data that isn't publicly disclosed.
- Annual reports and investor presentations of key players.
- Data Collation and Development of a Relevant Data Model
- Goal: To collate inputs from both primary and secondary sources into a structured, data-driven model for market estimation. This model will incorporate key market KPIs and any independent variables relevant to the market.
- Key KPIs: These could include:
- Market size, growth rate, and demand drivers.
- Industry-specific metrics like market share, average revenue per customer (ARPC), or average deal size.
- External variables, such as economic growth rates, inflation rates, or commodity prices, that could affect the market.
- Data Modeling: Based on this data, the market forecasts are developed for the next 5 years. A combination of trend analysis, scenario modeling, and statistical regression might be used to generate projections.
- Scenario Analysis
- Goal: To test different assumptions and validate how sensitive the market is to changes in key variables (e.g., market demand, regulatory changes, technological disruptions).
- Types of Scenarios:
- Base Case: Based on current assumptions and historical data.
- Best-Case Scenario: Assuming favorable market conditions, regulatory environments, and technological advancements.
- Worst-Case Scenario: Accounting for adverse factors, such as economic downturns, stricter regulations, or unexpected disruptions.


