Vietnam Alcoholic Drinks Market Report: Trends, Growth and Forecast (2026-2032)
By Type (Beer, Cider/Perry, RTDs, Spirits, Wine), By Alcohol Content (High, Medium, Low), By Flavor (Unflavored, Flavored), By Packaging Type (Glass Bottles, Tins, Plastic Bottles, Others), By Sales Channel (On-Trade, Off-Trade (Retail Offline, Retail Online)) ... Read more

|
Major Players
|
Vietnam Alcoholic Drinks Market Statistics and Insights, 2026
- Market Size Statistics
- Alcoholic Drinks in Vietnam is estimated at $ 10.49 Billion.
- The market size is expected to grow to $ 15.06 Billion by 2032.
- Market to register a CAGR of around 5.3% during 2026-32.
- Type Shares
- Beer grabbed market share of 85%.
- Beer to witness a volume CAGR of around 3.59%.
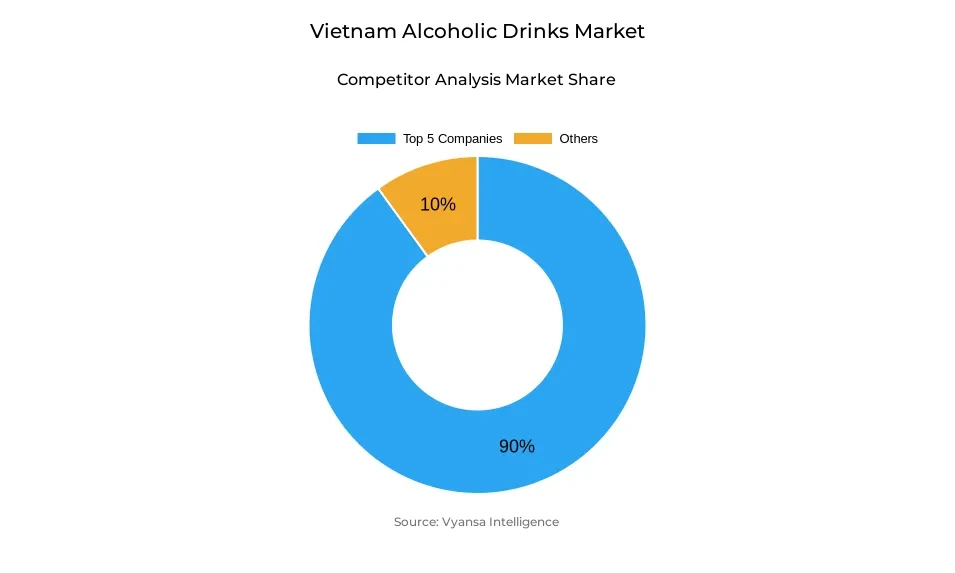
- Competition
- More than 10 companies are actively engaged in producing Alcoholic Drinks in Vietnam .
- Top 5 companies acquired 90% of the market share.
- Anheuser-Busch InBev NV, San Miguel Corp, Oetker-Gruppe, Heineken NV, Thai Beverage PCL etc., are few of the top companies.
- Sales Channel
- Off-Trade grabbed 51% of the market.
Vietnam Alcoholic Drinks Market Outlook
The Vietnam Alcoholic Drinks Market, which stood at USD 10.49 billion in 2025, is expected to grow to USD 15.06 billion by 2032, marking constant growth amid regulation difficulties and evolving end users patterns. Beer remains the most consumed beverage, bolstered by Vietnam's warm climate, high drinking culture, and application of beer in social settings and celebratory events like the Lunar New Year. During the forecast period, beer shall maintain a volume CAGR of approximately 3.59% as a result of increased demand for premium lagers and sustained investment by major players.
Government curbs, including more stringent enforcement of Decree 100 on alcohol driving, continue to be a challenge to on-trade sales. Nevertheless, end users are resorting increasingly to pre-booking ride-hailing services or moving beer drinking to home environments. Meanwhile, the market is experiencing a premiumisation trend, with rich town professionals prepared to upgrade to better-quality goods, including imported spirits, wines, and premium beers.
Wine is also likely to experience higher momentum, driven by inbound tourism and the increasing popularity of Western dining culture. Various wine festivals and promotional activities are opening Vietnamese end users to international brands, while cocktail culture and imported beverages like soju are still growing among younger end users.
From a retailing point of view, off-trade channels held 51% of the market, led by small local grocery stores and a growing share of supermarkets and convenience stores. Retail e-commerce is also growing rapidly, with sites like Shopee and TikTok presenting offers and free shipping schemes. With this blend of robust domestic demand, premiumisation, and new retail expansion, the Vietnamese Alcoholic Drinks market is poised for sustained growth up to 2032
Vietnam Alcoholic Drinks Market Growth Driver
Premiumisation Influencing end users Decisions
Premiumisation is a key driver of the Vietnam Alcoholic Drinks Market. Shoppers are becoming more willing to pay extra for higher-quality drinks, with premium lager and imported spirits becoming popular. Local end users are eager to upgrade their drinking experience, moving away from cheap traditional drinks towards more sophisticated options. This trend is particularly apparent among wealthier urban professionals who value quality over quantity.
Beer is still the most consumed beverage, but premium products within the segment are showing growth. Imported wine and spirits are gaining traction as well, with increasing exposure through festivals, promotions, and tourism. This emphasis on upgrading shows the effect of premiumisation on end users appetite and contributing to market growth in multiple segments.
Vietnam Alcoholic Drinks Market Trend
Growth of Wine and Cocktail Culture
Increased wine and cocktail culture is a palpable trend in the Vietnam Alcoholic Drinks Market. Wine is being used more frequently with meals, with end users being shown more international brands through tourism and festivals. The event WineFest 2024 illustrates the way cultural promotions are increasing awareness and bringing wine into lifestyle product status among Vietnamese end users.
Cocktail culture is also evolving, particularly in urban areas. Foreign spirits like soju are becoming popular, aided by the popularity of Korean pop culture. Young adults are playing around with new tastes and premium spirits, which is a movement towards experiential consumption. The trend suggests a slow evolution of alcoholic drink preferences away from the conventional beer dominance.
Unlock Market Intelligence
Explore the market potential with our data-driven report
Vietnam Alcoholic Drinks Market Opportunity
Growth of Contemporary Retail and E-Commerce
The market is set to witness strong growth, driven by the expansion of modern retail and e-commerce channels in Vietnam. Supermarkets, hypermarkets, and convenience stores are continuously growing, offering wider availability of premium and imported alcoholic drinks. These stores appeal to changing urban lifestyles and prompt end users to try higher-end alternatives.
E-commerce websites like Shopee, TikTok, and Lazada will also push sales with promotions, coupons, and free shipping. As buying habits move online, Alcoholic Drinks will see more of digital exposure and accessibility. This shift in channels of distribution will create new opportunity for brands to capture demand, particularly among young, digitally inclined end users.
Unlock Market Intelligence
Explore the market potential with our data-driven report
Vietnam Alcoholic Drinks Market Segmentation Analysis

By Type
- Beer
- Cider/Perry
- RTDs
- Spirits
- Wine
The segment with highest market share under segment type is Beer with a market share of approximately 85% of the Vietnam Alcoholic Drinks Market. Beer continues to be a cultural icon, being widely consumed during social events, business activities, and festive celebrations like the Lunar New Year. The hot and humid climate of Vietnam also favors the popularity of beer as a cooling beverage over wine or spirits.
During the forecast period, beer will post a volume CAGR of approximately 3.59% on the back of mass-market as well as premium products. Premium lager, in specific, is further reinforcing its position as end users increasingly opt for quality products. This supremacy means beer continues to be the pillar of the Vietnamese Alcoholic Drinks market, with other categories such as wine and spirits gradually gaining share.
By Sales Channel
- On-Trade
- Off-Trade
The segment with highest market share under sales channel is Off-Trade, controlling approximately 51% of Vietnam Alcoholic Drinks Market. Small neighborhood grocers lead the channel, being widespread throughout neighborhoods and being easily flexible to accommodate the local end users' needs. In spite of this, their market share is slowly diminishing because of the fast development of modern retail.
Supermarkets, hypermarkets, and convenience stores are increasingly dominating alcoholic beverage distribution. E-commerce is also gaining momentum as the fastest-growing channel on the strength of promotions and discounts provided by platforms like Shopee and TikTok. Off-trade strength ensures regular availability and accessibility of alcoholic drinks and hence remains the largest selling channel during the forecast period.
Top Companies in Vietnam Alcoholic Drinks Market
The top companies operating in the market include Anheuser-Busch InBev NV, San Miguel Corp, Oetker-Gruppe, Heineken NV, Thai Beverage PCL, Carlsberg A/S, Hanoi Alcohol Beer & Beverages Corp (Habeco), Sapporo Holdings Ltd, Bitburger Braugruppe GmbH, Saigon Alcohol Beer & Beverages Corp (Sabeco), etc., are the top players operating in the Vietnam Alcoholic Drinks Market.
Frequently Asked Questions
Related Report
1. Market Segmentation
1.1. Research Scope
1.2. Research Methodology
1.3. Definitions and Assumptions
2. Executive Summary
3. Vietnam Alcoholic Drinks Market Policies, Regulations, and Standards
4. Vietnam Alcoholic Drinks Market Dynamics
4.1. Growth Factors
4.2. Challenges
4.3. Trends
4.4. Opportunities
5. Vietnam Alcoholic Drinks Market Statistics, 2022-2032F
5.1. Market Size & Growth Outlook
5.1.1. By Revenues in US$ Million
5.1.2. By Quantity Sold in Million Litres
5.2. Market Segmentation & Growth Outlook
5.2.1. By Type
5.2.1.1. Beer- Market Insights and Forecast 2022-2032, USD Million
5.2.1.2. Cider/Perry- Market Insights and Forecast 2022-2032, USD Million
5.2.1.3. RTDs- Market Insights and Forecast 2022-2032, USD Million
5.2.1.4. Spirits- Market Insights and Forecast 2022-2032, USD Million
5.2.1.5. Wine- Market Insights and Forecast 2022-2032, USD Million
5.2.2. By Alcohol Content
5.2.2.1. High- Market Insights and Forecast 2022-2032, USD Million
5.2.2.2. Medium- Market Insights and Forecast 2022-2032, USD Million
5.2.2.3. Low- Market Insights and Forecast 2022-2032, USD Million
5.2.3. By Flavor
5.2.3.1. Unflavored- Market Insights and Forecast 2022-2032, USD Million
5.2.3.2. Flavored- Market Insights and Forecast 2022-2032, USD Million
5.2.4. By Packaging Type
5.2.4.1. Glass Bottles- Market Insights and Forecast 2022-2032, USD Million
5.2.4.2. Tins- Market Insights and Forecast 2022-2032, USD Million
5.2.4.3. Plastic Bottles- Market Insights and Forecast 2022-2032, USD Million
5.2.4.4. Others- Market Insights and Forecast 2022-2032, USD Million
5.2.5. By Sales Channel
5.2.5.1. On-Trade- Market Insights and Forecast 2022-2032, USD Million
5.2.5.2. Off-Trade- Market Insights and Forecast 2022-2032, USD Million
5.2.5.2.1. Retail Offline- Market Insights and Forecast 2022-2032, USD Million
5.2.5.2.2. Retail Online- Market Insights and Forecast 2022-2032, USD Million
5.2.6. By Competitors
5.2.6.1. Competition Characteristics
5.2.6.2. Market Share & Analysis
6. Vietnam Beer Market Statistics, 2022-2032F
6.1. Market Size & Growth Outlook
6.1.1. By Revenues in US$ Million
6.1.2. By Quantity Sold in Million Litres
6.2. Market Segmentation & Growth Outlook
6.2.1. By Alcohol Content- Market Insights and Forecast 2022-2032, USD Million
6.2.2. By Flavor- Market Insights and Forecast 2022-2032, USD Million
6.2.3. By Packaging Type- Market Insights and Forecast 2022-2032, USD Million
6.2.4. By Sales Channel- Market Insights and Forecast 2022-2032, USD Million
7. Vietnam Cider/Perry Market Statistics, 2022-2032F
7.1. Market Size & Growth Outlook
7.1.1. By Revenues in US$ Million
7.1.2. By Quantity Sold in Million Litres
7.2. Market Segmentation & Growth Outlook
7.2.1. By Alcohol Content- Market Insights and Forecast 2022-2032, USD Million
7.2.2. By Flavor- Market Insights and Forecast 2022-2032, USD Million
7.2.3. By Packaging Type- Market Insights and Forecast 2022-2032, USD Million
7.2.4. By Sales Channel- Market Insights and Forecast 2022-2032, USD Million
8. Vietnam Ready-to-Drink Market Statistics, 2022-2032F
8.1. Market Size & Growth Outlook
8.1.1. By Revenues in US$ Million
8.1.2. By Quantity Sold in Million Litres
8.2. Market Segmentation & Growth Outlook
8.2.1. By Alcohol Content- Market Insights and Forecast 2022-2032, USD Million
8.2.2. By Flavor- Market Insights and Forecast 2022-2032, USD Million
8.2.3. By Packaging Type- Market Insights and Forecast 2022-2032, USD Million
8.2.4. By Sales Channel- Market Insights and Forecast 2022-2032, USD Million
9. Vietnam Spirits Market Statistics, 2022-2032F
9.1. Market Size & Growth Outlook
9.1.1. By Revenues in US$ Million
9.1.2. By Quantity Sold in Million Litres
9.2. Market Segmentation & Growth Outlook
9.2.1. By Alcohol Content- Market Insights and Forecast 2022-2032, USD Million
9.2.2. By Flavor- Market Insights and Forecast 2022-2032, USD Million
9.2.3. By Packaging Type- Market Insights and Forecast 2022-2032, USD Million
9.2.4. By Sales Channel- Market Insights and Forecast 2022-2032, USD Million
10. Vietnam Wine Market Statistics, 2022-2032F
10.1.Market Size & Growth Outlook
10.1.1. By Revenues in US$ Million
10.1.2. By Quantity Sold in Million Litres
10.2.Market Segmentation & Growth Outlook
10.2.1. By Alcohol Content- Market Insights and Forecast 2022-2032, USD Million
10.2.2. By Flavor- Market Insights and Forecast 2022-2032, USD Million
10.2.3. By Packaging Type- Market Insights and Forecast 2022-2032, USD Million
10.2.4. By Sales Channel- Market Insights and Forecast 2022-2032, USD Million
11. Competitive Outlook
11.1.Company Profiles
11.1.1. Heineken NV
11.1.1.1. Business Description
11.1.1.2. Product Portfolio
11.1.1.3. Collaborations & Alliances
11.1.1.4. Recent Developments
11.1.1.5. Financial Details
11.1.1.6. Others
11.1.2. Thai Beverage PCL
11.1.2.1. Business Description
11.1.2.2. Product Portfolio
11.1.2.3. Collaborations & Alliances
11.1.2.4. Recent Developments
11.1.2.5. Financial Details
11.1.2.6. Others
11.1.3. Carlsberg A/S
11.1.3.1. Business Description
11.1.3.2. Product Portfolio
11.1.3.3. Collaborations & Alliances
11.1.3.4. Recent Developments
11.1.3.5. Financial Details
11.1.3.6. Others
11.1.4. Hanoi Alcohol Beer & Beverages Corp (Habeco)
11.1.4.1. Business Description
11.1.4.2. Product Portfolio
11.1.4.3. Collaborations & Alliances
11.1.4.4. Recent Developments
11.1.4.5. Financial Details
11.1.4.6. Others
11.1.5. Sapporo Holdings Ltd
11.1.5.1. Business Description
11.1.5.2. Product Portfolio
11.1.5.3. Collaborations & Alliances
11.1.5.4. Recent Developments
11.1.5.5. Financial Details
11.1.5.6. Others
11.1.6. Anheuser-Busch InBev NV
11.1.6.1. Business Description
11.1.6.2. Product Portfolio
11.1.6.3. Collaborations & Alliances
11.1.6.4. Recent Developments
11.1.6.5. Financial Details
11.1.6.6. Others
11.1.7. San Miguel Corp
11.1.7.1. Business Description
11.1.7.2. Product Portfolio
11.1.7.3. Collaborations & Alliances
11.1.7.4. Recent Developments
11.1.7.5. Financial Details
11.1.7.6. Others
11.1.8. Oetker-Gruppe
11.1.8.1. Business Description
11.1.8.2. Product Portfolio
11.1.8.3. Collaborations & Alliances
11.1.8.4. Recent Developments
11.1.8.5. Financial Details
11.1.8.6. Others
11.1.9. Bitburger Braugruppe GmbH
11.1.9.1. Business Description
11.1.9.2. Product Portfolio
11.1.9.3. Collaborations & Alliances
11.1.9.4. Recent Developments
11.1.9.5. Financial Details
11.1.9.6. Others
11.1.10. Saigon Alcohol Beer & Beverages Corp (Sabeco)
11.1.10.1. Business Description
11.1.10.2. Product Portfolio
11.1.10.3. Collaborations & Alliances
11.1.10.4. Recent Developments
11.1.10.5. Financial Details
11.1.10.6. Others
12. Disclaimer
| Segment | Sub-Segment |
|---|---|
| By Type |
|
| By Alcohol Content |
|
| By Flavor |
|
| By Packaging Type |
|
| By Sales Channel |
|
Research Methodology
This study followed a structured approach comprising four key phases to assess the size and scope of the electro-oxidation market. The process began with thorough secondary research to collect data on the target market, related markets, and broader industry context. These findings, along with preliminary assumptions and estimates, were then validated through extensive primary research involving industry experts from across the value chain. To calculate the overall market size, both top-down and bottom-up methodologies were employed. Finally, market segmentation and data triangulation techniques were applied to refine and validate segment-level estimations.
Secondary Research
The secondary research phase involved gathering data from a wide range of credible and published sources. This step helped in identifying industry trends, defining market segmentation, and understanding the market landscape and value chain.
Sources consulted during this phase included:
- Company annual reports, investor presentations, and press releases
- Industry white papers and certified publications
- Trade directories and market-recognized databases
- Articles from authoritative authors and reputable journals
- Gold and silver standard websites
Secondary research was critical in mapping out the industry's value chain and monetary flow, identifying key market segments, understanding regional variations, and tracking significant industry developments.
Other key sources:
- Financial disclosures
- Industry associations and trade bodies
- News outlets and business magazines
- Academic journals and research studies
- Paid industry databases
Primary Research
To validate secondary data and gain deeper market insights, primary research was conducted with key stakeholders across both the supply and demand sides of the market.
On the demand side, participants included decision-makers and influencers from end-user industries—such as CIOs, CTOs, and CSOs—who provided first-hand perspectives on market needs, product usage, and future expectations.
On the supply side, interviews were conducted with manufacturers, industry associations, and institutional participants to gather insights into current offerings, product pipelines, and market challenges.
Primary interviews provided critical inputs such as:
- Market size and revenue data
- Product and service breakdowns
- Market forecasts
- Regional and application-specific trends
Stakeholders consulted included:
- Leading OEM and solution providers
- Channel and distribution partners
- End users across various applications
- Independent consultants and industry specialists
Market Size Estimation and Data Triangulation
- Identifying Key Market Participants (Secondary Research)
- Goal: To identify the major players or companies in the target market. This typically involves using publicly available data sources such as industry reports, market research publications, and financial statements of companies.
- Tools: Reports from firms like Gartner, Forrester, Euromonitor, Statista, IBISWorld, and others. Public financial statements, news articles, and press releases from top market players.
- Extracting Earnings of Key Market Participants
- Goal: To estimate the earnings generated from the product or service being analyzed. This step helps in understanding the revenue potential of each market player in a specific geography.
- Methods: Earnings data can be gathered from:
- Publicly available financial reports (for listed companies).
- Interviews and primary data sources from professionals, such as Directors, VPs, SVPs, etc. This is especially useful for understanding more nuanced, internal data that isn't publicly disclosed.
- Annual reports and investor presentations of key players.
- Data Collation and Development of a Relevant Data Model
- Goal: To collate inputs from both primary and secondary sources into a structured, data-driven model for market estimation. This model will incorporate key market KPIs and any independent variables relevant to the market.
- Key KPIs: These could include:
- Market size, growth rate, and demand drivers.
- Industry-specific metrics like market share, average revenue per customer (ARPC), or average deal size.
- External variables, such as economic growth rates, inflation rates, or commodity prices, that could affect the market.
- Data Modeling: Based on this data, the market forecasts are developed for the next 5 years. A combination of trend analysis, scenario modeling, and statistical regression might be used to generate projections.
- Scenario Analysis
- Goal: To test different assumptions and validate how sensitive the market is to changes in key variables (e.g., market demand, regulatory changes, technological disruptions).
- Types of Scenarios:
- Base Case: Based on current assumptions and historical data.
- Best-Case Scenario: Assuming favorable market conditions, regulatory environments, and technological advancements.
- Worst-Case Scenario: Accounting for adverse factors, such as economic downturns, stricter regulations, or unexpected disruptions.


