US Footwear Market Report: Trends, Growth and Forecast (2026-2032)
By Category (Children's Footwear (Infants (0-9 Months) Foot Length (CM) (8.3-8.9, 9.2-9.5, 10.1-10.5), Toddlers (9 Months - 4 Years) Foot Length (CM) (10.8, 11.4-11.7, 12.1-12.7, 13.0-13.3, 14.0-14.3, 14.6-15.2, 15.6-15.9, 16.5), Little Kids (4-7 Years) Foot Length (CM) (16.8, 17.1-17.8, 18.1-18.4, 19.1-19.4, 19.7-20.6, 21.0-21.6), Big Kids (7-12 Years) Foot Length (CM) (21.9, 22.2-23.5, 24.1-24.8)), Women's Footwear (Foot Length (CM) (20.8, 21.3-21.6, 22.2-22.5, 23.0-23.8, 24.1-24.6, 25.1-25.9, 26.2-26.7, 27.6)), Men's Footwear (Foot Length (CM) (23.5, 24.1-24.8, 25.4-25.7, 26.0-26.7, 27.0-27.9, 28.3-28.6, 29.4, 30.2, 31.0-31.8))), By Product Type (Casual, Athletic/Sports, Formal, Others), By Sales Channel (Retail Online, Retail Offline), By Material (Leather, Textile, Rubber, Synthetic, Canvas), By Price (Mass, Premium), By Footwear Type (Shoes (Sneakers, Boots), Sandals & Slippers (Flip-Flops)), By Application (Conventional Footwear (Daily Wear, Work/Office Wear, Outdoor & Adventure, Sports & Fitness, Party/Occasion Wear), Functional/Therapeutic Footwear (Therapeutic/Orthopedic, Medicated Slippers, Acupressure Slippers)) ... Read more
|
Major Players
|
US Footwear Market Statistics and Insights, 2026
- Market Size Statistics
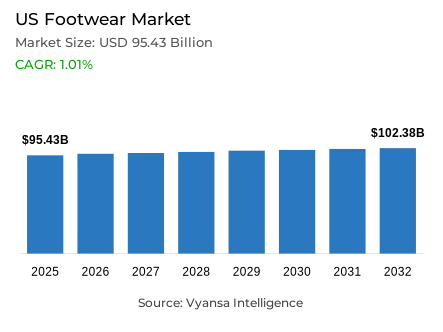
- Footwear market size in US was estimated at USD 95.43 billion in 2025.
- The market size is expected to grow to USD 102.38 billion by 2032.
- Market to register a CAGR of around 1.01% during 2026-32.
- Category Shares
- Women's footwear grabbed market share of 45%.
- Competition
- More than 20 companies are actively engaged in producing footwear in US.
- Top 5 companies acquired around 35% of the market share.
- On Inc, Caleres Inc, VF Corp, Nike Inc, adidas America Inc etc., are few of the top companies.
- Sales Channel
- Retail offline grabbed 65% of the market.
US Footwear Market Outlook
The U.S footwear market will record a consistent, moderate growth over the forecast period due to rising economic confidence and leveling inflation. Footwear sales in the United States are estimated to be USD 95.43 billion in 2025 and forecasted to be USD 102.38 billion in 2032, which is a compound annual growth rate of about 1.01%.
Although footwear exhibits a long replacement cycle relative to apparel, renewed end user confidence and slow recovery in discretionary spending will continue to drive market growth. Versatility, comfort, and value propositions will remain central to end user demand. Informalisation of workplace dress, the trend of hybrid working, and costsaving behaviour promote the purchase of shoes that may be used in multiple occasions. Retroinspired designs and classic silhouettes are projected to remain in demand, serving both sport and nonsport footwear categories.
Women footwear will continue to hold the highest market share of around 45% due to consistent demand for fashionoriented yet practical footwear, while men footwear will show comparatively stable growth driven by practicality and essential use. Sports footwear is positioned as a key growth driver, supported by high interest in health, wellness, and athleisure lifestyles. Running, pickleball, and golf continue to support demand for performancebased footwear that can also be worn daily. Midpriced footwear is expected to prevail as end users prioritise durability and longer product life cycles over frequent replacement.
Retail dynamics will continue to evolve throughout the forecast period. retail offline, accounting for approximately 65% of sales, will remain critical due to end user preference for fit assessment, comfort evaluation, and instore experience. Increased omnichannel strategies leveraging digital tools and artificial intelligence are expected to bridge physical and Retail online, supporting stable and sustainable growth in the U.S. footwear market.

US Footwear Market Growth Driver
Economic Stabilisation Restores Consumer Willingness to Spend
The key factors that have been driving the footwear market in the United States is the stabilisation of the macroeconomic conditions, which forms the basis of a cautious recovery in the discretionary spending patterns. The United States Bureau of Economic Analysis (BEA) reported that gross domestic product increased by 4.4% in the third quarter of 2025 and was strong through 2024, indicating increased economic confidence among household end users.
This is further enhanced by cooling inflation. According to the United States Bureau of Labor Statistics (BLS), headline inflation has significantly decreased as compared to its 2022 peak, with an average of 2.7% in 2025 and still declining as of 2024. With the end of price pressures, end users are showing more willingness to make delayed purchases, including footwear replacements. This is a gradual recovery and not a broadbased recovery; however, it offers a steady demand base that helps in maintaining a stable market performance.
US Footwear Market Challenge
Footwear Non-Essential Nature Limits Volume Upside
Despite the positive changes in the economic indicators, footwear is limited by the fact that it is classified as a semidiscretionary purchase category. The BEA shows that total personal consumption expenditures are increasing but the growth in spending is focused on essential services instead of durable or semidurable goods.
Moreover, the long replacement cycle of footwear decreases the number of repeat purchases. According to the American Time Use Survey and end user Expenditure data released by the United States Census Bureau, end users focus on housing, healthcare, and transportation as opposed to apparelrelated categories during times of economic uncertainty. Although inflation is declining, costofliving pressures remain, and discretionary growth is constrained, forcing brands to grow on the basis of versatility, durability, and perceived value and not volumebased growth.
Unlock Market Intelligence
Explore the market potential with our data-driven report
US Footwear Market Trend
Health and Wellness Orientation Sustains Sports Footwear Demand
A longterm trend that has influenced the United States footwear market is the longterm emphasis on health and wellness factors. The Centers for Disease Control and Prevention (CDC) reported that 46.9% of adults in the United States were engaging in aerobic physical activity in 2022, which is a significant increase in the number of people who are involved in activities related to fitness.
This change in behaviour encourages the need in sports and athleisure shoes that can move easily between the sporting, working, and leisure environments. The trend is not limited to conventional running but also to other activities like pickleball, golf, and recreational walking. With end users starting to incorporate physical activity into their everyday habits, footwear that is comfortable, supportive, and versatile continues to gain relevance, thus sustaining longterm demand of sportsinfluenced designs.
US Footwear Market Opportunity
Technology-Driven Innovation Enhances Product Differentiation
The level of technological advancement offers a significant possibility to footwear brands to distinguish themselves in a competitive market setting. The National Institute of Standards and Technology (NIST) has reported that since 2021, the U.S. has been increasing its rate of adoption of additive manufacturing and advanced materials technologies across end user goods sectors.
Simultaneously, the digital retail infrastructure is becoming stronger. According to the Census Bureau, in 2025, retail online sales represented 15.8% of all retail sales, which justifies the continued investment in digital tools that can improve end user interaction. Footwear brands that utilize artificial intelligencebased design, virtual fittings, and performance fabrics are in a stronger position to appeal to technologically oriented customers and increase the accuracy of fit and product returns.
Unlock Market Intelligence
Explore the market potential with our data-driven report
US Footwear Market Segmentation Analysis
By Category
- Children's Footwear
- Infants (0-9 Months) Foot Length (CM)
- 8.3-8.9
- 9.2-9.5
- 10.1-10.5
- Toddlers (9 Months - 4 Years) Foot Length (CM)
- 10.8
- 11.4-11.7
- 12.1-12.7
- 13.0-13.3
- 14.0-14.3
- 14.6-15.2
- 15.6-15.9
- 16.5
- Little Kids (4-7 Years) Foot Length (CM)
- 16.8
- 17.1-17.8
- 18.1-18.4
- 19.1-19.4
- 19.7-20.6
- 21.0-21.6
- Big Kids (7-12 Years) Foot Length (CM)
- 21.9
- 22.2-23.5
- 24.1-24.8
- Infants (0-9 Months) Foot Length (CM)
- Women's Footwear
- Foot Length (CM)
- 20.8
- 21.3-21.6
- 22.2-22.5
- 23.0-23.8
- 24.1-24.6
- 25.1-25.9
- 26.2-26.7
- 27.6
- Foot Length (CM)
- Men's Footwear
- Foot Length (CM)
- 23.5
- 24.1-24.8
- 25.4-25.7
- 26.0-26.7
- 27.0-27.9
- 28.3-28.6
- 29.4
- 30.2
- 31.0-31.8
- Foot Length (CM)
Women footwear represents the largest share of the U.S. footwear market, accounting for approximately 45% of total market value. This dominance reflects the broad functional and lifestyle needs of women across work, casual, social, and athletic footwear categories. The diversity of footwear requirements enhances category depth and replacement demand.
Women footwear also shows greater alignment with fashion trends and seasonal renewals, even during periods of restrained end user spending. While growth remains moderate, the size and diversification of this segment make it structurally significant. With stabilising economic confidence, women footwear continues to anchor overall market performance through steady base demand rather than rapid expansion.

By Sales Channel
- Retail Online
- Retail Offline
Retail offline represents the largest sales channel, accounting for approximately 65% of total footwear sales. Physical retail outlets remain essential in footwear purchasing decisions due to the need to assess fit, comfort, and product trial, particularly in sports and casual footwear where sizing and support directly influence usage.
Brickandmortar retail environments also support experiential shopping, brand discovery, and end user trustadvantages that online platforms cannot fully replicate. As end users increasingly value tactile product evaluation following the pandemicera retail online surge, retail offline continues to maintain its leadership position, supported by the complementary role of digital channels in guiding instore purchasing journeys.
List of Companies Covered in US Footwear Market
The companies listed below are highly influential in the US footwear market, with a significant market share and a strong impact on industry developments.
- On Inc
- Caleres Inc
- VF Corp
- Nike Inc
- adidas America Inc
- Deckers Outdoor Corp
- Skechers USA Inc
- New Balance Athletic Shoe Inc
- Crocs Inc
- Steve Madden Ltd
Competitive Landscape
The US footwear market is characterised by intense competition between established global leaders, resurgent heritage brands, and fast-growing challengers. Nike and adidas remain central players, benefiting from scale, brand recognition, and versatile sports-inspired portfolios, while adidas has gained renewed momentum from retro styles such as Samba and other heritage designs. Challenger brands including New Balance, On, ASICS, Hoka, Birkenstock, and UGG have strengthened their positions by aligning with retro aesthetics, comfort, and lifestyle versatility. Mid-priced brands dominate competition by offering durability and performance at accessible price points. As innovation becomes more critical, players investing in advanced materials, performance technologies, and omnichannel retail experiences are better positioned to capture share in an increasingly discerning and value-focused market.
Frequently Asked Questions
Related Report
1. Market Segmentation
1.1. Research Scope
1.2. Research Methodology
1.3. Definitions and Assumptions
2. Executive Summary
3. US Footwear Market Policies, Regulations, and Standards
4. US Footwear Market Dynamics
4.1. Growth Factors
4.2. Challenges
4.3. Trends
4.4. Opportunities
5. US Footwear Market Statistics, 2022-2032F
5.1. Market Size & Growth Outlook
5.1.1.By Revenues in USD Million
5.1.2.By Units Sold in Thousand Units
5.2. Market Segmentation & Growth Outlook
5.2.1.By Category
5.2.1.1. Children's Footwear- Market Insights and Forecast 2022-2032, USD Million
5.2.1.1.1. Infants (0-9 Months) Foot Length (CM)- Market Insights and Forecast 2022-2032, USD Million
5.2.1.1.1.1. 8.3-8.9- Market Insights and Forecast 2022-2032, USD Million
5.2.1.1.1.2. 9.2-9.5- Market Insights and Forecast 2022-2032, USD Million
5.2.1.1.1.3. 10.1-10.5- Market Insights and Forecast 2022-2032, USD Million
5.2.1.1.2. Toddlers (9 Months - 4 Years) Foot Length (CM)- Market Insights and Forecast 2022-2032, USD Million
5.2.1.1.2.1. 10.8- Market Insights and Forecast 2022-2032, USD Million
5.2.1.1.2.2. 11.4-11.7- Market Insights and Forecast 2022-2032, USD Million
5.2.1.1.2.3. 12.1-12.7- Market Insights and Forecast 2022-2032, USD Million
5.2.1.1.2.4. 13.0-13.3- Market Insights and Forecast 2022-2032, USD Million
5.2.1.1.2.5. 14.0-14.3- Market Insights and Forecast 2022-2032, USD Million
5.2.1.1.2.6. 14.6-15.2- Market Insights and Forecast 2022-2032, USD Million
5.2.1.1.2.7. 15.6-15.9- Market Insights and Forecast 2022-2032, USD Million
5.2.1.1.2.8. 16.5- Market Insights and Forecast 2022-2032, USD Million
5.2.1.1.3. Little Kids (4-7 Years) Foot Length (CM)- Market Insights and Forecast 2022-2032, USD Million
5.2.1.1.3.1. 16.8- Market Insights and Forecast 2022-2032, USD Million
5.2.1.1.3.2. 17.1-17.8- Market Insights and Forecast 2022-2032, USD Million
5.2.1.1.3.3. 18.1-18.4- Market Insights and Forecast 2022-2032, USD Million
5.2.1.1.3.4. 19.1-19.4- Market Insights and Forecast 2022-2032, USD Million
5.2.1.1.3.5. 19.7-20.6- Market Insights and Forecast 2022-2032, USD Million
5.2.1.1.3.6. 21.0-21.6- Market Insights and Forecast 2022-2032, USD Million
5.2.1.1.4. Big Kids (7-12 Years) Foot Length (CM)- Market Insights and Forecast 2022-2032, USD Million
5.2.1.1.4.1. 21.9- Market Insights and Forecast 2022-2032, USD Million
5.2.1.1.4.2. 22.2-23.5- Market Insights and Forecast 2022-2032, USD Million
5.2.1.1.4.3. 24.1-24.8- Market Insights and Forecast 2022-2032, USD Million
5.2.1.2. Women's Footwear- Market Insights and Forecast 2022-2032, USD Million
5.2.1.2.1. Foot Length (CM)- Market Insights and Forecast 2022-2032, USD Million
5.2.1.2.1.1. 20.8- Market Insights and Forecast 2022-2032, USD Million
5.2.1.2.1.2. 21.3-21.6- Market Insights and Forecast 2022-2032, USD Million
5.2.1.2.1.3. 22.2-22.5- Market Insights and Forecast 2022-2032, USD Million
5.2.1.2.1.4. 23.0-23.8- Market Insights and Forecast 2022-2032, USD Million
5.2.1.2.1.5. 24.1-24.6- Market Insights and Forecast 2022-2032, USD Million
5.2.1.2.1.6. 25.1-25.9- Market Insights and Forecast 2022-2032, USD Million
5.2.1.2.1.7. 26.2-26.7- Market Insights and Forecast 2022-2032, USD Million
5.2.1.2.1.8. 27.6- Market Insights and Forecast 2022-2032, USD Million
5.2.1.3. Men's Footwear- Market Insights and Forecast 2022-2032, USD Million
5.2.1.3.1. Foot Length (CM)- Market Insights and Forecast 2022-2032, USD Million
5.2.1.3.1.1. 23.5- Market Insights and Forecast 2022-2032, USD Million
5.2.1.3.1.2. 24.1-24.8- Market Insights and Forecast 2022-2032, USD Million
5.2.1.3.1.3. 25.4-25.7- Market Insights and Forecast 2022-2032, USD Million
5.2.1.3.1.4. 26.0-26.7- Market Insights and Forecast 2022-2032, USD Million
5.2.1.3.1.5. 27.0-27.9- Market Insights and Forecast 2022-2032, USD Million
5.2.1.3.1.6. 28.3-28.6- Market Insights and Forecast 2022-2032, USD Million
5.2.1.3.1.7. 29.4- Market Insights and Forecast 2022-2032, USD Million
5.2.1.3.1.8. 30.2- Market Insights and Forecast 2022-2032, USD Million
5.2.1.3.1.9. 31.0-31.8- Market Insights and Forecast 2022-2032, USD Million
5.2.2.By Product Type
5.2.2.1. Casual- Market Insights and Forecast 2022-2032, USD Million
5.2.2.2. Athletic/Sports- Market Insights and Forecast 2022-2032, USD Million
5.2.2.3. Formal- Market Insights and Forecast 2022-2032, USD Million
5.2.2.4. Others- Market Insights and Forecast 2022-2032, USD Million
5.2.3.By Sales Channel
5.2.3.1. Retail Online- Market Insights and Forecast 2022-2032, USD Million
5.2.3.2. Retail Offline- Market Insights and Forecast 2022-2032, USD Million
5.2.4.By Material
5.2.4.1. Leather- Market Insights and Forecast 2022-2032, USD Million
5.2.4.2. Textile- Market Insights and Forecast 2022-2032, USD Million
5.2.4.3. Rubber- Market Insights and Forecast 2022-2032, USD Million
5.2.4.4. Synthetic- Market Insights and Forecast 2022-2032, USD Million
5.2.4.5. Canvas- Market Insights and Forecast 2022-2032, USD Million
5.2.5.By Price
5.2.5.1. Mass- Market Insights and Forecast 2022-2032, USD Million
5.2.5.2. Premium- Market Insights and Forecast 2022-2032, USD Million
5.2.6.By Footwear Type
5.2.6.1. Shoes- Market Insights and Forecast 2022-2032, USD Million
5.2.6.1.1. Sneakers- Market Insights and Forecast 2022-2032, USD Million
5.2.6.1.2. Boots- Market Insights and Forecast 2022-2032, USD Million
5.2.6.2. Sandals & Slippers- Market Insights and Forecast 2022-2032, USD Million
5.2.6.2.1. Flip-Flops- Market Insights and Forecast 2022-2032, USD Million
5.2.7.By Application
5.2.7.1. Conventional Footwear- Market Insights and Forecast 2022-2032, USD Million
5.2.7.1.1. Daily Wear- Market Insights and Forecast 2022-2032, USD Million
5.2.7.1.2. Work/Office Wear- Market Insights and Forecast 2022-2032, USD Million
5.2.7.1.3. Outdoor & Adventure- Market Insights and Forecast 2022-2032, USD Million
5.2.7.1.4. Sports & Fitness- Market Insights and Forecast 2022-2032, USD Million
5.2.7.1.5. Party/Occasion Wear- Market Insights and Forecast 2022-2032, USD Million
5.2.7.2. Functional/Therapeutic Footwear- Market Insights and Forecast 2022-2032, USD Million
5.2.7.2.1. Therapeutic/Orthopedic- Market Insights and Forecast 2022-2032, USD Million
5.2.7.2.2. Medicated Slippers- Market Insights and Forecast 2022-2032, USD Million
5.2.7.2.3. Acupressure Slippers- Market Insights and Forecast 2022-2032, USD Million
5.2.8.By Competitors
5.2.8.1. Competition Characteristics
5.2.8.2. Market Share & Analysis
6. US Children's Footwear Market Statistics, 2022-2032
6.1. Market Size & Growth Outlook
6.1.1.By Revenues in USD Million
6.1.2.By Units Sold in Thousand Units
6.2. Market Segmentation & Growth Outlook
6.2.1.By Category- Market Insights and Forecast 2022-2032, USD Million
6.2.2.By Product Type- Market Insights and Forecast 2022-2032, USD Million
6.2.3.By Sales Channel- Market Insights and Forecast 2022-2032, USD Million
6.2.4.By Material- Market Insights and Forecast 2022-2032, USD Million
6.2.5.By Price- Market Insights and Forecast 2022-2032, USD Million
6.2.6.By Footwear Type- Market Insights and Forecast 2022-2032, USD Million
6.2.7.By Application- Market Insights and Forecast 2022-2032, USD Million
7. US Women's Footwear Market Statistics, 2022-2032
7.1. Market Size & Growth Outlook
7.1.1.By Revenues in USD Million
7.1.2.By Units Sold in Thousand Units
7.2. Market Segmentation & Growth Outlook
7.2.1.By Category- Market Insights and Forecast 2022-2032, USD Million
7.2.2.By Product Type- Market Insights and Forecast 2022-2032, USD Million
7.2.3.By Sales Channel- Market Insights and Forecast 2022-2032, USD Million
7.2.4.By Material- Market Insights and Forecast 2022-2032, USD Million
7.2.5.By Price- Market Insights and Forecast 2022-2032, USD Million
7.2.6.By Footwear Type- Market Insights and Forecast 2022-2032, USD Million
7.2.7.By Application- Market Insights and Forecast 2022-2032, USD Million
8. US Men's Footwear Market Statistics, 2022-2032
8.1. Market Size & Growth Outlook
8.1.1.By Revenues in USD Million
8.1.2.By Units Sold in Thousand Units
8.2. Market Segmentation & Growth Outlook
8.2.1.By Category- Market Insights and Forecast 2022-2032, USD Million
8.2.2.By Product Type- Market Insights and Forecast 2022-2032, USD Million
8.2.3.By Sales Channel- Market Insights and Forecast 2022-2032, USD Million
8.2.4.By Material- Market Insights and Forecast 2022-2032, USD Million
8.2.5.By Price- Market Insights and Forecast 2022-2032, USD Million
8.2.6.By Footwear Type- Market Insights and Forecast 2022-2032, USD Million
8.2.7.By Application- Market Insights and Forecast 2022-2032, USD Million
9. Competitive Outlook
9.1. Company Profiles
9.1.1.Nike Inc
9.1.1.1. Business Description
9.1.1.2. Product Portfolio
9.1.1.3. Collaborations & Alliances
9.1.1.4. Recent Developments
9.1.1.5. Financial Details
9.1.1.6. Others
9.1.2.adidas America Inc
9.1.2.1. Business Description
9.1.2.2. Product Portfolio
9.1.2.3. Collaborations & Alliances
9.1.2.4. Recent Developments
9.1.2.5. Financial Details
9.1.2.6. Others
9.1.3.Deckers Outdoor Corp
9.1.3.1. Business Description
9.1.3.2. Product Portfolio
9.1.3.3. Collaborations & Alliances
9.1.3.4. Recent Developments
9.1.3.5. Financial Details
9.1.3.6. Others
9.1.4.Skechers USA Inc
9.1.4.1. Business Description
9.1.4.2. Product Portfolio
9.1.4.3. Collaborations & Alliances
9.1.4.4. Recent Developments
9.1.4.5. Financial Details
9.1.4.6. Others
9.1.5.New Balance Athletic Shoe Inc
9.1.5.1. Business Description
9.1.5.2. Product Portfolio
9.1.5.3. Collaborations & Alliances
9.1.5.4. Recent Developments
9.1.5.5. Financial Details
9.1.5.6. Others
9.1.6.On Inc
9.1.6.1. Business Description
9.1.6.2. Product Portfolio
9.1.6.3. Collaborations & Alliances
9.1.6.4. Recent Developments
9.1.6.5. Financial Details
9.1.6.6. Others
9.1.7.Caleres Inc
9.1.7.1. Business Description
9.1.7.2. Product Portfolio
9.1.7.3. Collaborations & Alliances
9.1.7.4. Recent Developments
9.1.7.5. Financial Details
9.1.7.6. Others
9.1.8.VF Corp
9.1.8.1. Business Description
9.1.8.2. Product Portfolio
9.1.8.3. Collaborations & Alliances
9.1.8.4. Recent Developments
9.1.8.5. Financial Details
9.1.8.6. Others
9.1.9.Crocs Inc
9.1.9.1. Business Description
9.1.9.2. Product Portfolio
9.1.9.3. Collaborations & Alliances
9.1.9.4. Recent Developments
9.1.9.5. Financial Details
9.1.9.6. Others
9.1.10. Steve Madden Ltd
9.1.10.1. Business Description
9.1.10.2. Product Portfolio
9.1.10.3. Collaborations & Alliances
9.1.10.4. Recent Developments
9.1.10.5. Financial Details
9.1.10.6. Others
10. Disclaimer
| Segment | Sub-Segment |
|---|---|
| By Category |
|
| By Product Type |
|
| By Sales Channel |
|
| By Material |
|
| By Price |
|
| By Footwear Type |
|
| By Application |
|
Research Methodology
This study followed a structured approach comprising four key phases to assess the size and scope of the electro-oxidation market. The process began with thorough secondary research to collect data on the target market, related markets, and broader industry context. These findings, along with preliminary assumptions and estimates, were then validated through extensive primary research involving industry experts from across the value chain. To calculate the overall market size, both top-down and bottom-up methodologies were employed. Finally, market segmentation and data triangulation techniques were applied to refine and validate segment-level estimations.
Secondary Research
The secondary research phase involved gathering data from a wide range of credible and published sources. This step helped in identifying industry trends, defining market segmentation, and understanding the market landscape and value chain.
Sources consulted during this phase included:
- Company annual reports, investor presentations, and press releases
- Industry white papers and certified publications
- Trade directories and market-recognized databases
- Articles from authoritative authors and reputable journals
- Gold and silver standard websites
Secondary research was critical in mapping out the industry's value chain and monetary flow, identifying key market segments, understanding regional variations, and tracking significant industry developments.
Other key sources:
- Financial disclosures
- Industry associations and trade bodies
- News outlets and business magazines
- Academic journals and research studies
- Paid industry databases
Primary Research
To validate secondary data and gain deeper market insights, primary research was conducted with key stakeholders across both the supply and demand sides of the market.
On the demand side, participants included decision-makers and influencers from end-user industries—such as CIOs, CTOs, and CSOs—who provided first-hand perspectives on market needs, product usage, and future expectations.
On the supply side, interviews were conducted with manufacturers, industry associations, and institutional participants to gather insights into current offerings, product pipelines, and market challenges.
Primary interviews provided critical inputs such as:
- Market size and revenue data
- Product and service breakdowns
- Market forecasts
- Regional and application-specific trends
Stakeholders consulted included:
- Leading OEM and solution providers
- Channel and distribution partners
- End users across various applications
- Independent consultants and industry specialists
Market Size Estimation and Data Triangulation
- Identifying Key Market Participants (Secondary Research)
- Goal: To identify the major players or companies in the target market. This typically involves using publicly available data sources such as industry reports, market research publications, and financial statements of companies.
- Tools: Reports from firms like Gartner, Forrester, Euromonitor, Statista, IBISWorld, and others. Public financial statements, news articles, and press releases from top market players.
- Extracting Earnings of Key Market Participants
- Goal: To estimate the earnings generated from the product or service being analyzed. This step helps in understanding the revenue potential of each market player in a specific geography.
- Methods: Earnings data can be gathered from:
- Publicly available financial reports (for listed companies).
- Interviews and primary data sources from professionals, such as Directors, VPs, SVPs, etc. This is especially useful for understanding more nuanced, internal data that isn't publicly disclosed.
- Annual reports and investor presentations of key players.
- Data Collation and Development of a Relevant Data Model
- Goal: To collate inputs from both primary and secondary sources into a structured, data-driven model for market estimation. This model will incorporate key market KPIs and any independent variables relevant to the market.
- Key KPIs: These could include:
- Market size, growth rate, and demand drivers.
- Industry-specific metrics like market share, average revenue per customer (ARPC), or average deal size.
- External variables, such as economic growth rates, inflation rates, or commodity prices, that could affect the market.
- Data Modeling: Based on this data, the market forecasts are developed for the next 5 years. A combination of trend analysis, scenario modeling, and statistical regression might be used to generate projections.
- Scenario Analysis
- Goal: To test different assumptions and validate how sensitive the market is to changes in key variables (e.g., market demand, regulatory changes, technological disruptions).
- Types of Scenarios:
- Base Case: Based on current assumptions and historical data.
- Best-Case Scenario: Assuming favorable market conditions, regulatory environments, and technological advancements.
- Worst-Case Scenario: Accounting for adverse factors, such as economic downturns, stricter regulations, or unexpected disruptions.


