Japan GaN Powered Chargers Market Report: Trends, Growth and Forecast (2026-2032)
By Power Output (Up to 30W, 31W to 65W, 66W to 100W, Above 100W), By Charger Type (Wall Chargers, Desktop Chargers, Travel Chargers, Car Chargers, Wireless Chargers, Others), By Port Configuration (Single-Port Chargers, Dual-Port Chargers, Multi-Port Chargers), By Connector Type (USB Type-C, USB Type-A, USB Type-C and USB Type-A Combined, Others), By Application (Smartphones, Laptops & Notebooks, Tablets, Wearables, Gaming Devices, Cameras, Others), By Sales Channel (Retail Online (Brand-Owned Online Stores, E-commerce Marketplaces, Electronics E-retailers), Retail Offline (Brand Exclusive Stores, Consumer Electronics Stores, Multi-Brand Retail Stores, Hypermarkets & Supermarkets, Mobile Phone Retail Stores)) ... Read more
|
Major Players
|
Japan GaN Powered Chargers Market Statistics and Insights, 2026
- Market Size Statistics
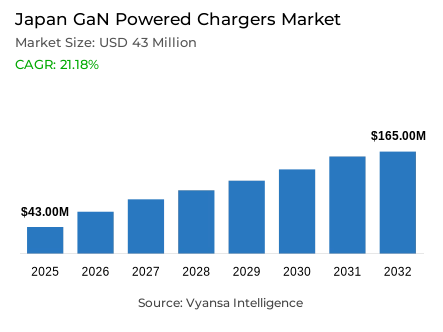
- Gan powered chargers market size in Japan was valued at USD 43 million in 2025 and is estimated at USD 49 million in 2026.
- The market size is expected to grow to USD 165 million by 2032.
- Market to register a CAGR of around 21.18% during 2026-32.
- Power Output Shares
- 31w to 65w grabbed market share of 40%.
- Competition
- More than 15 companies are actively engaged in producing gan powered chargers in Japan.
- Top 5 companies acquired around 25% of the market share in 2026.
- RAVPower, Xiaomi Technology Netherlands B.V.(Xiaomi), AUKEY Online (AUKEY), Anker Innovations Technology Co. Ltd (Anker), Ugreen Group Limited (UGREEN) etc., are few of the top companies.
- Sales Channel
- Retail online grabbed 60% of the market.
Japan GaN Powered Chargers Market Outlook
The japan gallium (GaN) powered chargers market is moving from compact accessory adoption toward a structured fast-charging category shaped by compact electronics demand, mobile work culture, USB-C charging convergence, and premium charging accessories. Valued at USD 43 million in 2025, the market is projected to reach USD 165 million by 2032, reflecting 21.18% CAGR. Growth remains linked to gallium nitride chargers in japan replacing bulky adapters across device replacement cycles.
Demand in the japan GaN powered chargers market is centered on USB-C GaN chargers, compact wall chargers, travel chargers, laptop chargers, smartphone chargers, and multi-port GaN chargers. Gallium nitride technology supports high-efficiency charging, smaller power designs, and better thermal control than silicon adapters. This strengthens relevance across smartphones, laptops, tablets, cameras, gaming devices, wearables, and portable electronics used across homes, offices, campuses, commuting routes, and travel routines.
Within the japan GaN powered chargers market, the 31W to 65W segment leads because it matches mixed device ownership rather than only phone charging. The Statistical Handbook of japan 2025 reports smartphone internet use at 74.4%, computer use at 46.8%, and tablet use at 25.5% in 2024. This supports 45W USB-C chargers and 65W GaN chargers for phones, tablets, and portable computers without requiring larger desktop-class adapters.
Channel structure further defines the japan GaN powered chargers market because retail online leads specification-led charger discovery. METI japan reports domestic electrical appliances, AV equipment, PCs, and peripherals reached 2.7443 trillion yen in B-to-C e-commerce in 2024, with a 43.03% EC ratio. This supports comparison of wattage, USB Power Delivery, USB-C PD chargers, PSE labeling, device compatibility, and compact power adapters through e-commerce platforms and brand websites.

Japan GaN Powered Chargers Market Growth Driver
Compact Device Use Strengthens Charging Consolidation
Compact device use is the strongest driver for the japan GaN powered chargers market because consumers need charging across phones, computers, tablets, wearables, and accessories every day. The Statistical Handbook of japan 2025 reports smartphone internet use at 74.4%, computer use at 46.8%, and tablet use at 25.5% in 2024. This overlapping device base strengthens fast charging adoption, multi-device charging, and demand for compact wall chargers across households and offices.
Telework adds a japan-specific demand layer for the japan GaN powered chargers market. The Statistical Handbook of japan 2025 states 47.3% of enterprises had introduced telework as of August 2024, with home-based work at 90.9%, mobile work at 32.4%, and satellite-office work at 15.7%. This supports lightweight travel chargers and laptop chargers for office workers, remote workers, students, and business travelers moving between work locations and commutes.
Japan GaN Powered Chargers Market Challenge
Safety Certification Creates Market Entry Pressure
Safety certification is the main challenge for the japan GaN powered chargers market because compact high-output chargers must control heat, insulation, voltage negotiation, electromagnetic disturbance, and cable compatibility. METI japan states the Electrical Appliances and Materials Safety Act regulates manufacture, import, and sale to prevent hazards and disturbances. AC/DC power supply units are Category A examples, making charger safety standards and certification requirements critical before market access.
Compliance pressure increases cost and timing risk in the japan GaN powered chargers market. METI requires notifying suppliers to meet technical requirements, conduct self-inspection, keep inspection records, and undergo conformity assessment by registered bodies for Category A products. Only compliant suppliers can affix the PSE label, and sale or exhibition without PSE labeling is prohibited, increasing documentation, product-label accuracy, batch control, and import screening for USB-C PD chargers.
Unlock Market Intelligence
Explore the market potential with our data-driven report
Japan GaN Powered Chargers Market Trend
USB Power Delivery Standardization Shapes Charging Design
USB Power Delivery standardization is the core trend in the japan GaN powered chargers market because charger design is moving toward common power rules across device categories. USB-IF states USB has evolved from limited power supply into a primary provider of power, while USB Power Delivery provides flexible power delivery over one cable. This supports universal charging across phones, tablets, accessories, hubs, and portable computers in japanese routines.
The technical roadmap strengthens high-wattage compact chargers in the japan GaN powered chargers market. USB-IF states USB Power Delivery Revision 3.1 enables up to 240W over full-featured USB Type-C cables, adding 28V, 36V, and 48V fixed voltage levels. While 31W to 65W remains practical, the roadmap supports future demand for 100W chargers, lightweight travel chargers, compact power adapters, and premium charging accessories.
Japan GaN Powered Chargers Market Opportunity
Online Electronics Retail Creates Scale Potential
Online electronics retail creates the strongest opportunity in the japan GaN powered chargers market because gallium nitride chargers are compact, searchable, and specification-led accessories. METI japan reports the 2024 B-to-C e-commerce market reached 26.1 trillion yen, while domestic electrical appliances, AV equipment, PCs, and peripherals reached 2.7443 trillion yen with a 43.03% EC ratio. This supports retail online demand for premium charging accessories through digital electronics channels.
Household online-shopping behavior strengthens the opportunity for the japan GaN powered chargers market. The Statistical Handbook of japan 2025 reports 55.3% of two-or-more-person households used internet shopping in 2024, with average monthly online expenditure of 24,928 yen. Home electronics and furniture accounted for 7.0% of internet-shopping expenditure, supporting replacement demand for USB-C GaN chargers, travel chargers, laptop chargers, and smartphone chargers through formal digital channels.
Unlock Market Intelligence
Explore the market potential with our data-driven report
Japan GaN Powered Chargers Market Segmentation Analysis
By Power Output
- Up to 30W
- 31W to 65W
- 66W to 100W
- Above 100W
The 31W to 65W range leads the japan GaN powered chargers market under power output, holding around 40% share because it fits mixed device ownership. The Statistical Handbook of japan 2025 reports smartphone internet use at 74.4%, computer use at 46.8%, and tablet use at 25.5% in 2024. This power band supports 30W GaN chargers, 45W USB-C chargers, and 65W GaN chargers for practical everyday charging.
This range also aligns with USB Power Delivery’s standards roadmap in the japan GaN powered chargers market. USB-IF states USB PD enables flexible power delivery over one cable, while Revision 3.1 raises capability up to 240W. japan’s mainstream need is balanced charging rather than maximum wattage, making 31W to 65W practical for smartphones, tablets, lightweight computers, travel convenience, compact size, lower heat, and price accessibility.

By Sales Channel
- Retail Online
- Brand-Owned Online Stores
- E-commerce Marketplaces
- Electronics E-retailers
- Retail Offline
- Brand Exclusive Stores
- Consumer Electronics Stores
- Multi-Brand Retail Stores
- Hypermarkets & Supermarkets
- Mobile Phone Retail Stores
Retail online leads the japan GaN powered chargers market under sales channel, holding around 60% share because charger selection depends on technical comparison. METI japan reports domestic electrical appliances, AV equipment, PCs, and peripherals had a 43.03% EC ratio in 2024, above the total B-to-C EC ratio of 9.8%. This supports e-commerce platforms, brand websites, electronics retailers, and retail online discovery for specification-led accessories.
Retail online also fits household demand behavior in the japan GaN powered chargers market. The Statistical Handbook of japan 2025 reports 55.3% of two-or-more-person households used internet shopping in 2024, with average monthly expenditure of 24,928 yen. GaN powered chargers are compact, searchable, specification-heavy, and easy to ship, allowing consumers to evaluate wattage, USB-C compatibility, PSE labeling, delivery, and price before replacement decisions.
List of Companies Covered in Japan GaN Powered Chargers Market
The companies listed below are highly influential in the Japan gan powered chargers market, with a significant market share and a strong impact on industry developments.
- RAVPower
- Xiaomi Technology Netherlands B.V.(Xiaomi)
- AUKEY Online (AUKEY)
- Anker Innovations Technology Co. Ltd (Anker)
- Ugreen Group Limited (UGREEN)
- Shenzhen Baseus Technology Co. Ltd (Baseus)
- Belkin International Inc. (Belkin)
- Aohai Technology Co. Ltd.
- ASUSTek Computer Inc.
- Lenovo Group Ltd. (Lenovo)
Market News & Updates
- ELECOM CO., LTD., 2026:
ELECOM launched compact 65W USB Power Delivery AC chargers in Japan. The new models include USB Type-C output, PPS support, GaN II technology, cable-included and cable-separate variants, and compact portable construction. The update expands ELECOM’s GaN charger lineup for smartphones, tablets, and notebook PCs.
- Anker Japan Co., Ltd., 2025:
Anker Japan started sales of the Anker Nano Charger 70W, 3 Ports. The charger uses GaN technology, supports up to 70W output, and is designed as a compact multi-port USB fast charger. The update adds a smaller high-output charger option for mobile and laptop users in Japan.
Frequently Asked Questions
Related Report
- Market Segmentation
- Research Scope
- Research Methodology
- Definitions and Assumptions
- Executive Summary
- Japan GaN Powered Chargers Market Policies, Regulations, and Standards
- Japan GaN Powered Chargers Production (Thousand Units) Trend 2022-2032
- Japan GaN Powered Chargers Production (Thousand Units) Trend By Power Output
- Up to 30W
- W to 65W
- W to 100W
- Above 100W
- Up to 30W
- Company Wise Production Plants and Statistics
- Installed Production Capacity
- Actual Production
- Planned Production Target
- Japan GaN Powered Chargers Production (Thousand Units) Trend By Power Output
- Japan GaN Powered Chargers Pricing Analysis 2022-2032
- Japan GaN Powered Chargers Pricing Trend (USD/Thousand Units) 2022-2032
- Japan GaN Powered Chargers Pricing Trend (USD/Thousand Units) By Power Output 2022-2032
- Up to 30W
- W to 65W
- W to 100W
- Above 100W
- Up to 30W
- Japan GaN Powered Chargers Market Dynamics
- Growth Factors
- Challenges
- Trends
- Opportunities
- Japan GaN Powered Chargers Market Statistics, 2022-2032F
- Market Size & Growth Outlook
- By Revenues in USD Million
- By Quantity Sold in Thousand Units
- Market Segmentation & Growth Outlook
- By Power Output
- Up to 30W- Market Insights and Forecast 2022-2032, USD Million
- 31W to 65W- Market Insights and Forecast 2022-2032, USD Million
- 66W to 100W- Market Insights and Forecast 2022-2032, USD Million
- Above 100W- Market Insights and Forecast 2022-2032, USD Million
- By Charger Type
- Wall Chargers- Market Insights and Forecast 2022-2032, USD Million
- Desktop Chargers- Market Insights and Forecast 2022-2032, USD Million
- Travel Chargers- Market Insights and Forecast 2022-2032, USD Million
- Car Chargers- Market Insights and Forecast 2022-2032, USD Million
- Wireless Chargers- Market Insights and Forecast 2022-2032, USD Million
- Others- Market Insights and Forecast 2022-2032, USD Million
- By Port Configuration
- Single-Port Chargers- Market Insights and Forecast 2022-2032, USD Million
- Dual-Port Chargers- Market Insights and Forecast 2022-2032, USD Million
- Multi-Port Chargers- Market Insights and Forecast 2022-2032, USD Million
- By Connector Type
- USB Type-C- Market Insights and Forecast 2022-2032, USD Million
- USB Type-A- Market Insights and Forecast 2022-2032, USD Million
- USB Type-C and USB Type-A Combined- Market Insights and Forecast 2022-2032, USD Million
- Others- Market Insights and Forecast 2022-2032, USD Million
- By Application
- Smartphones- Market Insights and Forecast 2022-2032, USD Million
- Laptops & Notebooks- Market Insights and Forecast 2022-2032, USD Million
- Tablets- Market Insights and Forecast 2022-2032, USD Million
- Wearables- Market Insights and Forecast 2022-2032, USD Million
- Gaming Devices- Market Insights and Forecast 2022-2032, USD Million
- Cameras- Market Insights and Forecast 2022-2032, USD Million
- Others- Market Insights and Forecast 2022-2032, USD Million
- By Sales Channel
- Retail Online- Market Insights and Forecast 2022-2032, USD Million
- Brand-Owned Online Stores- Market Insights and Forecast 2022-2032, USD Million
- E-commerce Marketplaces- Market Insights and Forecast 2022-2032, USD Million
- Electronics E-retailers- Market Insights and Forecast 2022-2032, USD Million
- Retail Offline- Market Insights and Forecast 2022-2032, USD Million
- Brand Exclusive Stores- Market Insights and Forecast 2022-2032, USD Million
- Consumer Electronics Stores- Market Insights and Forecast 2022-2032, USD Million
- Multi-Brand Retail Stores- Market Insights and Forecast 2022-2032, USD Million
- Hypermarkets & Supermarkets- Market Insights and Forecast 2022-2032, USD Million
- Mobile Phone Retail Stores- Market Insights and Forecast 2022-2032, USD Million
- Retail Online- Market Insights and Forecast 2022-2032, USD Million
- By Competitors
- Competition Characteristics
- Market Share & Analysis
- By Power Output
- Market Size & Growth Outlook
- Japan Up to 30W Market Statistics, 2022-2032
- Market Size & Growth Outlook
- By Revenues in USD Million
- By Quantity Sold in Thousand Units
- Market Segmentation & Growth Outlook
- By Charger Type- Market Insights and Forecast 2022-2032, USD Million
- By Port Configuration- Market Insights and Forecast 2022-2032, USD Million
- By Connector Type- Market Insights and Forecast 2022-2032, USD Million
- By Application- Market Insights and Forecast 2022-2032, USD Million
- By Sales Channel- Market Insights and Forecast 2022-2032, USD Million
- Market Size & Growth Outlook
- Japan 31W to 65W Market Statistics, 2022-2032
- Market Size & Growth Outlook
- By Revenues in USD Million
- By Quantity Sold in Thousand Units
- Market Segmentation & Growth Outlook
- By Charger Type- Market Insights and Forecast 2022-2032, USD Million
- By Port Configuration- Market Insights and Forecast 2022-2032, USD Million
- By Connector Type- Market Insights and Forecast 2022-2032, USD Million
- By Application- Market Insights and Forecast 2022-2032, USD Million
- By Sales Channel- Market Insights and Forecast 2022-2032, USD Million
- Market Size & Growth Outlook
- Japan 66W to 100W Market Statistics, 2022-2032
- Market Size & Growth Outlook
- By Revenues in USD Million
- By Quantity Sold in Thousand Units
- Market Segmentation & Growth Outlook
- By Charger Type- Market Insights and Forecast 2022-2032, USD Million
- By Port Configuration- Market Insights and Forecast 2022-2032, USD Million
- By Connector Type- Market Insights and Forecast 2022-2032, USD Million
- By Application- Market Insights and Forecast 2022-2032, USD Million
- By Sales Channel- Market Insights and Forecast 2022-2032, USD Million
- Market Size & Growth Outlook
- Japan Above 100W Market Statistics, 2022-2032
- Market Size & Growth Outlook
- By Revenues in USD Million
- By Quantity Sold in Thousand Units
- Market Segmentation & Growth Outlook
- By Charger Type- Market Insights and Forecast 2022-2032, USD Million
- By Port Configuration- Market Insights and Forecast 2022-2032, USD Million
- By Connector Type- Market Insights and Forecast 2022-2032, USD Million
- By Application- Market Insights and Forecast 2022-2032, USD Million
- By Sales Channel- Market Insights and Forecast 2022-2032, USD Million
- Market Size & Growth Outlook
- Competitive Outlook
- Company Profiles
- Anker Japan Co. Ltd.
- Business Description
- Product Portfolio
- Collaborations & Alliances
- Recent Developments
- Financial Details
- Others
- ELECOM CO., LTD.
- Business Description
- Product Portfolio
- Collaborations & Alliances
- Recent Developments
- Financial Details
- Others
- CIO Co. Ltd.
- Business Description
- Product Portfolio
- Collaborations & Alliances
- Recent Developments
- Financial Details
- Others
- Belkin Asia Pacific Ltd
- Business Description
- Product Portfolio
- Collaborations & Alliances
- Recent Developments
- Financial Details
- Others
- America Ugreen Limited (UGREEN)
- Business Description
- Product Portfolio
- Collaborations & Alliances
- Recent Developments
- Financial Details
- Others
- BUFFALO INC.
- Business Description
- Product Portfolio
- Collaborations & Alliances
- Recent Developments
- Financial Details
- Others
- SANWA SUPPLY INC.
- Business Description
- Product Portfolio
- Collaborations & Alliances
- Recent Developments
- Financial Details
- Others
- Broadcare natina Limted (AUKEY)
- Business Description
- Product Portfolio
- Collaborations & Alliances
- Recent Developments
- Financial Details
- Others
- MOTTERU Inc.
- Business Description
- Product Portfolio
- Collaborations & Alliances
- Recent Developments
- Financial Details
- Others
- OWLTECH Co. Ltd.
- Business Description
- Product Portfolio
- Collaborations & Alliances
- Recent Developments
- Financial Details
- Others
- Anker Japan Co. Ltd.
- Company Profiles
- Disclaimer
| Segment | Sub-Segment |
|---|---|
| Up to 30W | |
| 31W to 65W | |
| 66W to 100W | |
| Above 100W |
|
| By Revenues in USD Million | |
| By Quantity Sold in Thousand Units |
|
| By Power Output |
|
| By Charger Type |
|
| By Port Configuration |
|
| By Connector Type |
|
| By Application |
|
| By Sales Channel |
|
Research Methodology
This study followed a structured approach comprising four key phases to assess the size and scope of the electro-oxidation market. The process began with thorough secondary research to collect data on the target market, related markets, and broader industry context. These findings, along with preliminary assumptions and estimates, were then validated through extensive primary research involving industry experts from across the value chain. To calculate the overall market size, both top-down and bottom-up methodologies were employed. Finally, market segmentation and data triangulation techniques were applied to refine and validate segment-level estimations.
Secondary Research
The secondary research phase involved gathering data from a wide range of credible and published sources. This step helped in identifying industry trends, defining market segmentation, and understanding the market landscape and value chain.
Sources consulted during this phase included:
- Company annual reports, investor presentations, and press releases
- Industry white papers and certified publications
- Trade directories and market-recognized databases
- Articles from authoritative authors and reputable journals
- Gold and silver standard websites
Secondary research was critical in mapping out the industry's value chain and monetary flow, identifying key market segments, understanding regional variations, and tracking significant industry developments.
Other key sources:
- Financial disclosures
- Industry associations and trade bodies
- News outlets and business magazines
- Academic journals and research studies
- Paid industry databases
Primary Research
To validate secondary data and gain deeper market insights, primary research was conducted with key stakeholders across both the supply and demand sides of the market.
On the demand side, participants included decision-makers and influencers from end-user industries—such as CIOs, CTOs, and CSOs—who provided first-hand perspectives on market needs, product usage, and future expectations.
On the supply side, interviews were conducted with manufacturers, industry associations, and institutional participants to gather insights into current offerings, product pipelines, and market challenges.
Primary interviews provided critical inputs such as:
- Market size and revenue data
- Product and service breakdowns
- Market forecasts
- Regional and application-specific trends
Stakeholders consulted included:
- Leading OEM and solution providers
- Channel and distribution partners
- End users across various applications
- Independent consultants and industry specialists
Market Size Estimation and Data Triangulation
- Identifying Key Market Participants (Secondary Research)
- Goal: To identify the major players or companies in the target market. This typically involves using publicly available data sources such as industry reports, market research publications, and financial statements of companies.
- Tools: Reports from firms like Gartner, Forrester, Euromonitor, Statista, IBISWorld, and others. Public financial statements, news articles, and press releases from top market players.
- Extracting Earnings of Key Market Participants
- Goal: To estimate the earnings generated from the product or service being analyzed. This step helps in understanding the revenue potential of each market player in a specific geography.
- Methods: Earnings data can be gathered from:
- Publicly available financial reports (for listed companies).
- Interviews and primary data sources from professionals, such as Directors, VPs, SVPs, etc. This is especially useful for understanding more nuanced, internal data that isn't publicly disclosed.
- Annual reports and investor presentations of key players.
- Data Collation and Development of a Relevant Data Model
- Goal: To collate inputs from both primary and secondary sources into a structured, data-driven model for market estimation. This model will incorporate key market KPIs and any independent variables relevant to the market.
- Key KPIs: These could include:
- Market size, growth rate, and demand drivers.
- Industry-specific metrics like market share, average revenue per customer (ARPC), or average deal size.
- External variables, such as economic growth rates, inflation rates, or commodity prices, that could affect the market.
- Data Modeling: Based on this data, the market forecasts are developed for the next 5 years. A combination of trend analysis, scenario modeling, and statistical regression might be used to generate projections.
- Scenario Analysis
- Goal: To test different assumptions and validate how sensitive the market is to changes in key variables (e.g., market demand, regulatory changes, technological disruptions).
- Types of Scenarios:
- Base Case: Based on current assumptions and historical data.
- Best-Case Scenario: Assuming favorable market conditions, regulatory environments, and technological advancements.
- Worst-Case Scenario: Accounting for adverse factors, such as economic downturns, stricter regulations, or unexpected disruptions.


