US Biofungicides Market Report: Trends, Growth and Forecast (2026-2032)
By Source (Microbial, Botanical), By Species (Bacillus, Trichoderma, Pseudomonas, Streptomyces, Saccharomyces, Aureobasidium, Coniothyrium, Others), By Form (Wettable Powder, Aqueous Solution, Granules, Powder, Liquid), By Mode of Application (Foliar Spray, Soil Treatment, Seed Treatment, Post-Harvest Treatment, Root Dipping, Drip Irrigation, Sprinkler Irrigation, Others), By Crop Type (Fruits and Vegetables, Cereals and Grains, Oilseeds and Pulses, Turf and Ornamentals, Plantation Crops, Nursery Crops, Others), By Region (West, Midwest, South, North, Northeast) ... Read more
|
Major Players
|
US Biofungicides Market Statistics and Insights, 2026
- Market Size Statistics
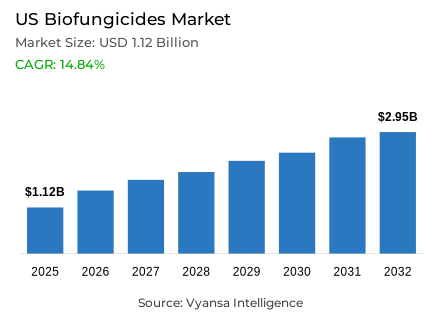
- Biofungicides market size in US was valued at USD 1.12 billion in 2025 and is estimated at USD 1.29 billion in 2026.
- The market size is expected to grow to USD 2.95 billion by 2032.
- Market to register a CAGR of around 14.84% during 2026-32.
- Source Shares
- Microbial grabbed market share of 80%.
- Competition
- More than 10 companies are actively engaged in producing biofungicides in US.
- Top 5 companies acquired around 50% of the market share.
- FMC Corporation, BASF Agricultural Solutions US LLC, Novonesis Plant Biosolutions, Certis USA LLC, Bayer CropScience LP etc., are few of the top companies.
- Species
- Bacillus grabbed 40% of the market.
US Biofungicides Market Outlook
The US Biofungicides Market size is valued at USD 1.12 Billion in 2025 and projected to reach USD 2.95 Billion by 2032, growing at a CAGR of 14.84% during 2026-2032. The sector covers biological fungicides, microbial pesticides, seed treatment biofungicides, and biological crop protection products used by growers, greenhouse operators, crop consultants, and input distributors to manage fungal and soil-borne diseases within crop protection programs across specialty, row-crop, and protected-cultivation systems. This positioning supports disease-control decisions across commercial acreage.
Microbial adoption is strengthened by EPA recognition of biopesticides as naturally derived pest-control materials, including microorganisms, and by the agency’s February 12, 2026 registered active-ingredient list. The US biofungicides market benefits from this regulatory visibility because suppliers can align formulation, label expansion, and stewardship planning with approved biochemical and microbial pesticide pathways across food and specialty crops while reducing uncertainty around registration-ready strain development. It also improves planning discipline for distributors managing crop-specific registrations.
The industry supports farm-level productivity by giving producers tools that fit integrated pest management biofungicides programs, organic crop protection products, and resistance-management rotations. USDA ERS notes that certified organic producers avoid synthetic chemicals and rely more on production practices, crop rotation, timing adjustments, and beneficial organisms, which strengthens procurement relevance for biological fungicides where disease pressure requires lower-residue treatment options and disease-control flexibility. These attributes improve procurement confidence in residue-sensitive disease-control programs.
The US biofungicides market is moving toward stronger commercialization of Bacillus biofungicides, formulation resilience, and EPA registered biofungicides for specialty and row-crop use. The US biofungicides industry is expected to prioritize shelf-life, compatibility with conventional fungicide programs, distributor education, and product-positioning discipline as growers demand microbial biofungicides that combine regulatory fit with dependable field performance, repeatable disease suppression, and practical application economics. Supplier differentiation is linked to validated field performance and technical service.

US Biofungicides Market Growth Driver
Residue-Conscious Farming Practices Strengthen Biological Disease Control
Residue-conscious crop production, organic certification compliance, and resistance-management needs are increasing demand for biological disease suppression across U.S. agriculture. The US biofungicides market gains traction as growers seek bio-based crop protection tools that complement synthetic fungicides without disrupting certification requirements, export-oriented residue management, or integrated spray schedules. This demand profile is strongest where fruits, vegetables, ornamentals, and greenhouse crops require frequent disease control but face buyer scrutiny over chemical residues, sustainability claims, and input documentation and retailer residue standards across premium crop categories.
USDA ERS reported in January 2026 that organic food sales reached USD 65.4 Billion in 2024 and produce accounted for 33% of U.S. organic food sales. This demand base supports the US biofungicides industry by expanding the addressable acreage and procurement rationale for organic-compatible microbial products used against root rot, botrytis, powdery mildew, and soil-borne disease risks, especially in high-value produce systems in controlled-environment and open-field acreage.
US Biofungicides Market Challenge
Regulatory Data Burdens Slow Product Expansion
Registration complexity, label-specific data needs, and state-level commercialization requirements remain practical barriers for suppliers entering biological crop protection. The US biofungicides industry faces longer technical preparation cycles because microbial products must demonstrate identity, composition, effects, and environmental fate before market access. Smaller developers can face higher compliance friction when translating promising strains into commercially registered products with consistent claims, stable formulations, and grower-ready labels for diverse crops and application conditions and state sales submissions after federal review.
EPA’s April 2026 data requirements state that registrants under FIFRA or tolerance applicants under FFDCA must generate scientific data addressing identity, composition, adverse effects, and environmental fate. This requirement protects market integrity, yet it can slow the US biofungicides market by extending development timelines, increasing documentation needs, and delaying product availability for emerging disease-management niches where growers need rapid biological alternatives. These obligations raise entry thresholds for firms with limited regulatory teams.
Unlock Market Intelligence
Explore the market potential with our data-driven report
US Biofungicides Market Trend
Microbial Formulation Platforms Move Into Integrated Programs
Microbial formulation technology is shifting from niche organic use toward integrated disease-control programs that combine biological and conventional chemistry. The US biofungicides market trends point to products positioned for rotation, residue management, and resistance support rather than standalone replacement. Suppliers are emphasizing strain selection, spore viability, tank-mix compatibility, and delivery formats because field reliability determines repeat purchases across specialty crops, greenhouses, and large-acre systems with tighter performance expectations and expectations for evidence-backed disease outcomes.
BASF states that Serifel is a preventative bio fungicide based on Bacillus amyloliquefaciens strain MBI 600, providing broad-spectrum disease control through multiple modes of action and supporting integrated crop management systems. This product positioning strengthens the US biofungicides industry by showing how microbial products can be embedded into conventional programs to improve adoption confidence, technical differentiation, and advisor acceptance. It also reinforces how application guidance, compatibility data, and strain messaging influence distributor prioritization and grower uptake.
US Biofungicides Market Opportunity
Organic Input Verification Opens Supplier Access
Organic and low-residue production systems create an underpenetrated route for suppliers that can combine EPA registration, organic-use verification, and strong distributor support. The US biofungicides industry can improve demand capture by aligning product labels with certified-crop needs, offering field-use guidance, and supporting crop advisors with disease-specific trial evidence. This opportunity is particularly important for growers that need residue-compatible controls without sacrificing disease-management reliability or certification confidence across multi-crop programs and repeated application windows.
OMRI states that its U.S. National Organic Program product list is the most complete directory for organic production and processing, covering more than 10,000 OMRI Listed products. This verification infrastructure supports the US biofungicides market by improving buyer confidence, strengthening procurement screening, and helping suppliers position organic-compatible biofungicide products through transparent compliance channels across distributors, consultants, and certified operations. Clear verification also lowers procurement friction where organic buyers require documented input eligibility before seasonal purchases planning.
Unlock Market Intelligence
Explore the market potential with our data-driven report
US Biofungicides Market Segmentation Analysis
By Source
- Microbial
- Botanical
Microbial products hold 80% share by source, reflecting their operational fit with biological disease control, fermentation-based production, and strain-specific product development. The US biofungicides market growth is supported by microbial products because bacteria, fungi, and yeasts can be developed around targeted antagonism, induced resistance, and root-zone colonization. This source category also supports scalable formulation strategies for seed, soil, and foliar applications across multiple crop systems while enabling suppliers to include Trichoderma biofungicides in differentiated portfolios.
EPA’s February 2026 active-ingredient list includes registered biochemical and microbial biopesticide active ingredients and records 2024 microbial entries such as Bacillus subtilis strain CH4000, Bacillus paralicheniformis strain CH0273, Gluconobacter cerinus strain BC18B, Hanseniaspora uvarum strain BC18Y, and Trichoderma atroviride strains. This breadth strengthens supply planning and innovation pathways for microbial biofungicides in the US biofungicides industry and encourages strain portfolio expansion for next-generation biological crop protection products across high-value crop rotations and protected acreage.

By Species
- Bacillus
- Trichoderma
- Pseudomonas
- Streptomyces
- Saccharomyces
- Aureobasidium
- Coniothyrium
- Others
Bacillus holds 40% share by species, supported by its strong fit in biological seed treatment, soil treatment, and foliar disease-control programs. The US biofungicides market forecast benefits from Bacillus-based products because these strains can support broad disease suppression, resistance-management rotations, and compatibility with integrated production systems. Their use is especially important where growers require biological fungicides that can be distributed through established input channels and supported by advisor recommendations across diversified acreage, specialty crops, and protected production.
The Federal Register’s August 2024 final rule established a tolerance exemption for residues of Bacillus subtilis strain CH4000 on all food commodities when used according to label directions and good agricultural practices. This regulatory action strengthens Bacillus biofungicides adoption by improving food-crop use confidence and supporting supplier positioning in the US biofungicides industry across seed, soil, and crop-protection channels. This supports practical adoption where disease pressure varies by crop, region, and season.
List of Companies Covered in US Biofungicides Market
The companies listed below are highly influential in the US biofungicides market, with a significant market share and a strong impact on industry developments.
- FMC Corporation
- BASF Agricultural Solutions US LLC
- Novonesis Plant Biosolutions
- Certis USA LLC
- Bayer CropScience LP
- UPL NA Inc.
- BioWorks, Inc. d/b/a BioWorks
- ProFarm Group Inc.
- Koppert Biological Systems
- Gowan Company LLC
Market News & Updates
- UPL NA Inc., 2025:
UPL NA announced a California label expansion for Vacciplant biofungicide in December 2025. The expansion added nine specialty crops, including rice, strawberries, tree nuts, and apples, while the product was previously approved for lettuce and grapes. The update broadens U.S. state-level biofungicide access for specialty crop disease-management programs.
Frequently Asked Questions
Related Report
- Market Segmentation
- Research Scope
- Research Methodology
- Definitions and Assumptions
- Executive Summary
- The US Biofungicides Market Policies, Regulations, and Standards
- The US Biofungicides Market Dynamics
- Growth Factors
- Challenges
- Trends
- Opportunities
- The US Biofungicides Market Statistics, 2022-2032F
- Market Size & Growth Outlook
- By Revenues in USD Million
- By Volume in Metric Tonnes
- Market Segmentation & Growth Outlook
- By Source
- Microbial- Market Insights and Forecast 2022-2032, USD Million
- Botanical- Market Insights and Forecast 2022-2032, USD Million
- By Species
- Bacillus- Market Insights and Forecast 2022-2032, USD Million
- Trichoderma- Market Insights and Forecast 2022-2032, USD Million
- Pseudomonas- Market Insights and Forecast 2022-2032, USD Million
- Streptomyces- Market Insights and Forecast 2022-2032, USD Million
- Saccharomyces- Market Insights and Forecast 2022-2032, USD Million
- Aureobasidium- Market Insights and Forecast 2022-2032, USD Million
- Coniothyrium- Market Insights and Forecast 2022-2032, USD Million
- Others- Market Insights and Forecast 2022-2032, USD Million
- By Form
- Wettable Powder- Market Insights and Forecast 2022-2032, USD Million
- Aqueous Solution- Market Insights and Forecast 2022-2032, USD Million
- Granules- Market Insights and Forecast 2022-2032, USD Million
- Powder- Market Insights and Forecast 2022-2032, USD Million
- Liquid- Market Insights and Forecast 2022-2032, USD Million
- By Mode of Application
- Foliar Spray- Market Insights and Forecast 2022-2032, USD Million
- Soil Treatment- Market Insights and Forecast 2022-2032, USD Million
- Seed Treatment- Market Insights and Forecast 2022-2032, USD Million
- Post-Harvest Treatment- Market Insights and Forecast 2022-2032, USD Million
- Root Dipping- Market Insights and Forecast 2022-2032, USD Million
- Drip Irrigation- Market Insights and Forecast 2022-2032, USD Million
- Sprinkler Irrigation- Market Insights and Forecast 2022-2032, USD Million
- Others- Market Insights and Forecast 2022-2032, USD Million
- By Crop Type
- Fruits and Vegetables- Market Insights and Forecast 2022-2032, USD Million
- Cereals and Grains- Market Insights and Forecast 2022-2032, USD Million
- Oilseeds and Pulses- Market Insights and Forecast 2022-2032, USD Million
- Turf and Ornamentals- Market Insights and Forecast 2022-2032, USD Million
- Plantation Crops- Market Insights and Forecast 2022-2032, USD Million
- Nursery Crops- Market Insights and Forecast 2022-2032, USD Million
- Others- Market Insights and Forecast 2022-2032, USD Million
- By Region
- West
- Midwest
- South
- North
- Northeast
- By Competitors
- Competition Characteristics
- Market Share & Analysis
- By Source
- Market Size & Growth Outlook
- The US Microbial Market Statistics, 2022-2032
- Market Size & Growth Outlook
- By Revenues in USD Million
- By Volume in Metric Tonnes
- Market Segmentation & Growth Outlook
- By Species- Market Insights and Forecast 2022-2032, USD Million
- By Form- Market Insights and Forecast 2022-2032, USD Million
- By Mode of Application- Market Insights and Forecast 2022-2032, USD Million
- By Crop Type- Market Insights and Forecast 2022-2032, USD Million
- By Region- Market Insights and Forecast 2022-2032, USD Million
- Market Size & Growth Outlook
- The US Botanical Market Statistics, 2022-2032
- Market Size & Growth Outlook
- By Revenues in USD Million
- By Volume in Metric Tonnes
- Market Segmentation & Growth Outlook
- By Species- Market Insights and Forecast 2022-2032, USD Million
- By Form- Market Insights and Forecast 2022-2032, USD Million
- By Mode of Application- Market Insights and Forecast 2022-2032, USD Million
- By Crop Type- Market Insights and Forecast 2022-2032, USD Million
- By Region- Market Insights and Forecast 2022-2032, USD Million
- Market Size & Growth Outlook
- Competitive Outlook
- Company Profiles
- Certis USA LLC
- Business Description
- Product Portfolio
- Collaborations & Alliances
- Recent Developments
- Financial Details
- Others
- Bayer CropScience LP
- Business Description
- Product Portfolio
- Collaborations & Alliances
- Recent Developments
- Financial Details
- Others
- UPL NA Inc.
- Business Description
- Product Portfolio
- Collaborations & Alliances
- Recent Developments
- Financial Details
- Others
- BioWorks, Inc. d/b/a BioWorks
- Business Description
- Product Portfolio
- Collaborations & Alliances
- Recent Developments
- Financial Details
- Others
- ProFarm Group Inc.
- Business Description
- Product Portfolio
- Collaborations & Alliances
- Recent Developments
- Financial Details
- Others
- FMC Corporation
- Business Description
- Product Portfolio
- Collaborations & Alliances
- Recent Developments
- Financial Details
- Others
- BASF Agricultural Solutions US LLC
- Business Description
- Product Portfolio
- Collaborations & Alliances
- Recent Developments
- Financial Details
- Others
- Novonesis Plant Biosolutions
- Business Description
- Product Portfolio
- Collaborations & Alliances
- Recent Developments
- Financial Details
- Others
- Koppert Biological Systems
- Business Description
- Product Portfolio
- Collaborations & Alliances
- Recent Developments
- Financial Details
- Others
- Gowan Company LLC
- Business Description
- Product Portfolio
- Collaborations & Alliances
- Recent Developments
- Financial Details
- Others
- Certis USA LLC
- Company Profiles
- Disclaimer
| Segment | Sub-Segment |
|---|---|
| By Source |
|
| By Species |
|
| By Form |
|
| By Mode of Application |
|
| By Crop Type |
|
| By Region |
|
Research Methodology
This study followed a structured approach comprising four key phases to assess the size and scope of the electro-oxidation market. The process began with thorough secondary research to collect data on the target market, related markets, and broader industry context. These findings, along with preliminary assumptions and estimates, were then validated through extensive primary research involving industry experts from across the value chain. To calculate the overall market size, both top-down and bottom-up methodologies were employed. Finally, market segmentation and data triangulation techniques were applied to refine and validate segment-level estimations.
Secondary Research
The secondary research phase involved gathering data from a wide range of credible and published sources. This step helped in identifying industry trends, defining market segmentation, and understanding the market landscape and value chain.
Sources consulted during this phase included:
- Company annual reports, investor presentations, and press releases
- Industry white papers and certified publications
- Trade directories and market-recognized databases
- Articles from authoritative authors and reputable journals
- Gold and silver standard websites
Secondary research was critical in mapping out the industry's value chain and monetary flow, identifying key market segments, understanding regional variations, and tracking significant industry developments.
Other key sources:
- Financial disclosures
- Industry associations and trade bodies
- News outlets and business magazines
- Academic journals and research studies
- Paid industry databases
Primary Research
To validate secondary data and gain deeper market insights, primary research was conducted with key stakeholders across both the supply and demand sides of the market.
On the demand side, participants included decision-makers and influencers from end-user industries—such as CIOs, CTOs, and CSOs—who provided first-hand perspectives on market needs, product usage, and future expectations.
On the supply side, interviews were conducted with manufacturers, industry associations, and institutional participants to gather insights into current offerings, product pipelines, and market challenges.
Primary interviews provided critical inputs such as:
- Market size and revenue data
- Product and service breakdowns
- Market forecasts
- Regional and application-specific trends
Stakeholders consulted included:
- Leading OEM and solution providers
- Channel and distribution partners
- End users across various applications
- Independent consultants and industry specialists
Market Size Estimation and Data Triangulation
- Identifying Key Market Participants (Secondary Research)
- Goal: To identify the major players or companies in the target market. This typically involves using publicly available data sources such as industry reports, market research publications, and financial statements of companies.
- Tools: Reports from firms like Gartner, Forrester, Euromonitor, Statista, IBISWorld, and others. Public financial statements, news articles, and press releases from top market players.
- Extracting Earnings of Key Market Participants
- Goal: To estimate the earnings generated from the product or service being analyzed. This step helps in understanding the revenue potential of each market player in a specific geography.
- Methods: Earnings data can be gathered from:
- Publicly available financial reports (for listed companies).
- Interviews and primary data sources from professionals, such as Directors, VPs, SVPs, etc. This is especially useful for understanding more nuanced, internal data that isn't publicly disclosed.
- Annual reports and investor presentations of key players.
- Data Collation and Development of a Relevant Data Model
- Goal: To collate inputs from both primary and secondary sources into a structured, data-driven model for market estimation. This model will incorporate key market KPIs and any independent variables relevant to the market.
- Key KPIs: These could include:
- Market size, growth rate, and demand drivers.
- Industry-specific metrics like market share, average revenue per customer (ARPC), or average deal size.
- External variables, such as economic growth rates, inflation rates, or commodity prices, that could affect the market.
- Data Modeling: Based on this data, the market forecasts are developed for the next 5 years. A combination of trend analysis, scenario modeling, and statistical regression might be used to generate projections.
- Scenario Analysis
- Goal: To test different assumptions and validate how sensitive the market is to changes in key variables (e.g., market demand, regulatory changes, technological disruptions).
- Types of Scenarios:
- Base Case: Based on current assumptions and historical data.
- Best-Case Scenario: Assuming favorable market conditions, regulatory environments, and technological advancements.
- Worst-Case Scenario: Accounting for adverse factors, such as economic downturns, stricter regulations, or unexpected disruptions.


