UK Beer Market Report: Trends, Growth and Forecast (2026-2032)
By Product Type (Dark Beer (Ale, Sorghum Beer, Weissbier/Weizen/Wheat Beer), Lager (Flavoured/Mixed Lager, Standard Lager (Premium Lager (Domestic Premium Lager, Imported Premium Lager), Mid-Priced Lager (Domestic Mid-Priced Lager, Imported Mid-Priced Lager), Economy Lager (Domestic Economy Lager, Imported Economy Lager))), Non/Low Alcohol Beer (Low Alcohol Beer, Non Alcoholic Beer), Stout, Others (Porter, Malt etc.)), By Production (Macro Brewery, Micro Brewery, Craft Brewery), By Packaging Type (Bottles, Cans, Others), By Sales Channel (On-Trade, Off-Trade) ... Read more
|
Major Players
|
UK Beer Market Statistics and Insights, 2026
- Market Size Statistics
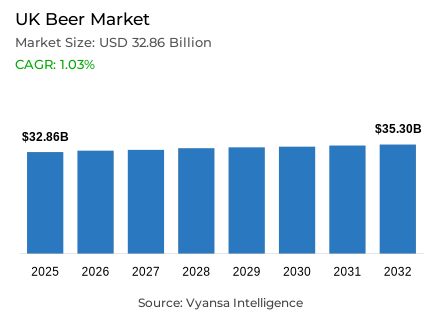
- Beer in UK is estimated at USD 32.86 billion in 2025.
- The market size is expected to grow to USD 35.3 billion by 2032.
- Market to register a cagr of around 1.03% during 2026-32.
- Product Type Shares
- Lager grabbed market share of 65%.
- Competition
- More than 20 companies are actively engaged in producing beer in UK.
- Top 5 companies acquired around 60% of the market share.
- BrewDog plc; CKA Holdings Ltd; Sharp's Brewery Ltd; Heineken UK Ltd; Molson Coors Brewing Co (UK) Ltd etc., are few of the top companies.
- Sales Channel
- On-trade grabbed 60% of the market.
UK Beer Market Outlook
The UK Beer Market was valued at USD 32.86 billion in 2025 and is anticipated to reach USD 35.3 billion by 2032. Growth through 2032 will be modest at a CAGR of around 1.03% during the period 2026 to 2032. The beer market reflects mixed consumption trends - with on-trade channels leading with a 60% share in the market against off-trade which has been an ever-increasing portion of the market driven by the end-users growing preference to drink at home. The lager category remains the largest contributing about 65% of the total market share. Consumption has faced constraints due to pressures on the economy yet consumption of low and no-alcohol beers has stabilized this category with renewed interest by end-users.
With the growing awareness of health and moderation we are seeing brands such as Carlsberg, John Smith's and Grolsch start to lower their ABV levels. Added benefits from tax breaks for beers with lower ABV levels further accelerated these reductions while improving end users affordability and brand profitability. Heineken remains to be the market leader behind following by Molson Coors and Diageo where significant growth has occurred particularly for its leading brand Guinness and especially in non-alcoholic stout format. Discounters and supermarkets have benefited from value-driven purchases, while premium and imported lagers retain appeal among quality-focused drinkers.
Over the forecast period, beer demand is expected to hold steady, thanks to innovations in non/low-alcohol variants and cultural shifts towards healthier drinking. For example, with someone like Gen Z taking the lead, moderation and zero-alcohol beer, as part of the new "sober-curious" trend, and more functional beers with added vitamins and botanicals will enter the market. These all address newer interests in health and wellness, social engagement, and mindful consumption.
Over the coming years, the UK Beer Market is likely to define new boundaries in sustainability and technology. Companies like Heineken and Carlsberg are moving towards environmentally-friendly beer production, using regenerative barley and net-carbon zero processes. This, accompanied by advances in brewing and artificial intelligence marketing, is helping them to achieve higher quality products and increased awareness. Therefore, as long as the market can continue forward through innovation, responsible consumption, and sustainable growth, it should continue to develop.

UK Beer Market Growth DriverIncreasing Popularity of Low-Alcohol Beer Fueled by Tax Incentives
The increasing emphasis on moderation, a healthy lifestyle, and lifestyle approach continues to drive consumption trends in the UK beer market. Furthermore, end-user demand for low-alcohol or alcohol-free beer segments is receiving a boost from recent taxation policies aimed at lower alcohol products. These incentives provide higher margins for producers with the ability to price lower and help spur demand from end-users who are looking for lighter options.
To this point, leading brands are reformulating their flagship beers into low-alcohol versions as these changes will make them more accessible and appealing to end users. This is also a way to bolster brand image by linking it with responsible consumption and wellness consciousness. Moreover, as many brewers tap such incentives, the low-alcohol segment is a major driver underpinning category growth as it also helps to maintain sales even when the economy is under pressure.
UK Beer Market TrendThe Health and Wellness Movement Redefines Drinking Habits
The heightened focus on mental and physical wellbeing is undoubtedly changing how people, particularly in the UK, enjoy beer. Younger age groups, Gen Z in particular, are leaning into moderation, fitness, and mindfulness, fueling higher demand for lower and no alcohol products. This evolution is part of a greater societal change in which balanced lifestyles take precedence over traditional drinking occasions.
Breweries are responding to the demand with new products that will appeal to evolved conscious end usersism. Many have begun to experiment with functional ingredients (such as vitamins and botanicals) and low-calorie formulations as an appealing point for these conscious drinkers. The desire for mindful drinking is changing not only end users preferences but also product development, marketing, and branding strategies across the industry.
Unlock Market Intelligence
Explore the market potential with our data-driven report
UK Beer Market OpportunityInnovation in Brewing and Technology to Enhance Market Growth
The technological advancements in brewing and production will provide new areas for growth in the Uk beer market. The breweries are leveraging modern brewing approaches alongside digital technologies to assist in increasing efficiencies in brewing, creating consistent products, and decreasing waste. Through technology and digitalization, the breweries can achieve their sustainability goals and enhance profits through improved efficiencies in the production processes and reducing operational costs, including but not limited to, energy, labor and materials.
Furthermore, artificial intelligence and data-driven marketing will help brewers better engage with their end users, while better brewing technologies and automation create opportunities for innovation, particularly with non-alcoholic and functional beers. Continuing advances in technology will continue to influence brewing operations and create opportunities for brands to update their operations, strengthen their sustainability commitments, and take advantage of the ongoing evolution in end users' behavior to premium and sustainable produced beverage options.
Unlock Market Intelligence
Explore the market potential with our data-driven report
UK Beer Market Segmentation Analysis
By Product Type
- Dark Beer
- Lager
- Non/Low Alcohol Beer
- Stout
The segment with highest market share under product type is Lager with almost 65% market share. Lager is strong as a product type due its historic presence with in Bbitish culture and the vast range of products available, from premium to mid-priced. The Andy Pandy lager brands such as Budweiser, Heineken, and Carlsberg have maintained strength with a range of variants, some being traditional domestic lagers and other being premium imported products. Lager strength is also driven through continual product reformulations that will reduce the amount of alcohol while still providing an on trend product in relation to end users desire for low and non-alcoholic products.
This shift towards low and non-alcoholic products also lends although to the growing healthy lifestyles, and the UK government taxes promote lower-ABV beers. With ongoing product innovation, solid price positioning and strong brand loyalty lager is in position to maintain is leadership position in the UK beer marketplace over the forecast period.

By Sales Channel
- On-Trade
- Off-Trade
The segment with highest market share under sales channel on-trade segment, with approximately 60% share in the UK beer market, the largest share in any of the sales channels. Pubs, bars, and restaurants hold such a substantial share of beer consumption because of the strong culture of drinking beer in the UK, with beer being embedded in leisure and socializing. Big pub chains and breweries influence end users' consumption choices when end users want an authentic experience and to drink the freshest beers.
The on-trade segment also benefitted from the recovery of out-of-home alcohol consumption, as end users become engaged once again after the pandemic and are liking craft and draught beer selections. Digital ordering systems, taproom offerings, and promotions around major sporting events improve end users footfall and sales in the on-trade channel. With UK pubs and breweries deploying technological advancements and sustainability initiatives in their establishments, we believe the on-trade segment will continue to be the major growth engine of the UK beer market.
List of Companies Covered in UK Beer Market
The companies listed below are highly influential in the UK beer market, with a significant market share and a strong impact on industry developments.
- BrewDog plc
- CKA Holdings Ltd
- Sharp's Brewery Ltd
- Heineken UK Ltd
- Molson Coors Brewing Co (UK) Ltd
- Carlsberg Marston's Brewing Co Ltd
- Diageo Plc
- Asahi UK Ltd
- Shepherd Neame Ltd
- Camden Town Brewery Ltd
Frequently Asked Questions
Related Report
1. Market Segmentation
1.1. Research Scope
1.2. Research Methodology
1.3. Definitions and Assumptions
2. Executive Summary
3. UK Beer Market Policies, Regulations, and Standards
4. UK Beer Market Dynamics
4.1. Growth Factors
4.2. Challenges
4.3. Trends
4.4. Opportunities
5. UK Beer Market Statistics, 2022-2032F
5.1. Market Size & Growth Outlook
5.1.1.By Revenues in US$ Million
5.1.2.By Quantity Sold in Million Litres
5.2. Market Segmentation & Growth Outlook
5.2.1.By Product Type
5.2.1.1. Dark Beer- Market Insights and Forecast 2022-2032, USD Million
5.2.1.1.1. Ale- Market Insights and Forecast 2022-2032, USD Million
5.2.1.1.2. Sorghum Beer- Market Insights and Forecast 2022-2032, USD Million
5.2.1.1.3. Weissbier/Weizen/Wheat Beer- Market Insights and Forecast 2022-2032, USD Million
5.2.1.2. Lager- Market Insights and Forecast 2022-2032, USD Million
5.2.1.2.1. Flavoured/Mixed Lager- Market Insights and Forecast 2022-2032, USD Million
5.2.1.2.2. Standard Lager- Market Insights and Forecast 2022-2032, USD Million
5.2.1.2.2.1. Premium Lager- Market Insights and Forecast 2022-2032, USD Million
5.2.1.2.2.1.1. Domestic Premium Lager- Market Insights and Forecast 2022-2032, USD Million
5.2.1.2.2.1.2. Imported Premium Lager- Market Insights and Forecast 2022-2032, USD Million
5.2.1.2.2.2. Mid-Priced Lager- Market Insights and Forecast 2022-2032, USD Million
5.2.1.2.2.2.1. Domestic Mid-Priced Lager- Market Insights and Forecast 2022-2032, USD Million
5.2.1.2.2.2.2. Imported Mid-Priced Lager- Market Insights and Forecast 2022-2032, USD Million
5.2.1.2.2.3. Economy Lager- Market Insights and Forecast 2022-2032, USD Million
5.2.1.2.2.3.1. Domestic Economy Lager- Market Insights and Forecast 2022-2032, USD Million
5.2.1.2.2.3.2. Imported Economy Lager- Market Insights and Forecast 2022-2032, USD Million
5.2.1.3. Non/Low Alcohol Beer- Market Insights and Forecast 2022-2032, USD Million
5.2.1.3.1. Low Alcohol Beer- Market Insights and Forecast 2022-2032, USD Million
5.2.1.3.2. Non Alcoholic Beer- Market Insights and Forecast 2022-2032, USD Million
5.2.1.4. Stout- Market Insights and Forecast 2022-2032, USD Million
5.2.1.5. Others (Porter, Malt etc.) - Market Insights and Forecast 2022-2032, USD Million
5.2.2.By Production
5.2.2.1. Macro Brewery- Market Insights and Forecast 2022-2032, USD Million
5.2.2.2. Micro Brewery- Market Insights and Forecast 2022-2032, USD Million
5.2.2.3. Craft Brewery- Market Insights and Forecast 2022-2032, USD Million
5.2.3.By Packaging Type
5.2.3.1. Bottles- Market Insights and Forecast 2022-2032, USD Million
5.2.3.2. Cans- Market Insights and Forecast 2022-2032, USD Million
5.2.3.3. Others- Market Insights and Forecast 2022-2032, USD Million
5.2.4.By Sales Channel
5.2.4.1. On-Trade- Market Insights and Forecast 2022-2032, USD Million
5.2.4.2. Off-Trade- Market Insights and Forecast 2022-2032, USD Million
5.2.5.By Competitors
5.2.5.1. Competition Characteristics
5.2.5.2. Market Share & Analysis
6. UK Dark Beer Market Statistics, 2022-2032F
6.1. Market Size & Growth Outlook
6.1.1.By Revenues in US$ Million
6.1.2.By Quantity Sold in Million Litres
6.2. Market Segmentation & Growth Outlook
6.2.1.By Product Type- Market Insights and Forecast 2022-2032, USD Million
6.2.2.By Production- Market Insights and Forecast 2022-2032, USD Million
6.2.3.By Packaging Type- Market Insights and Forecast 2022-2032, USD Million
6.2.4.By Sales Channel- Market Insights and Forecast 2022-2032, USD Million
7. UK Lager Beer Market Statistics, 2022-2032F
7.1. Market Size & Growth Outlook
7.1.1.By Revenues in US$ Million
7.1.2.By Quantity Sold in Million Litres
7.2. Market Segmentation & Growth Outlook
7.2.1.By Product Type- Market Insights and Forecast 2022-2032, USD Million
7.2.2.By Production- Market Insights and Forecast 2022-2032, USD Million
7.2.3.By Packaging Type- Market Insights and Forecast 2022-2032, USD Million
7.2.4.By Sales Channel- Market Insights and Forecast 2022-2032, USD Million
8. UK Non/Low Alcohol Beer Market Statistics, 2022-2032F
8.1. Market Size & Growth Outlook
8.1.1.By Revenues in US$ Million
8.1.2.By Quantity Sold in Million Litres
8.2. Market Segmentation & Growth Outlook
8.2.1.By Production- Market Insights and Forecast 2022-2032, USD Million
8.2.2.By Packaging Type- Market Insights and Forecast 2022-2032, USD Million
8.2.3.By Sales Channel- Market Insights and Forecast 2022-2032, USD Million
9. UK Stout Beer Market Statistics, 2022-2032F
9.1. Market Size & Growth Outlook
9.1.1.By Revenues in US$ Million
9.1.2.By Quantity Sold in Million Litres
9.2. Market Segmentation & Growth Outlook
9.2.1.By Production- Market Insights and Forecast 2022-2032, USD Million
9.2.2.By Packaging Type- Market Insights and Forecast 2022-2032, USD Million
9.2.3.By Sales Channel- Market Insights and Forecast 2022-2032, USD Million
10. Competitive Outlook
10.1. Company Profiles
10.1.1. Heineken UK Ltd
10.1.1.1. Business Description
10.1.1.2. Product Portfolio
10.1.1.3. Collaborations & Alliances
10.1.1.4. Recent Developments
10.1.1.5. Financial Details
10.1.1.6. Others
10.1.2. Molson Coors Brewing Co (UK) Ltd
10.1.2.1. Business Description
10.1.2.2. Product Portfolio
10.1.2.3. Collaborations & Alliances
10.1.2.4. Recent Developments
10.1.2.5. Financial Details
10.1.2.6. Others
10.1.3. Carlsberg Marston's Brewing Co Ltd
10.1.3.1. Business Description
10.1.3.2. Product Portfolio
10.1.3.3. Collaborations & Alliances
10.1.3.4. Recent Developments
10.1.3.5. Financial Details
10.1.3.6. Others
10.1.4. Diageo Plc
10.1.4.1. Business Description
10.1.4.2. Product Portfolio
10.1.4.3. Collaborations & Alliances
10.1.4.4. Recent Developments
10.1.4.5. Financial Details
10.1.4.6. Others
10.1.5. Asahi UK Ltd
10.1.5.1. Business Description
10.1.5.2. Product Portfolio
10.1.5.3. Collaborations & Alliances
10.1.5.4. Recent Developments
10.1.5.5. Financial Details
10.1.5.6. Others
10.1.6. BrewDog plc
10.1.6.1. Business Description
10.1.6.2. Product Portfolio
10.1.6.3. Collaborations & Alliances
10.1.6.4. Recent Developments
10.1.6.5. Financial Details
10.1.6.6. Others
10.1.7. CKA Holdings Ltd
10.1.7.1. Business Description
10.1.7.2. Product Portfolio
10.1.7.3. Collaborations & Alliances
10.1.7.4. Recent Developments
10.1.7.5. Financial Details
10.1.7.6. Others
10.1.8. Sharp's Brewery Ltd
10.1.8.1. Business Description
10.1.8.2. Product Portfolio
10.1.8.3. Collaborations & Alliances
10.1.8.4. Recent Developments
10.1.8.5. Financial Details
10.1.8.6. Others
10.1.9. Shepherd Neame Ltd
10.1.9.1. Business Description
10.1.9.2. Product Portfolio
10.1.9.3. Collaborations & Alliances
10.1.9.4. Recent Developments
10.1.9.5. Financial Details
10.1.9.6. Others
10.1.10. Camden Town Brewery Ltd
10.1.10.1.Business Description
10.1.10.2.Product Portfolio
10.1.10.3.Collaborations & Alliances
10.1.10.4.Recent Developments
10.1.10.5.Financial Details
10.1.10.6.Others
11. Disclaimer
| Segment | Sub-Segment |
|---|---|
| By Product Type |
|
| By Production |
|
| By Packaging Type |
|
| By Sales Channel |
|
Research Methodology
This study followed a structured approach comprising four key phases to assess the size and scope of the electro-oxidation market. The process began with thorough secondary research to collect data on the target market, related markets, and broader industry context. These findings, along with preliminary assumptions and estimates, were then validated through extensive primary research involving industry experts from across the value chain. To calculate the overall market size, both top-down and bottom-up methodologies were employed. Finally, market segmentation and data triangulation techniques were applied to refine and validate segment-level estimations.
Secondary Research
The secondary research phase involved gathering data from a wide range of credible and published sources. This step helped in identifying industry trends, defining market segmentation, and understanding the market landscape and value chain.
Sources consulted during this phase included:
- Company annual reports, investor presentations, and press releases
- Industry white papers and certified publications
- Trade directories and market-recognized databases
- Articles from authoritative authors and reputable journals
- Gold and silver standard websites
Secondary research was critical in mapping out the industry's value chain and monetary flow, identifying key market segments, understanding regional variations, and tracking significant industry developments.
Other key sources:
- Financial disclosures
- Industry associations and trade bodies
- News outlets and business magazines
- Academic journals and research studies
- Paid industry databases
Primary Research
To validate secondary data and gain deeper market insights, primary research was conducted with key stakeholders across both the supply and demand sides of the market.
On the demand side, participants included decision-makers and influencers from end-user industries—such as CIOs, CTOs, and CSOs—who provided first-hand perspectives on market needs, product usage, and future expectations.
On the supply side, interviews were conducted with manufacturers, industry associations, and institutional participants to gather insights into current offerings, product pipelines, and market challenges.
Primary interviews provided critical inputs such as:
- Market size and revenue data
- Product and service breakdowns
- Market forecasts
- Regional and application-specific trends
Stakeholders consulted included:
- Leading OEM and solution providers
- Channel and distribution partners
- End users across various applications
- Independent consultants and industry specialists
Market Size Estimation and Data Triangulation
- Identifying Key Market Participants (Secondary Research)
- Goal: To identify the major players or companies in the target market. This typically involves using publicly available data sources such as industry reports, market research publications, and financial statements of companies.
- Tools: Reports from firms like Gartner, Forrester, Euromonitor, Statista, IBISWorld, and others. Public financial statements, news articles, and press releases from top market players.
- Extracting Earnings of Key Market Participants
- Goal: To estimate the earnings generated from the product or service being analyzed. This step helps in understanding the revenue potential of each market player in a specific geography.
- Methods: Earnings data can be gathered from:
- Publicly available financial reports (for listed companies).
- Interviews and primary data sources from professionals, such as Directors, VPs, SVPs, etc. This is especially useful for understanding more nuanced, internal data that isn't publicly disclosed.
- Annual reports and investor presentations of key players.
- Data Collation and Development of a Relevant Data Model
- Goal: To collate inputs from both primary and secondary sources into a structured, data-driven model for market estimation. This model will incorporate key market KPIs and any independent variables relevant to the market.
- Key KPIs: These could include:
- Market size, growth rate, and demand drivers.
- Industry-specific metrics like market share, average revenue per customer (ARPC), or average deal size.
- External variables, such as economic growth rates, inflation rates, or commodity prices, that could affect the market.
- Data Modeling: Based on this data, the market forecasts are developed for the next 5 years. A combination of trend analysis, scenario modeling, and statistical regression might be used to generate projections.
- Scenario Analysis
- Goal: To test different assumptions and validate how sensitive the market is to changes in key variables (e.g., market demand, regulatory changes, technological disruptions).
- Types of Scenarios:
- Base Case: Based on current assumptions and historical data.
- Best-Case Scenario: Assuming favorable market conditions, regulatory environments, and technological advancements.
- Worst-Case Scenario: Accounting for adverse factors, such as economic downturns, stricter regulations, or unexpected disruptions.


