Turkey Cards and Payments Market Report: Trends, Growth and Forecast (2026-2032)
By Instrument Type (Cards (Debit Card, Charge Card, ATM Card, Pre-Paid Card, Credit Card, Store Card), Mobile Wallets, Cheques, Others), By Card Type (Contact Smart Card, Contactless Smart Card, Non-Smart Card), By Type of Payments (B2B, B2C, C2C, C2B (E-commerce Shopping, Payment at POS Terminals)), By Transaction Type (Domestic, Foreign), By Application (Food & Groceries, Health & Pharmacies, Travel & Tourism, Hospitality, Others (Media & Entertainment)) ... Read more

|
Major Players
|
Turkey Cards and Payments Market Statistics and Insights, 2026
- Market Size Statistics
- Cards and Payments in Turkey is estimated at $ 496.72 Billion.
- The market size is expected to grow to $ 795.1 Billion by 2032.
- Market to register a CAGR of around 6.95% during 2026-32.
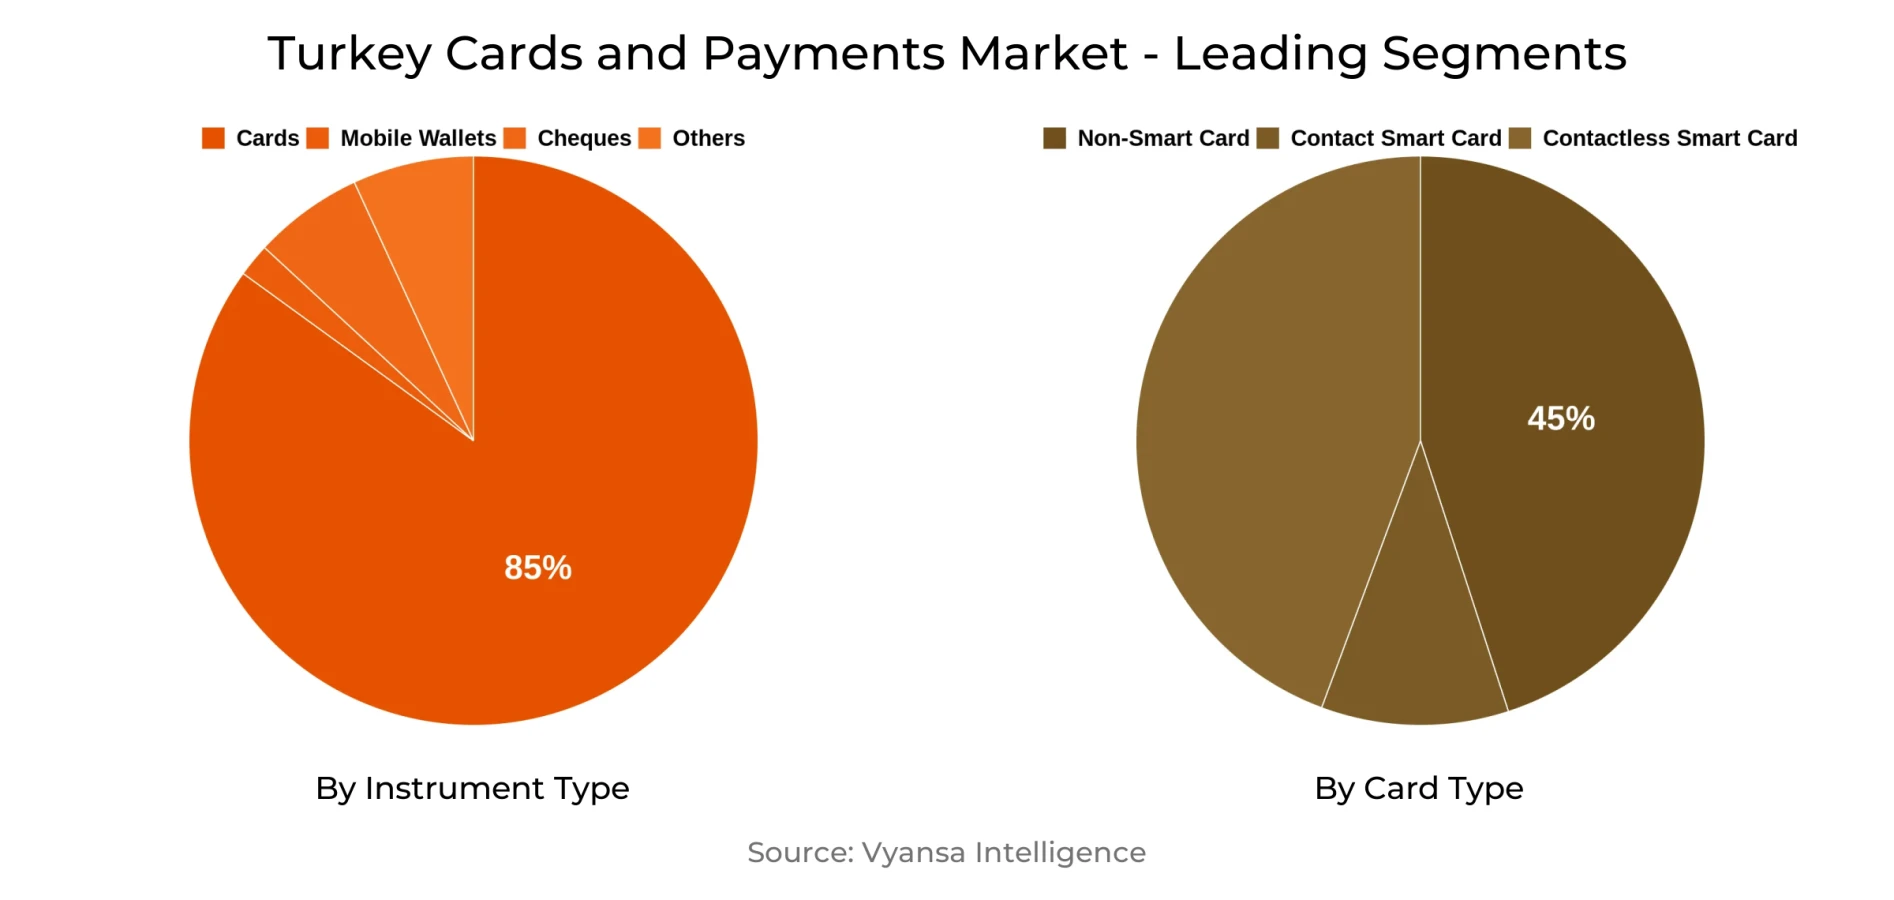
- Instrument Type Shares
- Cards grabbed market share of 85%.
- Cards to witness a volume CAGR of around 4.57%.
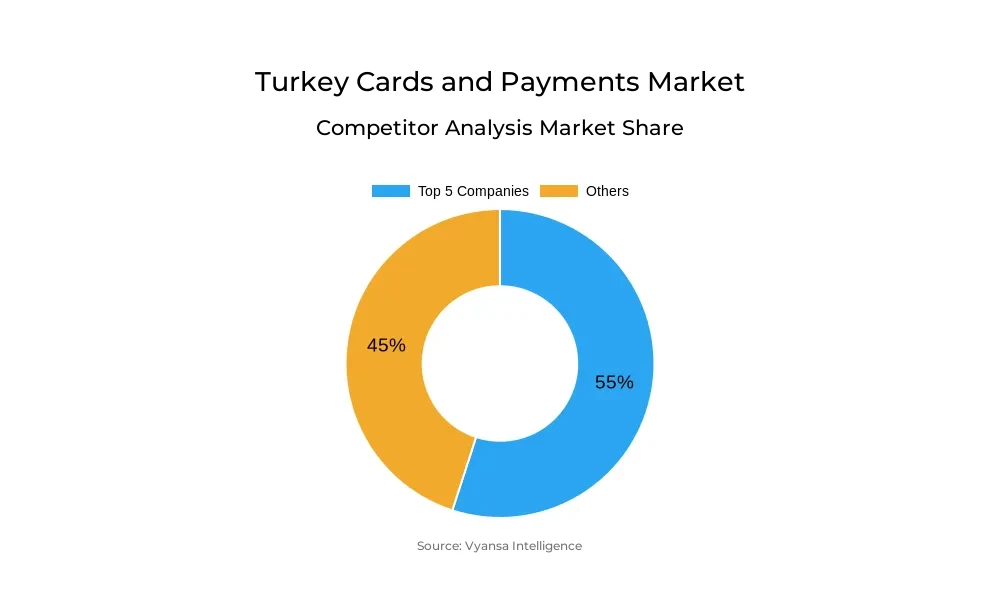
- Competition
- More than 20 companies are actively engaged in producing Cards and Payments in Turkey.
- Top 5 companies acquired 55% of the market share.
- Akbank TAS, Turkiye Vakiflar Bankasi TAO, Turkiye Halk Bankasi AS, Garanti Bankasi AS, Yapi ve Kredi Bankasi AS etc., are few of the top companies.
- Card Type
- Non-Smart Card grabbed 45% of the market.
Turkey Cards and Payments Market Outlook
Turkey cards and payments market will grow progressively, with an estimated value of $496.72 Billion in 2025 and growing to $795.1 Billion by 2032. Growth will be fueled by increased end user use of credit cards, buttressed by increasing living expenses, inflation, and growth in e-commerce. Credit cards will surpass debit cards in value of transactions as end users opt for increasingly flexible payment solutions and instalment patterns available online. Non-smart cards will retain a substantial market share, holding about 45% of the market space, due to continued demand for conventional card types in addition to digital developments. Digitalisation is set to continue reshaping payments, with the use of mobile wallets, contactless cards, and e-wallets becoming more prevalent. The pervasiveness of smartphones and end user familiarity with "bank in your pocket" offerings will promote quicker take-up of mobile payments. The trend will be particularly potent among younger end users, such as students and millennials, who are attracted to digital-first solutions for day-to-day spending on gaming, subscriptions, and food delivery. Usage of digital wallets and contactless payments will augment traditional cards, building a more diverse financial ecosystem.
Sustainable and eco-friendly payment products will also influence the market. Green cards made from recycled or bio-based materials are being launched by credit card companies to attract environmentally conscious and younger end users. Efforts such as bonus donations to social causes based on card usage will also increase end user participation and brand loyalty, making sustainability a difference driver for market participants during the forecast period.
Overall, Turkeyvcards and payments market will grow at a volume CAGR of approximately 4.57% through credit card expansion, adoption of e-commerce, and digital payment innovations. Market growth hints at an equal balance between legacy non-smart cards and emerging digital solutions so that accessibility, convenience, and flexibility are provided for a wide base of end users.
Turkey Cards and Payments Market Growth Driver
Increased end user Dependence on Credit and Digital Payments
Turkey cards and payments market growth is fueled by end users growing use of credit cards. Increasing living expenses, economic instability, and persistent retail price volatility prompt people to utilize credit cards for everyday transactions and significant purchases. Retail e-commerce growth also increases the use of credit cards, with more end users opting to use card payments instead of personal loans to shop online.
Concurrently, there is a trend towards digital and contactless card use. Cash physically becomes cumbersome to work with, as it makes digital and contactless payments more convenient and efficient. Even low-value transactions are made more and more with cards, as it demonstrates a change in end user behavior. These combined drive actively the growth of financial card use and digital payment throughout Turkey over the forecast period.
Turkey Cards and Payments Market Trend
Acceleration of Digital Wallets and Mobile Payments
In Turkey cards and payments market is seeing a significant move towards mobile payments and digital wallets. The prevalence of smartphones and the convenience of carrying a "bank in your pocket" render these digital alternatives more and more appealing to end users. As more end users become increasingly at ease with mobile payments, traditional financial cards come under increasing pressure to change or risk obsolescence.
Card issuers are concentrating on incorporating digital attributes that deliver genuine value alongside security and trust. These encompass frictionless payment experiences, increased safety controls, and intuitive interfaces. During the forecast period, the use of digital wallets and mobile payments keeps growing, influencing the manner in which end users transact and positions the payment ecosystem of Turkey to evolve.
Unlock Market Intelligence
Explore the market potential with our data-driven report
Turkey Cards and Payments Market Opportunity
Opportunity in Eco-Conscious Financial Products
The increasing emphasis on sustainability in Turkey is a major opportunity for financial payments and cards companies to launch green products. Eco-friendly cards using recycled or bioplastic materials resonate with end users caring for the environment, especially the younger generations like millennials and Generation Z. More and more of these end users make financial decisions based on the impact of a brand on the environment, and they need products that support their values.
Financial institutions are leveraging this trend by offering cards that minimize environmental footprint while also integrating meaningful rewards. For instance, some cards allow a portion of earned bonuses to support environmental causes, encouraging customer engagement and loyalty. Over the forecast period, eco-conscious financial products provide an avenue for differentiation in the competitive market, helping players attract new end users and strengthen their brand image while contributing to a sustainable future.
Unlock Market Intelligence
Explore the market potential with our data-driven report
Turkey Cards and Payments Market Segmentation Analysis
By Instrument Type
- Cards
- Mobile Wallets
- Cheques
- Others
The largest market share under the Instrument Type is Cards, taking approximately 85% of the Turkey financial cards and payments market. Credit cards lead this category and are forecast to experience high growth, growing faster than debit cards during the forecast period with a volume CAGR of about 4.57%. This expansion is fueled by credit-reliant end users and the new credit card rules implemented in 2024, which are intended to build a more secure, transparent, and sustainable financial system. The rules support users in controlling their finances better while promoting responsible banking services for the benefit of individuals as well as the overall financial ecosystem.
Debit cards are also anticipated to increase, mainly because of new end users to the banked population, for example, students. Spends for younger end users on gaming, social media giving, TV/movie streaming subscriptions, and food delivery are increasing, driving the usage of e-wallets and digital payments in addition to debit cards. This reflects a clear difference in behavior between credit and debit card segments.
Top Companies in Turkey Cards and Payments Market
The top companies operating in the market include Akbank TAS, Turkiye Vakiflar Bankasi TAO, Turkiye Halk Bankasi AS, Garanti Bankasi AS, Yapi ve Kredi Bankasi AS, Turkiye Is Bankasi AS (Isbank), Turkiye Cumhuriyeti Ziraat Bankasi AS, QNB Finansbank AS, TEB AS, Denizbank, etc., are the top players operating in the Turkey Cards and Payments Market.
Frequently Asked Questions
Related Report
1. Market Segmentation
1.1. Research Scope
1.2. Research Methodology
1.3. Definitions and Assumptions
2. Executive Summary
3. Turkey Cards and Payments Market Policies, Regulations, and Standards
4. Turkey Cards and Payments Market Dynamics
4.1. Growth Factors
4.2. Challenges
4.3. Trends
4.4. Opportunities
5. Turkey Cards and Payments Market Statistics, 2022-2032F
5.1. Market Size & Growth Outlook
5.1.1. By Revenues in US$ Million
5.2. Market Segmentation & Growth Outlook
5.2.1. By Instrument Type
5.2.1.1. Cards- Market Insights and Forecast 2022-2032, USD Million
5.2.1.1.1. Debit Card- Market Insights and Forecast 2022-2032, USD Million
5.2.1.1.2. Charge Card- Market Insights and Forecast 2022-2032, USD Million
5.2.1.1.3. ATM Card- Market Insights and Forecast 2022-2032, USD Million
5.2.1.1.4. Pre-Paid Card- Market Insights and Forecast 2022-2032, USD Million
5.2.1.1.5. Credit Card- Market Insights and Forecast 2022-2032, USD Million
5.2.1.1.6. Store Card- Market Insights and Forecast 2022-2032, USD Million
5.2.1.2. Mobile Wallets- Market Insights and Forecast 2022-2032, USD Million
5.2.1.3. Cheques- Market Insights and Forecast 2022-2032, USD Million
5.2.1.4. Others- Market Insights and Forecast 2022-2032, USD Million
5.2.2. By Card Type
5.2.2.1. Contact Smart Card- Market Insights and Forecast 2022-2032, USD Million
5.2.2.2. Contactless Smart Card- Market Insights and Forecast 2022-2032, USD Million
5.2.2.3. Non-Smart Card- Market Insights and Forecast 2022-2032, USD Million
5.2.3. By Type of Payments
5.2.3.1. B2B- Market Insights and Forecast 2022-2032, USD Million
5.2.3.2. B2C- Market Insights and Forecast 2022-2032, USD Million
5.2.3.3. C2C- Market Insights and Forecast 2022-2032, USD Million
5.2.3.4. C2B- Market Insights and Forecast 2022-2032, USD Million
5.2.3.4.1. E-commerce Shopping- Market Insights and Forecast 2022-2032, USD Million
5.2.3.4.2. Payment at POS Terminals- Market Insights and Forecast 2022-2032, USD Million
5.2.4. By Transaction Type
5.2.4.1. Domestic- Market Insights and Forecast 2022-2032, USD Million
5.2.4.2. Foreign- Market Insights and Forecast 2022-2032, USD Million
5.2.5. By Application
5.2.5.1. Food & Groceries- Market Insights and Forecast 2022-2032, USD Million
5.2.5.2. Health & Pharmacies- Market Insights and Forecast 2022-2032, USD Million
5.2.5.3. Travel & Tourism- Market Insights and Forecast 2022-2032, USD Million
5.2.5.4. Hospitality- Market Insights and Forecast 2022-2032, USD Million
5.2.5.5. Others (Media & Entertainment)- Market Insights and Forecast 2022-2032, USD Million
5.2.6. By Competitors
5.2.6.1. Competition Characteristics
5.2.6.2. Market Share & Analysis
6. Turkey Cards Market Statistics, 2022-2032F
6.1. Market Size & Growth Outlook
6.1.1. By Revenues in US$ Million
6.2. Market Segmentation & Growth Outlook
6.2.1. By Card Type- Market Insights and Forecast 2022-2032, USD Million
6.2.2. By Type of Payments- Market Insights and Forecast 2022-2032, USD Million
6.2.3. By Transaction Type- Market Insights and Forecast 2022-2032, USD Million
6.2.4. By Application- Market Insights and Forecast 2022-2032, USD Million
7. Turkey Mobile Wallets Market Statistics, 2022-2032F
7.1. Market Size & Growth Outlook
7.1.1. By Revenues in US$ Million
7.2. Market Segmentation & Growth Outlook
7.2.1. By Type of Payments- Market Insights and Forecast 2022-2032, USD Million
7.2.2. By Transaction Type- Market Insights and Forecast 2022-2032, USD Million
7.2.3. By Application- Market Insights and Forecast 2022-2032, USD Million
8. Turkey Cheques Market Statistics, 2022-2032F
8.1. Market Size & Growth Outlook
8.1.1. By Revenues in US$ Million
8.2. Market Segmentation & Growth Outlook
8.2.1. By Type of Payments- Market Insights and Forecast 2022-2032, USD Million
8.2.2. By Transaction Type- Market Insights and Forecast 2022-2032, USD Million
8.2.3. By Application- Market Insights and Forecast 2022-2032, USD Million
9. Competitive Outlook
9.1. Company Profiles
9.1.1. Garanti Bankasi AS
9.1.1.1. Business Description
9.1.1.2. Product Portfolio
9.1.1.3. Collaborations & Alliances
9.1.1.4. Recent Developments
9.1.1.5. Financial Details
9.1.1.6. Others
9.1.2. Yapi ve Kredi Bankasi AS
9.1.2.1. Business Description
9.1.2.2. Product Portfolio
9.1.2.3. Collaborations & Alliances
9.1.2.4. Recent Developments
9.1.2.5. Financial Details
9.1.2.6. Others
9.1.3. Turkiye Is Bankasi AS (Isbank)
9.1.3.1. Business Description
9.1.3.2. Product Portfolio
9.1.3.3. Collaborations & Alliances
9.1.3.4. Recent Developments
9.1.3.5. Financial Details
9.1.3.6. Others
9.1.4. Turkiye Cumhuriyeti Ziraat Bankasi AS
9.1.4.1. Business Description
9.1.4.2. Product Portfolio
9.1.4.3. Collaborations & Alliances
9.1.4.4. Recent Developments
9.1.4.5. Financial Details
9.1.4.6. Others
9.1.5. QNB Finansbank AS
9.1.5.1. Business Description
9.1.5.2. Product Portfolio
9.1.5.3. Collaborations & Alliances
9.1.5.4. Recent Developments
9.1.5.5. Financial Details
9.1.5.6. Others
9.1.6. Akbank TAS
9.1.6.1. Business Description
9.1.6.2. Product Portfolio
9.1.6.3. Collaborations & Alliances
9.1.6.4. Recent Developments
9.1.6.5. Financial Details
9.1.6.6. Others
9.1.7. Turkiye Vakiflar Bankasi TAO
9.1.7.1. Business Description
9.1.7.2. Product Portfolio
9.1.7.3. Collaborations & Alliances
9.1.7.4. Recent Developments
9.1.7.5. Financial Details
9.1.7.6. Others
9.1.8. Turkiye Halk Bankasi AS
9.1.8.1. Business Description
9.1.8.2. Product Portfolio
9.1.8.3. Collaborations & Alliances
9.1.8.4. Recent Developments
9.1.8.5. Financial Details
9.1.8.6. Others
9.1.9. TEB AS
9.1.9.1. Business Description
9.1.9.2. Product Portfolio
9.1.9.3. Collaborations & Alliances
9.1.9.4. Recent Developments
9.1.9.5. Financial Details
9.1.9.6. Others
9.1.10. Denizbank
9.1.10.1. Business Description
9.1.10.2. Product Portfolio
9.1.10.3. Collaborations & Alliances
9.1.10.4. Recent Developments
9.1.10.5. Financial Details
9.1.10.6. Others
10. Disclaimer
| Segment | Sub-Segment |
|---|---|
| By Instrument Type |
|
| By Card Type |
|
| By Type of Payments |
|
| By Transaction Type |
|
| By Application |
|
Research Methodology
This study followed a structured approach comprising four key phases to assess the size and scope of the electro-oxidation market. The process began with thorough secondary research to collect data on the target market, related markets, and broader industry context. These findings, along with preliminary assumptions and estimates, were then validated through extensive primary research involving industry experts from across the value chain. To calculate the overall market size, both top-down and bottom-up methodologies were employed. Finally, market segmentation and data triangulation techniques were applied to refine and validate segment-level estimations.
Secondary Research
The secondary research phase involved gathering data from a wide range of credible and published sources. This step helped in identifying industry trends, defining market segmentation, and understanding the market landscape and value chain.
Sources consulted during this phase included:
- Company annual reports, investor presentations, and press releases
- Industry white papers and certified publications
- Trade directories and market-recognized databases
- Articles from authoritative authors and reputable journals
- Gold and silver standard websites
Secondary research was critical in mapping out the industry's value chain and monetary flow, identifying key market segments, understanding regional variations, and tracking significant industry developments.
Other key sources:
- Financial disclosures
- Industry associations and trade bodies
- News outlets and business magazines
- Academic journals and research studies
- Paid industry databases
Primary Research
To validate secondary data and gain deeper market insights, primary research was conducted with key stakeholders across both the supply and demand sides of the market.
On the demand side, participants included decision-makers and influencers from end-user industries—such as CIOs, CTOs, and CSOs—who provided first-hand perspectives on market needs, product usage, and future expectations.
On the supply side, interviews were conducted with manufacturers, industry associations, and institutional participants to gather insights into current offerings, product pipelines, and market challenges.
Primary interviews provided critical inputs such as:
- Market size and revenue data
- Product and service breakdowns
- Market forecasts
- Regional and application-specific trends
Stakeholders consulted included:
- Leading OEM and solution providers
- Channel and distribution partners
- End users across various applications
- Independent consultants and industry specialists
Market Size Estimation and Data Triangulation
- Identifying Key Market Participants (Secondary Research)
- Goal: To identify the major players or companies in the target market. This typically involves using publicly available data sources such as industry reports, market research publications, and financial statements of companies.
- Tools: Reports from firms like Gartner, Forrester, Euromonitor, Statista, IBISWorld, and others. Public financial statements, news articles, and press releases from top market players.
- Extracting Earnings of Key Market Participants
- Goal: To estimate the earnings generated from the product or service being analyzed. This step helps in understanding the revenue potential of each market player in a specific geography.
- Methods: Earnings data can be gathered from:
- Publicly available financial reports (for listed companies).
- Interviews and primary data sources from professionals, such as Directors, VPs, SVPs, etc. This is especially useful for understanding more nuanced, internal data that isn't publicly disclosed.
- Annual reports and investor presentations of key players.
- Data Collation and Development of a Relevant Data Model
- Goal: To collate inputs from both primary and secondary sources into a structured, data-driven model for market estimation. This model will incorporate key market KPIs and any independent variables relevant to the market.
- Key KPIs: These could include:
- Market size, growth rate, and demand drivers.
- Industry-specific metrics like market share, average revenue per customer (ARPC), or average deal size.
- External variables, such as economic growth rates, inflation rates, or commodity prices, that could affect the market.
- Data Modeling: Based on this data, the market forecasts are developed for the next 5 years. A combination of trend analysis, scenario modeling, and statistical regression might be used to generate projections.
- Scenario Analysis
- Goal: To test different assumptions and validate how sensitive the market is to changes in key variables (e.g., market demand, regulatory changes, technological disruptions).
- Types of Scenarios:
- Base Case: Based on current assumptions and historical data.
- Best-Case Scenario: Assuming favorable market conditions, regulatory environments, and technological advancements.
- Worst-Case Scenario: Accounting for adverse factors, such as economic downturns, stricter regulations, or unexpected disruptions.


