South Korea Bottled Water Market Report: Trends, Growth and Forecast (2026-2032)
By Type of Water (Carbonated Bottled Water, Flavoured Bottled Water, Functional Bottled Water, Still Bottled Water), By Sub Types (Purified (Desalinated, Atmospheric Generated, Others), Mineral, Other (Spring, Alkaline, Other)), By Packaging Material (Flexible Packaging (Aluminium, Pouches), Glass, Rigid Plastic (PET Bottles, Thin Wall Plastic Containers, Others)), By Price Category (Budget, Economy, Premium), By Pack Size (100 ml, 125 ml, 200 ml, 250 ml, 330 ml, 370 ml, 450 ml, 500 ml, 591 ml, 750 ml, 1,000 ml, 1,500 ml, 4,000 ml, 5,000 ml, Others), By Sales Channel (On Trade (Restaurants, Hotels, Cafes, Others), Off Trade (Grocery Retailers (Convenience Retail, Supermarkets, Hypermarkets, Small Local Grocer), Non-Grocery Retailers (General Merchandise Stores, Health and Beauty Specialists), Vending, E-commerce)) ... Read more
|
Major Players
|
South Korea Bottled Water Market Statistics and Insights, 2026
- Market Size Statistics
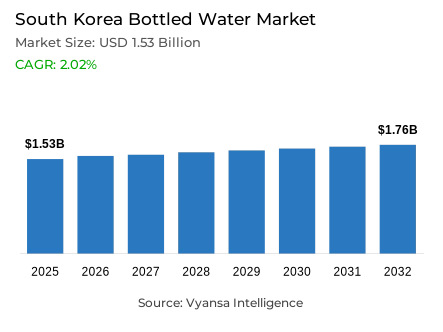
- Bottled water market size in South Korea was estimated at USD 1.53 billion in 2025.
- The market size is expected to grow to USD 1.76 billion by 2032.
- Market to register a CAGR of around 2.02% during 2026-32.
- Type of Water Shares
- Still bottled water grabbed market share of 85%.
- Competition
- Bottled water in South Korea is currently being catered to by more than 15 companies.
- Top 5 companies acquired around 65% of the market share.
- Haitai HTB Co Ltd, Hite Jinro Co Ltd, Woongjin Food Co Ltd, Kwang Dong Pharm Co Ltd, Lotte Chilsung Beverage Co Ltd etc., are few of the top companies.
- Sales Channel
- Off trade grabbed 75% of the market.
South Korea Bottled Water Market Outlook
The South Korea bottled water market is estimated at US$ 1.53 billion in 2025 and is projected to reach US$ 1.76 billion in 2032, representing a CAGR of about 2.02%. This consistent demand is driven by household structural shifts, with one- and two-person households accounting for 64.2% of the total. These smaller households prioritise convenience and portability, with 34.3% using bottled spring water instead of tap water. Still bottled water remains dominant, holding 85% market share.
The off-trade channel leads sales with 75% of the market, reinforcing bottled water’s role as a household staple purchased through bulk and subscription models. Online food and beverage transactions increased 18.0% year-on-year in April 2024, reducing friction in repeat purchasing and enabling brands to focus on efficient home delivery and better-for-you product development.
Sustainability and health continue to reshape the market. From January 2026, label-free packaging will become mandatory for small-pack bottled water, improving recyclability. Meanwhile, with adult obesity prevalence at 37.2%, consumers are shifting toward lower-sugar options such as mineral-enriched and sparkling waters, supporting premiumisation.
However, demographic decline remains a structural challenge. Natural population contraction limits volume expansion, intensifying competition in a saturated market. Despite this, bottled water remains resilient by aligning with environmental regulation, leveraging strong e-commerce adoption, and meeting evolving health-driven consumption preferences.

South Korea Bottled Water Market Growth Driver
Online Convenience and Smaller Households Support Regular Purchases
South Korea’s household structure supports frequent, smaller-basket buying of daily essentials. The 2023 Population and Housing Census shows one- and two-person households reach 14.18 million, or 64.2% of all households, favouring convenient packaged hydration that is easy to store and reorder. This demand also shows up in government survey work: in the 2024 “tap water drinking” survey, 34.3% of sampled households report purchasing and drinking bottled spring water.
Digital retail infrastructure further strengthens repeat purchases by reducing friction. Statistics Korea reports online shopping transaction value for “food and beverages” rises 18.0% year-on-year in April 2024, signalling strong adoption of e-commerce for consumables. Together, smaller households and strong online purchasing habits keep bottled water resilient and support ongoing brand investment in home delivery and subscription-style services.
South Korea Bottled Water Market Challenge
Demographic Decline Limits Category Momentum
The reduced population reduces the base of consumption of packaged staples, including bottled water. According to the 2024 vital statistics of Statistics Korea, the birth rate was 238.3 thousand births and the death rate was 358.4 thousand deaths, resulting in a natural population decrease of 120.1 thousand people and a natural increase rate of -2.4 per 1,000 population. This structural demographic headwind continues to put strain on volume-based categories in 2026.
At the same time, market saturation increases competition as brands compete to capture the same consumer segments through promotions, private labels, and channel incentives. As the number of households and family size decreases, firms must seek stronger differentiation—whether in flavour, convenience, or sustainability—while logistics costs rise as the market demands faster and cheaper delivery.
Unlock Market Intelligence
Explore the market potential with our data-driven report
South Korea Bottled Water Market Trend
Sustainable Packaging Becomes a Regulatory Standard
Sustainability is moving from voluntary action to compliance in South Korea’s bottled water landscape. From January 2026, label-free packaging becomes the default for small-pack bottled water distributed through online and offline channels, with a one-year transition period for single-bottle products sold offline. This shift reflects policy focus on improving recyclability and reducing plastic waste at scale.
The Ministry of Environment links the policy to measurable waste reduction. Based on 2024 production of 5.2 billion bottled-water units, the ministry estimates label-free conversion cuts plastic label use by about 2,270 tonnes per year. As a result, brands are redesigning bottles, adding QR-based product information, and aligning packaging formats across SKUs to meet the new standard while preserving shelf appeal.
South Korea Bottled Water Market Opportunity
Health-Led Premiumisation Opens Space for Value-Added Water
Bottled water is increasingly becoming part of a healthier consumer lifestyle, creating room for functional and premium products. According to official Korea statistics, adult obesity prevalence was 37.2% in 2023, highlighting interest in weight control and low-sugar options. This health context supports demand for sparkling and flavoured waters positioned as alternatives to sugar-sweetened carbonates.
For manufacturers, the opportunity lies in expanding better-for-you portfolios that add perceived value without sugar, including mineral-enriched waters, exercise hydration products, and clean-label flavoured sparkling water. Transparent ingredient communication, convenient online delivery formats, and optimised pack sizes help justify premium pricing and foster loyalty in a mature, competitive category.
Unlock Market Intelligence
Explore the market potential with our data-driven report
South Korea Bottled Water Market Segmentation Analysis
By Type of Water
- Carbonated Bottled Water
- Flavoured Bottled Water
- Functional Bottled Water
- Still Bottled Water
The segment with the highest share is still bottled water, which holds 85% of the market. This dominance reflects demand driven by routine hydration rather than occasional flavour exploration. It also aligns with government evidence: the 2024 national tap-water survey shows 34.3% of households report purchasing and drinking bottled spring water, underlining the everyday role of still water in home consumption.
Because still water is used daily, shoppers prioritise trusted sourcing, consistent taste, and practical pack formats such as multi-packs, family sizes, and compact bottles. For brands, the large still-water base supports scale efficiencies in production and distribution, while leaving a smaller but visible space for carbonated and flavoured waters to serve lifestyle occasions like exercise, travel, and “better-for-you” refreshment.

By Sales Channel
- On Trade
- Restaurants
- Hotels
- Cafes
- Others
- Off Trade
- Grocery Retailers
- Convenience Retail
- Supermarkets
- Hypermarkets
- Small Local Grocer
- Non-Grocery Retailers
- General Merchandise Stores
- Health and Beauty Specialists
- Vending
- E-commerce
- Grocery Retailers
The sales channel with the highest share is off-trade, accounting for 75% of the market. This reflects bottled water’s role as a take-home staple, with consumers preferring multi-pack purchases through grocery, convenience, and online channels rather than relying on on-premise consumption. Off-trade dominance also supports subscription and bulk-delivery models that reduce per-unit costs and simplify replenishment.
Within off-trade, retail e-commerce strengthens its role through price comparison, fast delivery, and easy reordering. Supporting this, Statistics Korea reports “food and beverages” online shopping value rose 18.0% year-on-year in April 2024, indicating strong digital purchasing of consumables typically found in off-trade baskets. Channel leadership increasingly depends on digital merchandising, reliable last-mile logistics, and pack formats suitable for delivery and immediate consumption.
List of Companies Covered in South Korea Bottled Water Market
The companies listed below are highly influential in the South Korea bottled water market, with a significant market share and a strong impact on industry developments.
- Haitai HTB Co Ltd
- Hite Jinro Co Ltd
- Woongjin Food Co Ltd
- Kwang Dong Pharm Co Ltd
- Lotte Chilsung Beverage Co Ltd
- Coupang Corp
- Nongshim Co Ltd
- Coca-Cola Korea Co Ltd
- Pulmuone Mineral Water
- Dongwon F&B Co Ltd
Competitive Landscape
South Korea’s bottled water market in 2025 is characterised by a clear hierarchy alongside rising competitive pressure. Kwang Dong Pharm Co Ltd continues to lead off-trade volume sales through Jeju Samdasoo, reinforced by securing exclusive nationwide sales rights for 2026–2029, reflecting its entrenched distribution strength despite slight share erosion. At the same time, Woongjin Food Co Ltd has emerged as the most dynamic player, driven by Victoria’s strong performance in flavoured and carbonated bottled water, supported by extensive flavour innovation and aggressive online promotions. In parallel, private label bottled water is reshaping competition, gaining share through sharp pricing, subscription models and logistics advantages, particularly via Coupang and Emart, intensifying pressure on established branded players.
Frequently Asked Questions
Related Report
1. Market Segmentation
1.1. Research Scope
1.2. Research Methodology
1.3. Definitions and Assumptions
2. Executive Summary
3. South Korea Bottled Water Market Policies, Regulations, and Standards
4. South Korea Bottled Water Market Dynamics
4.1. Growth Factors
4.2. Challenges
4.3. Trends
4.4. Opportunities
5. South Korea Bottled Water Market Statistics, 2022-2032F
5.1. Market Size & Growth Outlook
5.1.1.By Revenues in USD Million
5.1.2.By Volume (Million Litres)
5.2. Market Segmentation & Growth Outlook
5.2.1.By Type of Water
5.2.1.1. Carbonated Bottled Water- Market Insights and Forecast 2022-2032, USD Million
5.2.1.2. Flavoured Bottled Water- Market Insights and Forecast 2022-2032, USD Million
5.2.1.3. Functional Bottled Water- Market Insights and Forecast 2022-2032, USD Million
5.2.1.4. Still Bottled Water- Market Insights and Forecast 2022-2032, USD Million
5.2.2.By Sub Types
5.2.2.1. Purified- Market Insights and Forecast 2022-2032, USD Million
5.2.2.1.1. Desalinated- Market Insights and Forecast 2022-2032, USD Million
5.2.2.1.2. Atmospheric Generated- Market Insights and Forecast 2022-2032, USD Million
5.2.2.1.3. Others- Market Insights and Forecast 2022-2032, USD Million
5.2.2.2. Mineral- Market Insights and Forecast 2022-2032, USD Million
5.2.2.3. Other (Spring, Alkaline, Other) - Market Insights and Forecast 2022-2032, USD Million
5.2.3.By Packaging Material
5.2.3.1. Flexible Packaging- Market Insights and Forecast 2022-2032, USD Million
5.2.3.1.1. Aluminium- Market Insights and Forecast 2022-2032, USD Million
5.2.3.1.2. Pouches- Market Insights and Forecast 2022-2032, USD Million
5.2.3.2. Glass- Market Insights and Forecast 2022-2032, USD Million
5.2.3.3. Rigid Plastic- Market Insights and Forecast 2022-2032, USD Million
5.2.3.3.1. PET Bottles- Market Insights and Forecast 2022-2032, USD Million
5.2.3.3.2. Thin Wall Plastic Containers- Market Insights and Forecast 2022-2032, USD Million
5.2.3.3.3. Others- Market Insights and Forecast 2022-2032, USD Million
5.2.4.By Price Category
5.2.4.1. Budget- Market Insights and Forecast 2022-2032, USD Million
5.2.4.2. Economy- Market Insights and Forecast 2022-2032, USD Million
5.2.4.3. Premium- Market Insights and Forecast 2022-2032, USD Million
5.2.5.By Pack Size
5.2.5.1. 100 ml- Market Insights and Forecast 2022-2032, USD Million
5.2.5.2. 125 ml- Market Insights and Forecast 2022-2032, USD Million
5.2.5.3. 200 ml- Market Insights and Forecast 2022-2032, USD Million
5.2.5.4. 250 ml- Market Insights and Forecast 2022-2032, USD Million
5.2.5.5. 330 ml- Market Insights and Forecast 2022-2032, USD Million
5.2.5.6. 370 ml- Market Insights and Forecast 2022-2032, USD Million
5.2.5.7. 450 ml- Market Insights and Forecast 2022-2032, USD Million
5.2.5.8. 500 ml- Market Insights and Forecast 2022-2032, USD Million
5.2.5.9. 591 ml- Market Insights and Forecast 2022-2032, USD Million
5.2.5.10. 750 ml- Market Insights and Forecast 2022-2032, USD Million
5.2.5.11. 1,000 ml- Market Insights and Forecast 2022-2032, USD Million
5.2.5.12. 1,500 ml- Market Insights and Forecast 2022-2032, USD Million
5.2.5.13. 4,000 ml- Market Insights and Forecast 2022-2032, USD Million
5.2.5.14. 5,000 ml- Market Insights and Forecast 2022-2032, USD Million
5.2.5.15. Others- Market Insights and Forecast 2022-2032, USD Million
5.2.6.By Sales Channel
5.2.6.1. On Trade- Market Insights and Forecast 2022-2032, USD Million
5.2.6.1.1. Restaurants- Market Insights and Forecast 2022-2032, USD Million
5.2.6.1.2. Hotels- Market Insights and Forecast 2022-2032, USD Million
5.2.6.1.3. Cafes- Market Insights and Forecast 2022-2032, USD Million
5.2.6.1.4. Others- Market Insights and Forecast 2022-2032, USD Million
5.2.6.2. Off Trade- Market Insights and Forecast 2022-2032, USD Million
5.2.6.2.1. Grocery Retailers- Market Insights and Forecast 2022-2032, USD Million
5.2.6.2.1.1. Convenience Retail- Market Insights and Forecast 2022-2032, USD Million
5.2.6.2.1.2. Supermarkets- Market Insights and Forecast 2022-2032, USD Million
5.2.6.2.1.3. Hypermarkets- Market Insights and Forecast 2022-2032, USD Million
5.2.6.2.1.4. Small Local Grocer- Market Insights and Forecast 2022-2032, USD Million
5.2.6.2.2. Non-Grocery Retailers- Market Insights and Forecast 2022-2032, USD Million
5.2.6.2.2.1. General Merchandise Stores- Market Insights and Forecast 2022-2032, USD Million
5.2.6.2.2.2. Health and Beauty Specialists- Market Insights and Forecast 2022-2032, USD Million
5.2.6.2.3. Vending- Market Insights and Forecast 2022-2032, USD Million
5.2.6.2.4. E-commerce- Market Insights and Forecast 2022-2032, USD Million
5.2.7.By Competitors
5.2.7.1. Competition Characteristics
5.2.7.2. Market Share & Analysis
6. South Korea Carbonated Bottled Water Market Statistics, 2022-2032
6.1. Market Size & Growth Outlook
6.1.1.By Revenues in USD Million
6.1.2.By Volume (Million Litres)
6.2. Market Segmentation & Growth Outlook
6.2.1.By Sub Types- Market Insights and Forecast 2022-2032, USD Million
6.2.2.By Packaging Material- Market Insights and Forecast 2022-2032, USD Million
6.2.3.By Pack Size- Market Insights and Forecast 2022-2032, USD Million
6.2.4.By Price Category- Market Insights and Forecast 2022-2032, USD Million
6.2.5.By Sales Channel- Market Insights and Forecast 2022-2032, USD Million
7. South Korea Flavoured Bottled Water Market Statistics, 2022-2032
7.1. Market Size & Growth Outlook
7.1.1.By Revenues in USD Million
7.1.2.By Volume (Million Litres)
7.2. Market Segmentation & Growth Outlook
7.2.1.By Sub Types- Market Insights and Forecast 2022-2032, USD Million
7.2.2.By Packaging Material- Market Insights and Forecast 2022-2032, USD Million
7.2.3.By Pack Size- Market Insights and Forecast 2022-2032, USD Million
7.2.4.By Price Category- Market Insights and Forecast 2022-2032, USD Million
7.2.5.By Sales Channel- Market Insights and Forecast 2022-2032, USD Million
8. South Korea Functional Bottled Water Market Statistics, 2022-2032
8.1. Market Size & Growth Outlook
8.1.1.By Revenues in USD Million
8.1.2.By Volume (Million Litres)
8.2. Market Segmentation & Growth Outlook
8.2.1.By Sub Types- Market Insights and Forecast 2022-2032, USD Million
8.2.2.By Packaging Material- Market Insights and Forecast 2022-2032, USD Million
8.2.3.By Pack Size- Market Insights and Forecast 2022-2032, USD Million
8.2.4.By Price Category- Market Insights and Forecast 2022-2032, USD Million
8.2.5.By Sales Channel- Market Insights and Forecast 2022-2032, USD Million
9. South Korea Still Bottled Water Market Statistics, 2022-2032
9.1. Market Size & Growth Outlook
9.1.1.By Revenues in USD Million
9.1.2.By Volume (Million Litres)
9.2. Market Segmentation & Growth Outlook
9.2.1.By Sub Types- Market Insights and Forecast 2022-2032, USD Million
9.2.2.By Packaging Material- Market Insights and Forecast 2022-2032, USD Million
9.2.3.By Pack Size- Market Insights and Forecast 2022-2032, USD Million
9.2.4.By Price Category- Market Insights and Forecast 2022-2032, USD Million
9.2.5.By Sales Channel- Market Insights and Forecast 2022-2032, USD Million
10. Competitive Outlook
10.1. Company Profiles
10.1.1. Kwang Dong Pharm Co Ltd
10.1.1.1. Business Description
10.1.1.2. Product Portfolio
10.1.1.3. Collaborations & Alliances
10.1.1.4. Recent Developments
10.1.1.5. Financial Details
10.1.1.6. Others
10.1.2. Lotte Chilsung Beverage Co Ltd
10.1.2.1. Business Description
10.1.2.2. Product Portfolio
10.1.2.3. Collaborations & Alliances
10.1.2.4. Recent Developments
10.1.2.5. Financial Details
10.1.2.6. Others
10.1.3. Coupang Corp
10.1.3.1. Business Description
10.1.3.2. Product Portfolio
10.1.3.3. Collaborations & Alliances
10.1.3.4. Recent Developments
10.1.3.5. Financial Details
10.1.3.6. Others
10.1.4. Nongshim Co Ltd
10.1.4.1. Business Description
10.1.4.2. Product Portfolio
10.1.4.3. Collaborations & Alliances
10.1.4.4. Recent Developments
10.1.4.5. Financial Details
10.1.4.6. Others
10.1.5. Coca-Cola Korea Co Ltd
10.1.5.1. Business Description
10.1.5.2. Product Portfolio
10.1.5.3. Collaborations & Alliances
10.1.5.4. Recent Developments
10.1.5.5. Financial Details
10.1.5.6. Others
10.1.6. Haitai HTB Co Ltd
10.1.6.1. Business Description
10.1.6.2. Product Portfolio
10.1.6.3. Collaborations & Alliances
10.1.6.4. Recent Developments
10.1.6.5. Financial Details
10.1.6.6. Others
10.1.7. Hite Jinro Co Ltd
10.1.7.1. Business Description
10.1.7.2. Product Portfolio
10.1.7.3. Collaborations & Alliances
10.1.7.4. Recent Developments
10.1.7.5. Financial Details
10.1.7.6. Others
10.1.8. Woongjin Food Co Ltd
10.1.8.1. Business Description
10.1.8.2. Product Portfolio
10.1.8.3. Collaborations & Alliances
10.1.8.4. Recent Developments
10.1.8.5. Financial Details
10.1.8.6. Others
10.1.9. Pulmuone Mineral Water
10.1.9.1. Business Description
10.1.9.2. Product Portfolio
10.1.9.3. Collaborations & Alliances
10.1.9.4. Recent Developments
10.1.9.5. Financial Details
10.1.9.6. Others
10.1.10. Dongwon F&B Co Ltd
10.1.10.1.Business Description
10.1.10.2.Product Portfolio
10.1.10.3.Collaborations & Alliances
10.1.10.4.Recent Developments
10.1.10.5.Financial Details
10.1.10.6.Others
11. Disclaimer
| Segment | Sub-Segment |
|---|---|
| By Type of Water |
|
| By Sub Types |
|
| By Packaging Material |
|
| By Price Category |
|
| By Pack Size |
|
| By Sales Channel |
|
Research Methodology
This study followed a structured approach comprising four key phases to assess the size and scope of the electro-oxidation market. The process began with thorough secondary research to collect data on the target market, related markets, and broader industry context. These findings, along with preliminary assumptions and estimates, were then validated through extensive primary research involving industry experts from across the value chain. To calculate the overall market size, both top-down and bottom-up methodologies were employed. Finally, market segmentation and data triangulation techniques were applied to refine and validate segment-level estimations.
Secondary Research
The secondary research phase involved gathering data from a wide range of credible and published sources. This step helped in identifying industry trends, defining market segmentation, and understanding the market landscape and value chain.
Sources consulted during this phase included:
- Company annual reports, investor presentations, and press releases
- Industry white papers and certified publications
- Trade directories and market-recognized databases
- Articles from authoritative authors and reputable journals
- Gold and silver standard websites
Secondary research was critical in mapping out the industry's value chain and monetary flow, identifying key market segments, understanding regional variations, and tracking significant industry developments.
Other key sources:
- Financial disclosures
- Industry associations and trade bodies
- News outlets and business magazines
- Academic journals and research studies
- Paid industry databases
Primary Research
To validate secondary data and gain deeper market insights, primary research was conducted with key stakeholders across both the supply and demand sides of the market.
On the demand side, participants included decision-makers and influencers from end-user industries—such as CIOs, CTOs, and CSOs—who provided first-hand perspectives on market needs, product usage, and future expectations.
On the supply side, interviews were conducted with manufacturers, industry associations, and institutional participants to gather insights into current offerings, product pipelines, and market challenges.
Primary interviews provided critical inputs such as:
- Market size and revenue data
- Product and service breakdowns
- Market forecasts
- Regional and application-specific trends
Stakeholders consulted included:
- Leading OEM and solution providers
- Channel and distribution partners
- End users across various applications
- Independent consultants and industry specialists
Market Size Estimation and Data Triangulation
- Identifying Key Market Participants (Secondary Research)
- Goal: To identify the major players or companies in the target market. This typically involves using publicly available data sources such as industry reports, market research publications, and financial statements of companies.
- Tools: Reports from firms like Gartner, Forrester, Euromonitor, Statista, IBISWorld, and others. Public financial statements, news articles, and press releases from top market players.
- Extracting Earnings of Key Market Participants
- Goal: To estimate the earnings generated from the product or service being analyzed. This step helps in understanding the revenue potential of each market player in a specific geography.
- Methods: Earnings data can be gathered from:
- Publicly available financial reports (for listed companies).
- Interviews and primary data sources from professionals, such as Directors, VPs, SVPs, etc. This is especially useful for understanding more nuanced, internal data that isn't publicly disclosed.
- Annual reports and investor presentations of key players.
- Data Collation and Development of a Relevant Data Model
- Goal: To collate inputs from both primary and secondary sources into a structured, data-driven model for market estimation. This model will incorporate key market KPIs and any independent variables relevant to the market.
- Key KPIs: These could include:
- Market size, growth rate, and demand drivers.
- Industry-specific metrics like market share, average revenue per customer (ARPC), or average deal size.
- External variables, such as economic growth rates, inflation rates, or commodity prices, that could affect the market.
- Data Modeling: Based on this data, the market forecasts are developed for the next 5 years. A combination of trend analysis, scenario modeling, and statistical regression might be used to generate projections.
- Scenario Analysis
- Goal: To test different assumptions and validate how sensitive the market is to changes in key variables (e.g., market demand, regulatory changes, technological disruptions).
- Types of Scenarios:
- Base Case: Based on current assumptions and historical data.
- Best-Case Scenario: Assuming favorable market conditions, regulatory environments, and technological advancements.
- Worst-Case Scenario: Accounting for adverse factors, such as economic downturns, stricter regulations, or unexpected disruptions.


