South America Water Pump Market Report: Trends, Growth and Forecast (2026-2032)
By Pump Type (Centrifugal Pump (Overhung Pumps (Vertical Line, Horizontal End Suction), Split Case Pumps (Single/Two Stage, Multi Stage), Vertical Pumps (Turbine, Axial, Mixed Flow), Submersible Pumps (Solid Handling, Non-Solid Handling)), Positive Displacement Pump (Diaphragm Pumps, Piston Pumps, Gear Pumps, Lobe Pumps, Progressive Cavity Pumps, Screw Pumps, Vane Pumps, Peristaltic Pumps, Others)), By End User (Oil & Gas, Power, Residential, Agriculture & Irrigation, Commercial Building, HVAC, Chemical, Water & Wastewater, Food & Beverage, Others), By Country (Brazil, Argentina, Chile, Peru, Rest of South America) ... Read more
|
Major Players
|
South America Water Pump Market Statistics and Insights, 2026
- Market Size Statistics
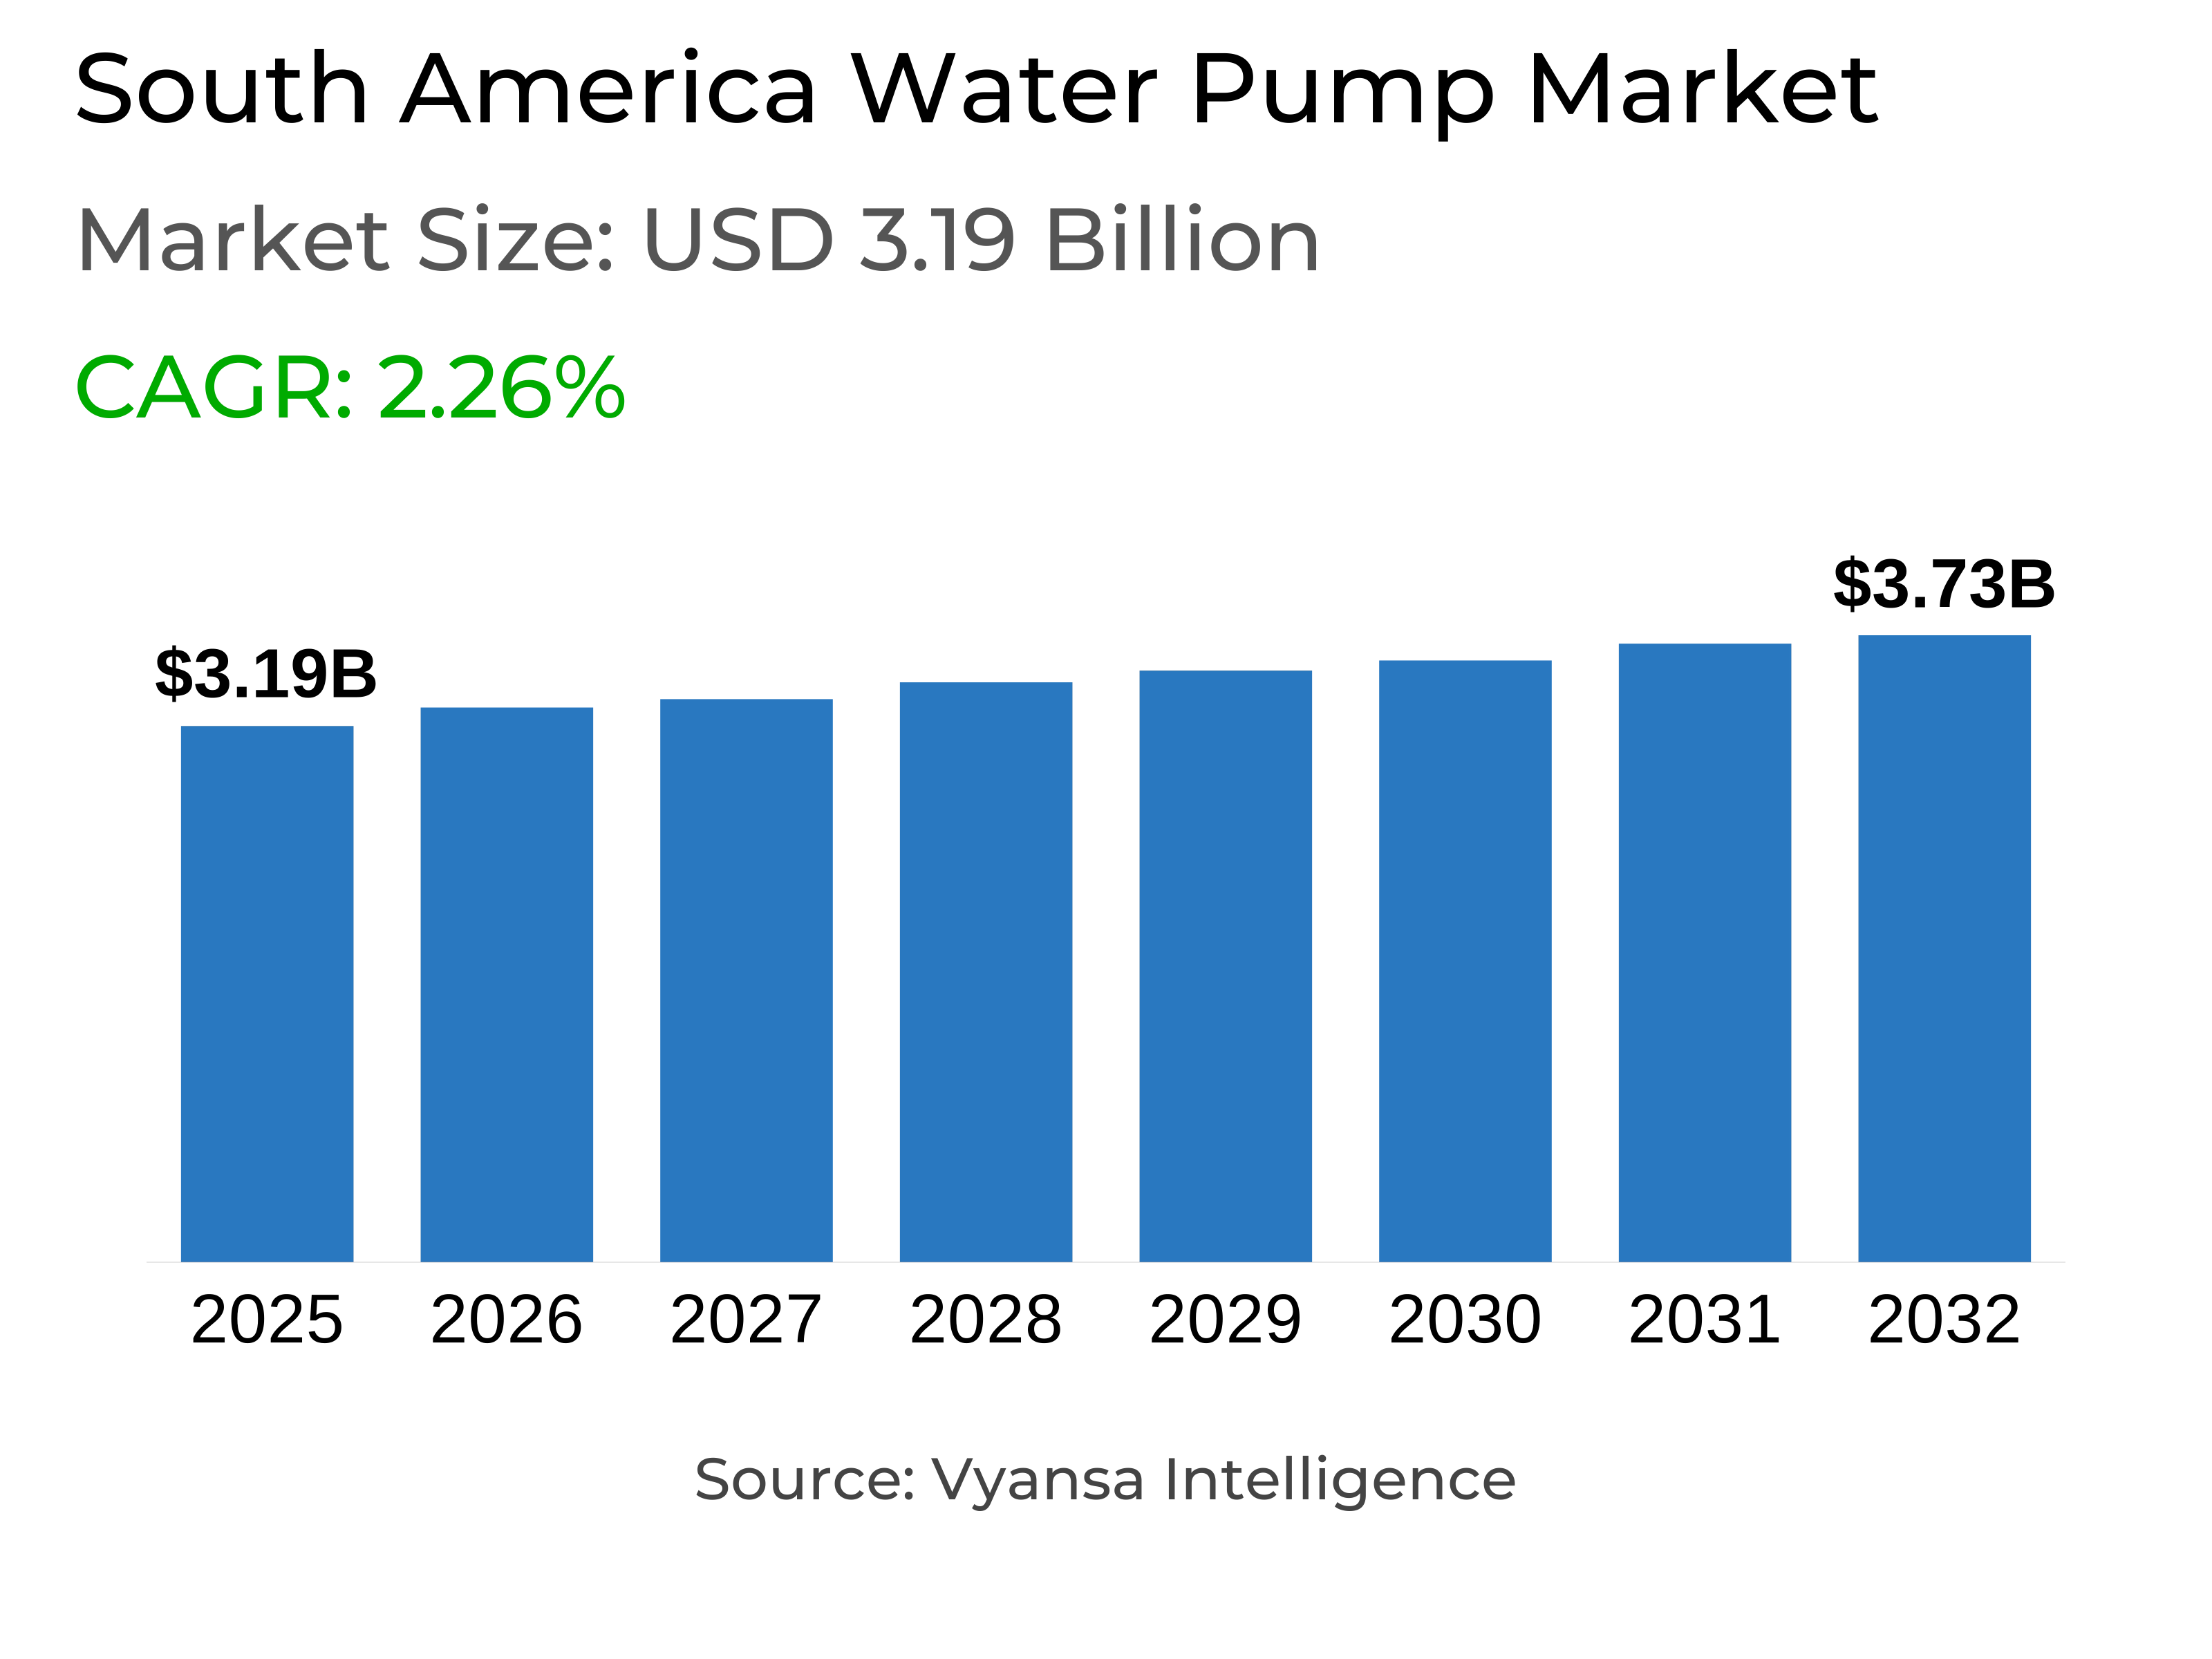
- South America Water Pump Market is estimated at $ 3.19 Billion.
- The market size is expected to grow to $ 3.73 Billion by 2032.
- Market to register a CAGR of around 2.26% during 2026-32.
- Pump Type Shares
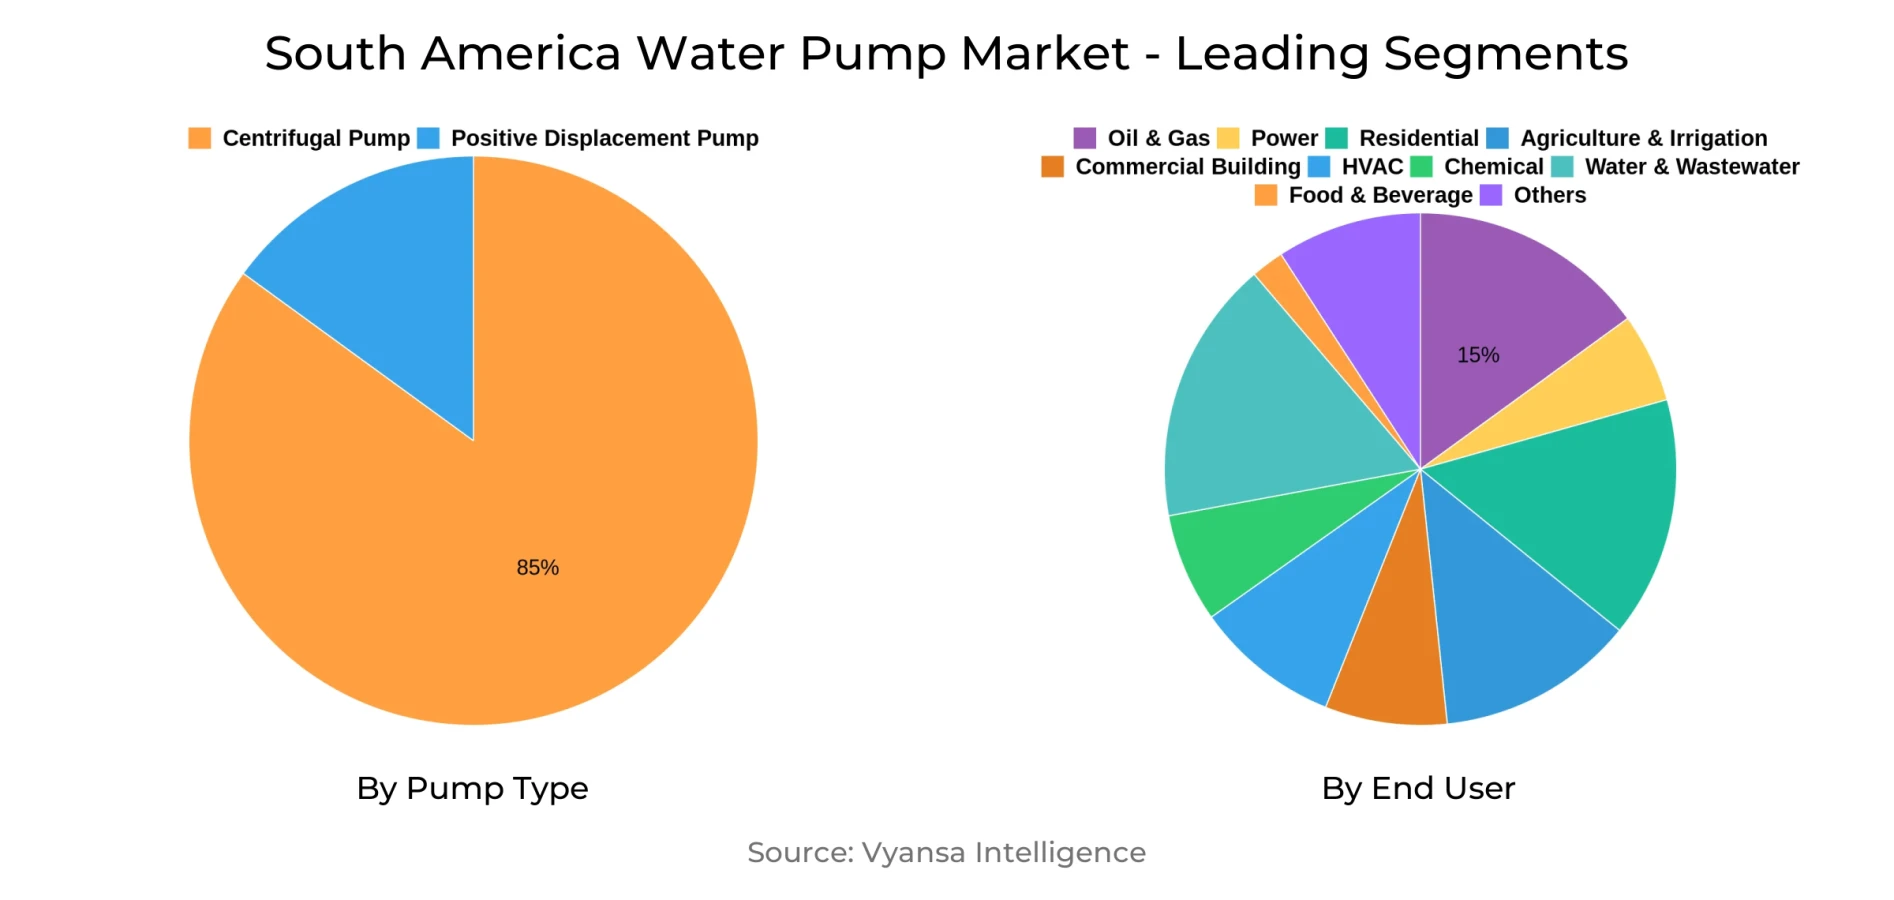
- Centrifugal Pump grabbed market share of 85%.
- Competition
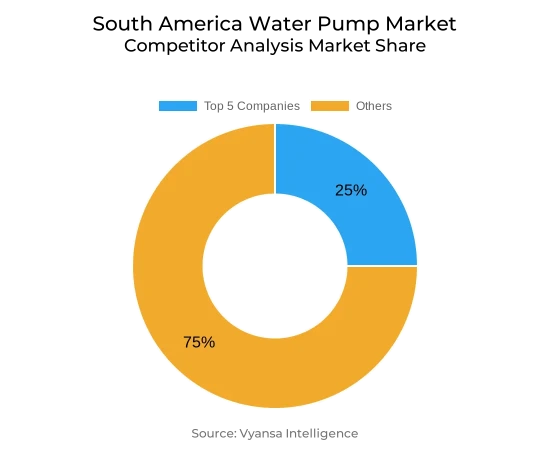
- More than 10 companies are actively engaged in producing Water Pump in South America.
- Top 5 companies acquired 25% of the market share.
- ITT, IDEX, Dover, Flowserve, Sulzer AG etc., are few of the top companies.
- End User
- Oil & Gas grabbed 15% of the market.
- Country
- Brazil leads with a 35% share of the South America Market.
South America Water Pump Market Outlook
South America Water Pump Market, which was worth USD 3.19 billion in 2025, is projected to grow to USD 3.73 billion by 2032 with the drive from increasing irrigation schemes and urbanization in Brazil, Argentina, and Chile. Infrastructure development at a high pace, especially in canal coating and drip irrigation systems, is driving high-capacity, corrosion-resistant pump demand. Governments are also spending money on expanding potable water networks, with more than 1,500 km of pipes laid since 2020, indicating regional efforts at long-term water sustainability and distribution efficiency.
Nonetheless, the market is confronted with ongoing challenges from the aging water infrastructure. In Brazil alone, over 40% of urban water networks are over 30 years old, which results in high water losses and common maintenance problems. The shortage of technical skills in the rural areas also slows down repairs, hindering the implementation of new-age pumping systems. The above limitations result in operation inefficiencies that limit the full potential of new technology throughout the region.
Technological innovation is redefining the market dynamics, with increased uptake of smart and energy-efficient pumping solutions. Variable-frequency drive (VFD) and Internet of Things (IoT)-enabled systems are increasing energy efficiency and predictive maintenance, allowing utilities to become more efficient. Meanwhile, rural development initiatives like Brazil's "Água para Todos" are driving up demand for off-grid solar-powered pumps and low-maintenance pumping solutions.
Centrifugal pumps are the leaders with 85% market share because they are cost-effective and have broad applicability in agriculture, municipal, and industrial activities. Within end users, the oil & gas industry is the leader with 15% market share, demanding high-performance pumps for refineries and offshore platforms. The market is moderately consolidated with more than 10 active manufacturers, wherein the top five companies have a combined share of about 25% of overall market share.
South America Water Pump Market Growth Driver
Accelerating Infrastructure Expansion Across Agriculture and Urban Development
Sustainable growth in agricultural irrigation schemes and city development projects is driving the South America Water Pump Market. Brazilian and Argentinian governments are significantly investing in upgrading water supply networks to help combat seasonal droughts, and irrigation demand has increased by 22% in the last three years, states the Brazilian National Water Agency (ANA) 2024 report. This increase in irrigation equipment, especially drip systems and canal lining, fuels the need for durable, high-capacity pumps that can operate under demanding field conditions.
At the same time, municipal water treatment growth complements pump installations in mid-sized urban areas. Overall national programs aimed at the availability of drinking water have increased pipeline networks by more than 1,500 km since 2020. The increasing focus on corrosion and energy-saving pump models highlights regional priorities for long-term water sustainability as well as operating expense optimization.
South America Water Pump Market Challenge
Aging Infrastructure Creating Operational Bottlenecks
The ubiquity of old pipeline networks is the chief restriction on the South America Water Pump Market. Over 40% of Brazil's municipal water networks have reached more than 30 years of operational life, leading to widespread leakage and pipe breakages that result in water losses reaching as much as 35%, according to ANA's 2023 survey. The inefficiencies not only exacerbate maintenance costs but also decrease the overall efficiency of contemporary pumping systems.
Also, limited technical know-how in remote and rural locations slows down critical maintenance work. Numerous small water utilities do not have qualified technicians, with resulting average turnaround times of close to two weeks. This lack of qualified personnel inhibits the introduction of newer pumping technologies, necessitating continued reliance on old, less efficient systems, further exacerbating performance and reliability problems.
Unlock Market Intelligence
Explore the market potential with our data-driven report
South America Water Pump Market Trend
Adoption of Smart Pumping and Energy-Efficient Technologies
Increasing migration to smart and connected pumping technologies is transforming the South America Water Pump Market. Internet-of-Things (IoT) systems with remote monitoring and predictive maintenance features are enhancing operation visibility and decreasing unplanned downtime. Municipal pilot schemes with sensor-connected pumps in Argentina have achieved a maximum of an 18% decrease in energy usage, as per the Ministry of Public Works (2022).
Meanwhile, utilities in Chile are increasingly using variable-frequency drives (VFDs) to provide exact flow control and optimize energy. Pumps with VFDs now represent some 30% of new installation activity. These trends underscore the region's emphasis on sustainability and cost-effectiveness, complementing larger environmental objectives to reduce carbon emissions and better utilize power.
South America Water Pump Market Opportunity
Expanding Rural Water and Irrigation Projects Unlocking Growth
Rural water development programs are presenting an opportunity for market players on a large scale. Brazil's "Água para Todos" initiative commits over BRL 2 billion to community well and small-scale irrigation projects up to 2026, driving demand for off-grid and solar-compatible submersible and surface pumps. The programs emphasize affordability and reliability, working towards long-term access to water in remote areas.
In addition, the relationships with development organizations and NGOs are increasing investment in water programs throughout the Andean region. Most of these schemes focus on rugged, low-maintenance pump systems that can operate with variable water quality. This provides opportunities for suppliers providing hardy materials, modular construction, and streamlined servicing options well suited to harsh rural conditions.
South America Water Pump Market Country Analysis
Brazil holds a 35% market share in the South America Water Pump Market, backed by its massive base of agriculture and continued municipal water infrastructure developments. Large-scale irrigation programs in areas such as Mato Grosso and São Paulo continue to drive repeated demand for centrifugal and submersible pumps. Brazil's robust public investment pipeline sustains both urban and rural water management improvements.
Chile and Argentina are close behind, each with strong demand from niche sectors. The mining sector in Argentina depends heavily on slurry and dewatering pumps, while Chile's desalination plants in the Atacama desert drive the demand for corrosion-proof and high-efficiency pumps. This sectoral and regional diversity enhances overall market stability and promotes sustainable long-term growth throughout South America.
Unlock Market Intelligence
Explore the market potential with our data-driven report
South America Water Pump Market Segmentation Analysis
By Pump Type
- Centrifugal Pump
- Positive Displacement Pump
The largest market share in the Pump Type category belongs to the Centrifugal Pump, holding 85% of the South America Water Pump Market. Their popularity can be traced to high versatility in agricultural irrigation, municipal supply, and industrial processes. Simple installation, low maintenance, and low operating costs, whereby the pumps are the first choice of both public utilities and private consumers.
Conversely, positive displacement pumps serve specialized markets requiring high-pressure fluid handling, including desalination and chemical dosing. Centrifugal pumps, nevertheless, sustain their supremacy owing to standard manufacturing processes, ease of finding spare parts, and high efficiency under varied environmental conditions—factors that support their market leadership in the region.
By End User
- Oil & Gas
- Power
- Residential
- Agriculture & Irrigation
- Commercial Building
- HVAC
- Chemical
- Water & Wastewater
- Food & Beverage
- Others
The Oil & Gas segment has the largest market share in the End User category, with 15% of South America's total pump installations. Offshore platforms and refineries need heavy-duty pumping solutions for hydrocarbon transfer, cooling, and water circulation, where reliability and high-pressure performance are key to their operations. The industry's ongoing exploration and exploitation activities also maintain the demand for sophisticated pump technologies.
The fire protection segment is the highest-growing end-user segment, growing at a CAGR of 7.08%. Strengthened enforcement of safety standards in Brazil and Peru has enhanced sprinkler and hydrant system deployment, pushing demand for high-pressure, rapid-start pumps specialized in emergency situations. This rising segment reflects pump diversification across industrial and safety infrastructure use.
Top Companies in South America Water Pump Market
The top companies operating in the market include ITT, IDEX, Dover, Flowserve, Sulzer AG, KSB, Xylem, Grundfos, Ebara, SPX Flow, Others (Kirloskar, Wilo, etc.), etc., are the top players operating in the South America Water Pump Market.
Frequently Asked Questions
Related Report
1. Market Segmentation
1.1. Research Scope
1.2. Research Methodology
1.3. Definitions and Assumptions
2. Executive Summary
3. South America Water Pump Market Policies, Regulations, and Standards
4. South America Water Pump Market Dynamics
4.1. Growth Factors
4.2. Challenges
4.3. Trends
4.4. Opportunities
5. South America Water Pump Market Statistics, 2022-2032F
5.1. Market Size & Growth Outlook
5.1.1.By Revenues in US$ Million
5.1.2.By Units Sold in Million Units
5.2. Market Segmentation & Growth Outlook
5.2.1.By Pump Type
5.2.1.1. Centrifugal Pump- Market Insights and Forecast 2022-2032, USD Million
5.2.1.1.1. Overhung Pumps- Market Insights and Forecast 2022-2032, USD Million
5.2.1.1.1.1. Vertical Line- Market Insights and Forecast 2022-2032, USD Million
5.2.1.1.1.2. Horizontal End Suction- Market Insights and Forecast 2022-2032, USD Million
5.2.1.1.2. Split Case Pumps- Market Insights and Forecast 2022-2032, USD Million
5.2.1.1.2.1. Single/Two Stage- Market Insights and Forecast 2022-2032, USD Million
5.2.1.1.2.2. Multi Stage- Market Insights and Forecast 2022-2032, USD Million
5.2.1.1.3. Vertical Pumps- Market Insights and Forecast 2022-2032, USD Million
5.2.1.1.3.1. Turbine- Market Insights and Forecast 2022-2032, USD Million
5.2.1.1.3.2. Axial- Market Insights and Forecast 2022-2032, USD Million
5.2.1.1.3.3. Mixed Flow- Market Insights and Forecast 2022-2032, USD Million
5.2.1.1.4. Submersible Pumps- Market Insights and Forecast 2022-2032, USD Million
5.2.1.1.4.1. Solid Handling- Market Insights and Forecast 2022-2032, USD Million
5.2.1.1.4.2. Non-Solid Handling- Market Insights and Forecast 2022-2032, USD Million
5.2.1.2. Positive Displacement Pump- Market Insights and Forecast 2022-2032, USD Million
5.2.1.2.1. Diaphragm Pumps- Market Insights and Forecast 2022-2032, USD Million
5.2.1.2.2. Piston Pumps- Market Insights and Forecast 2022-2032, USD Million
5.2.1.2.3. Gear Pumps- Market Insights and Forecast 2022-2032, USD Million
5.2.1.2.4. Lobe Pumps- Market Insights and Forecast 2022-2032, USD Million
5.2.1.2.5. Progressive Cavity Pumps- Market Insights and Forecast 2022-2032, USD Million
5.2.1.2.6. Screw Pumps- Market Insights and Forecast 2022-2032, USD Million
5.2.1.2.7. Vane Pumps- Market Insights and Forecast 2022-2032, USD Million
5.2.1.2.8. Peristaltic Pumps- Market Insights and Forecast 2022-2032, USD Million
5.2.1.2.9. Others- Market Insights and Forecast 2022-2032, USD Million
5.2.2.By End User
5.2.2.1. Oil & Gas- Market Insights and Forecast 2022-2032, USD Million
5.2.2.2. Power- Market Insights and Forecast 2022-2032, USD Million
5.2.2.3. Residential- Market Insights and Forecast 2022-2032, USD Million
5.2.2.4. Agriculture & Irrigation- Market Insights and Forecast 2022-2032, USD Million
5.2.2.5. Commercial Building- Market Insights and Forecast 2022-2032, USD Million
5.2.2.6. HVAC- Market Insights and Forecast 2022-2032, USD Million
5.2.2.7. Chemical- Market Insights and Forecast 2022-2032, USD Million
5.2.2.8. Water & Wastewater- Market Insights and Forecast 2022-2032, USD Million
5.2.2.9. Food & Beverage- Market Insights and Forecast 2022-2032, USD Million
5.2.2.10. Others- Market Insights and Forecast 2022-2032, USD Million
5.2.3.By Country
5.2.3.1. Brazil
5.2.3.2. Argentina
5.2.3.3. Chile
5.2.3.4. Peru
5.2.3.5. Rest of South America
5.2.4.By Competitors
5.2.4.1. Competition Characteristics
5.2.4.2. Market Share & Analysis
6. Brazil Water Pump Market Statistics, 2022-2032F
6.1. Market Size & Growth Outlook
6.1.1.By Revenues in US$ Million
6.1.2.By Units Sold in Million Units
6.2. Market Segmentation & Growth Outlook
6.2.1.By Pump Type- Market Insights and Forecast 2022-2032, USD Million
6.2.2.By End User- Market Insights and Forecast 2022-2032, USD Million
7. Argentina Water Pump Market Statistics, 2022-2032F
7.1. Market Size & Growth Outlook
7.1.1.By Revenues in US$ Million
7.1.2.By Units Sold in Million Units
7.2. Market Segmentation & Growth Outlook
7.2.1.By Pump Type- Market Insights and Forecast 2022-2032, USD Million
7.2.2.By End User- Market Insights and Forecast 2022-2032, USD Million
8. Chile Water Pump Market Statistics, 2022-2032F
8.1. Market Size & Growth Outlook
8.1.1.By Revenues in US$ Million
8.1.2.By Units Sold in Million Units
8.2. Market Segmentation & Growth Outlook
8.2.1.By Pump Type- Market Insights and Forecast 2022-2032, USD Million
8.2.2.By End User- Market Insights and Forecast 2022-2032, USD Million
9. Peru Water Pump Market Statistics, 2022-2032F
9.1. Market Size & Growth Outlook
9.1.1.By Revenues in US$ Million
9.1.2.By Units Sold in Million Units
9.2. Market Segmentation & Growth Outlook
9.2.1.By Pump Type- Market Insights and Forecast 2022-2032, USD Million
9.2.2.By End User- Market Insights and Forecast 2022-2032, USD Million
10. Competitive Outlook
10.1. Company Profiles
10.1.1. Flowserve
10.1.1.1. Business Description
10.1.1.2. Product Portfolio
10.1.1.3. Collaborations & Alliances
10.1.1.4. Recent Developments
10.1.1.5. Financial Details
10.1.1.6. Others
10.1.2. Sulzer AG
10.1.2.1. Business Description
10.1.2.2. Product Portfolio
10.1.2.3. Collaborations & Alliances
10.1.2.4. Recent Developments
10.1.2.5. Financial Details
10.1.2.6. Others
10.1.3. KSB
10.1.3.1. Business Description
10.1.3.2. Product Portfolio
10.1.3.3. Collaborations & Alliances
10.1.3.4. Recent Developments
10.1.3.5. Financial Details
10.1.3.6. Others
10.1.4. Xylem
10.1.4.1. Business Description
10.1.4.2. Product Portfolio
10.1.4.3. Collaborations & Alliances
10.1.4.4. Recent Developments
10.1.4.5. Financial Details
10.1.4.6. Others
10.1.5. Grundfos
10.1.5.1. Business Description
10.1.5.2. Product Portfolio
10.1.5.3. Collaborations & Alliances
10.1.5.4. Recent Developments
10.1.5.5. Financial Details
10.1.5.6. Others
10.1.6. ITT
10.1.6.1. Business Description
10.1.6.2. Product Portfolio
10.1.6.3. Collaborations & Alliances
10.1.6.4. Recent Developments
10.1.6.5. Financial Details
10.1.6.6. Others
10.1.7. IDEX
10.1.7.1. Business Description
10.1.7.2. Product Portfolio
10.1.7.3. Collaborations & Alliances
10.1.7.4. Recent Developments
10.1.7.5. Financial Details
10.1.7.6. Others
10.1.8. Dover
10.1.8.1. Business Description
10.1.8.2. Product Portfolio
10.1.8.3. Collaborations & Alliances
10.1.8.4. Recent Developments
10.1.8.5. Financial Details
10.1.8.6. Others
10.1.9. Ebara
10.1.9.1. Business Description
10.1.9.2. Product Portfolio
10.1.9.3. Collaborations & Alliances
10.1.9.4. Recent Developments
10.1.9.5. Financial Details
10.1.9.6. Others
10.1.10. SPX Flow
10.1.10.1.Business Description
10.1.10.2.Product Portfolio
10.1.10.3.Collaborations & Alliances
10.1.10.4.Recent Developments
10.1.10.5.Financial Details
10.1.10.6.Others
10.1.11. Others (Kirloskar, Wilo, etc.)
10.1.11.1.Business Description
10.1.11.2.Product Portfolio
10.1.11.3.Collaborations & Alliances
10.1.11.4.Recent Developments
10.1.11.5.Financial Details
10.1.11.6.Others
11. Disclaimer
| Segment | Sub-Segment |
|---|---|
| By Pump Type |
|
| By End User |
|
| By Country |
|
Research Methodology
This study followed a structured approach comprising four key phases to assess the size and scope of the electro-oxidation market. The process began with thorough secondary research to collect data on the target market, related markets, and broader industry context. These findings, along with preliminary assumptions and estimates, were then validated through extensive primary research involving industry experts from across the value chain. To calculate the overall market size, both top-down and bottom-up methodologies were employed. Finally, market segmentation and data triangulation techniques were applied to refine and validate segment-level estimations.
Secondary Research
The secondary research phase involved gathering data from a wide range of credible and published sources. This step helped in identifying industry trends, defining market segmentation, and understanding the market landscape and value chain.
Sources consulted during this phase included:
- Company annual reports, investor presentations, and press releases
- Industry white papers and certified publications
- Trade directories and market-recognized databases
- Articles from authoritative authors and reputable journals
- Gold and silver standard websites
Secondary research was critical in mapping out the industry's value chain and monetary flow, identifying key market segments, understanding regional variations, and tracking significant industry developments.
Other key sources:
- Financial disclosures
- Industry associations and trade bodies
- News outlets and business magazines
- Academic journals and research studies
- Paid industry databases
Primary Research
To validate secondary data and gain deeper market insights, primary research was conducted with key stakeholders across both the supply and demand sides of the market.
On the demand side, participants included decision-makers and influencers from end-user industries—such as CIOs, CTOs, and CSOs—who provided first-hand perspectives on market needs, product usage, and future expectations.
On the supply side, interviews were conducted with manufacturers, industry associations, and institutional participants to gather insights into current offerings, product pipelines, and market challenges.
Primary interviews provided critical inputs such as:
- Market size and revenue data
- Product and service breakdowns
- Market forecasts
- Regional and application-specific trends
Stakeholders consulted included:
- Leading OEM and solution providers
- Channel and distribution partners
- End users across various applications
- Independent consultants and industry specialists
Market Size Estimation and Data Triangulation
- Identifying Key Market Participants (Secondary Research)
- Goal: To identify the major players or companies in the target market. This typically involves using publicly available data sources such as industry reports, market research publications, and financial statements of companies.
- Tools: Reports from firms like Gartner, Forrester, Euromonitor, Statista, IBISWorld, and others. Public financial statements, news articles, and press releases from top market players.
- Extracting Earnings of Key Market Participants
- Goal: To estimate the earnings generated from the product or service being analyzed. This step helps in understanding the revenue potential of each market player in a specific geography.
- Methods: Earnings data can be gathered from:
- Publicly available financial reports (for listed companies).
- Interviews and primary data sources from professionals, such as Directors, VPs, SVPs, etc. This is especially useful for understanding more nuanced, internal data that isn't publicly disclosed.
- Annual reports and investor presentations of key players.
- Data Collation and Development of a Relevant Data Model
- Goal: To collate inputs from both primary and secondary sources into a structured, data-driven model for market estimation. This model will incorporate key market KPIs and any independent variables relevant to the market.
- Key KPIs: These could include:
- Market size, growth rate, and demand drivers.
- Industry-specific metrics like market share, average revenue per customer (ARPC), or average deal size.
- External variables, such as economic growth rates, inflation rates, or commodity prices, that could affect the market.
- Data Modeling: Based on this data, the market forecasts are developed for the next 5 years. A combination of trend analysis, scenario modeling, and statistical regression might be used to generate projections.
- Scenario Analysis
- Goal: To test different assumptions and validate how sensitive the market is to changes in key variables (e.g., market demand, regulatory changes, technological disruptions).
- Types of Scenarios:
- Base Case: Based on current assumptions and historical data.
- Best-Case Scenario: Assuming favorable market conditions, regulatory environments, and technological advancements.
- Worst-Case Scenario: Accounting for adverse factors, such as economic downturns, stricter regulations, or unexpected disruptions.


