Asia Pacific Water Pump Market Report: Trends, Growth and Forecast (2026-2032)
By Pump Type (Centrifugal Pump (Overhung Pumps (Vertical Line, Horizontal End Suction), Split Case Pumps (Single/Two Stage, Multi Stage), Vertical Pumps (Turbine, Axial, Mixed Flow), Submersible Pumps (Solid Handling, Non-Solid Handling)), Positive Displacement Pump (Diaphragm Pumps, Piston Pumps, Gear Pumps, Lobe Pumps, Progressive Cavity Pumps, Screw Pumps, Vane Pumps, Peristaltic Pumps, Others)), By End User (Oil & Gas, Power, Residential, Agriculture & Irrigation, Commercial Building, HVAC, Chemical, Water & Wastewater, Food & Beverage, Others), By Country (China, India, Japan, South Korea, Southeast Asia, Rest of Asia Pacific) ... Read more
|
Major Players
|
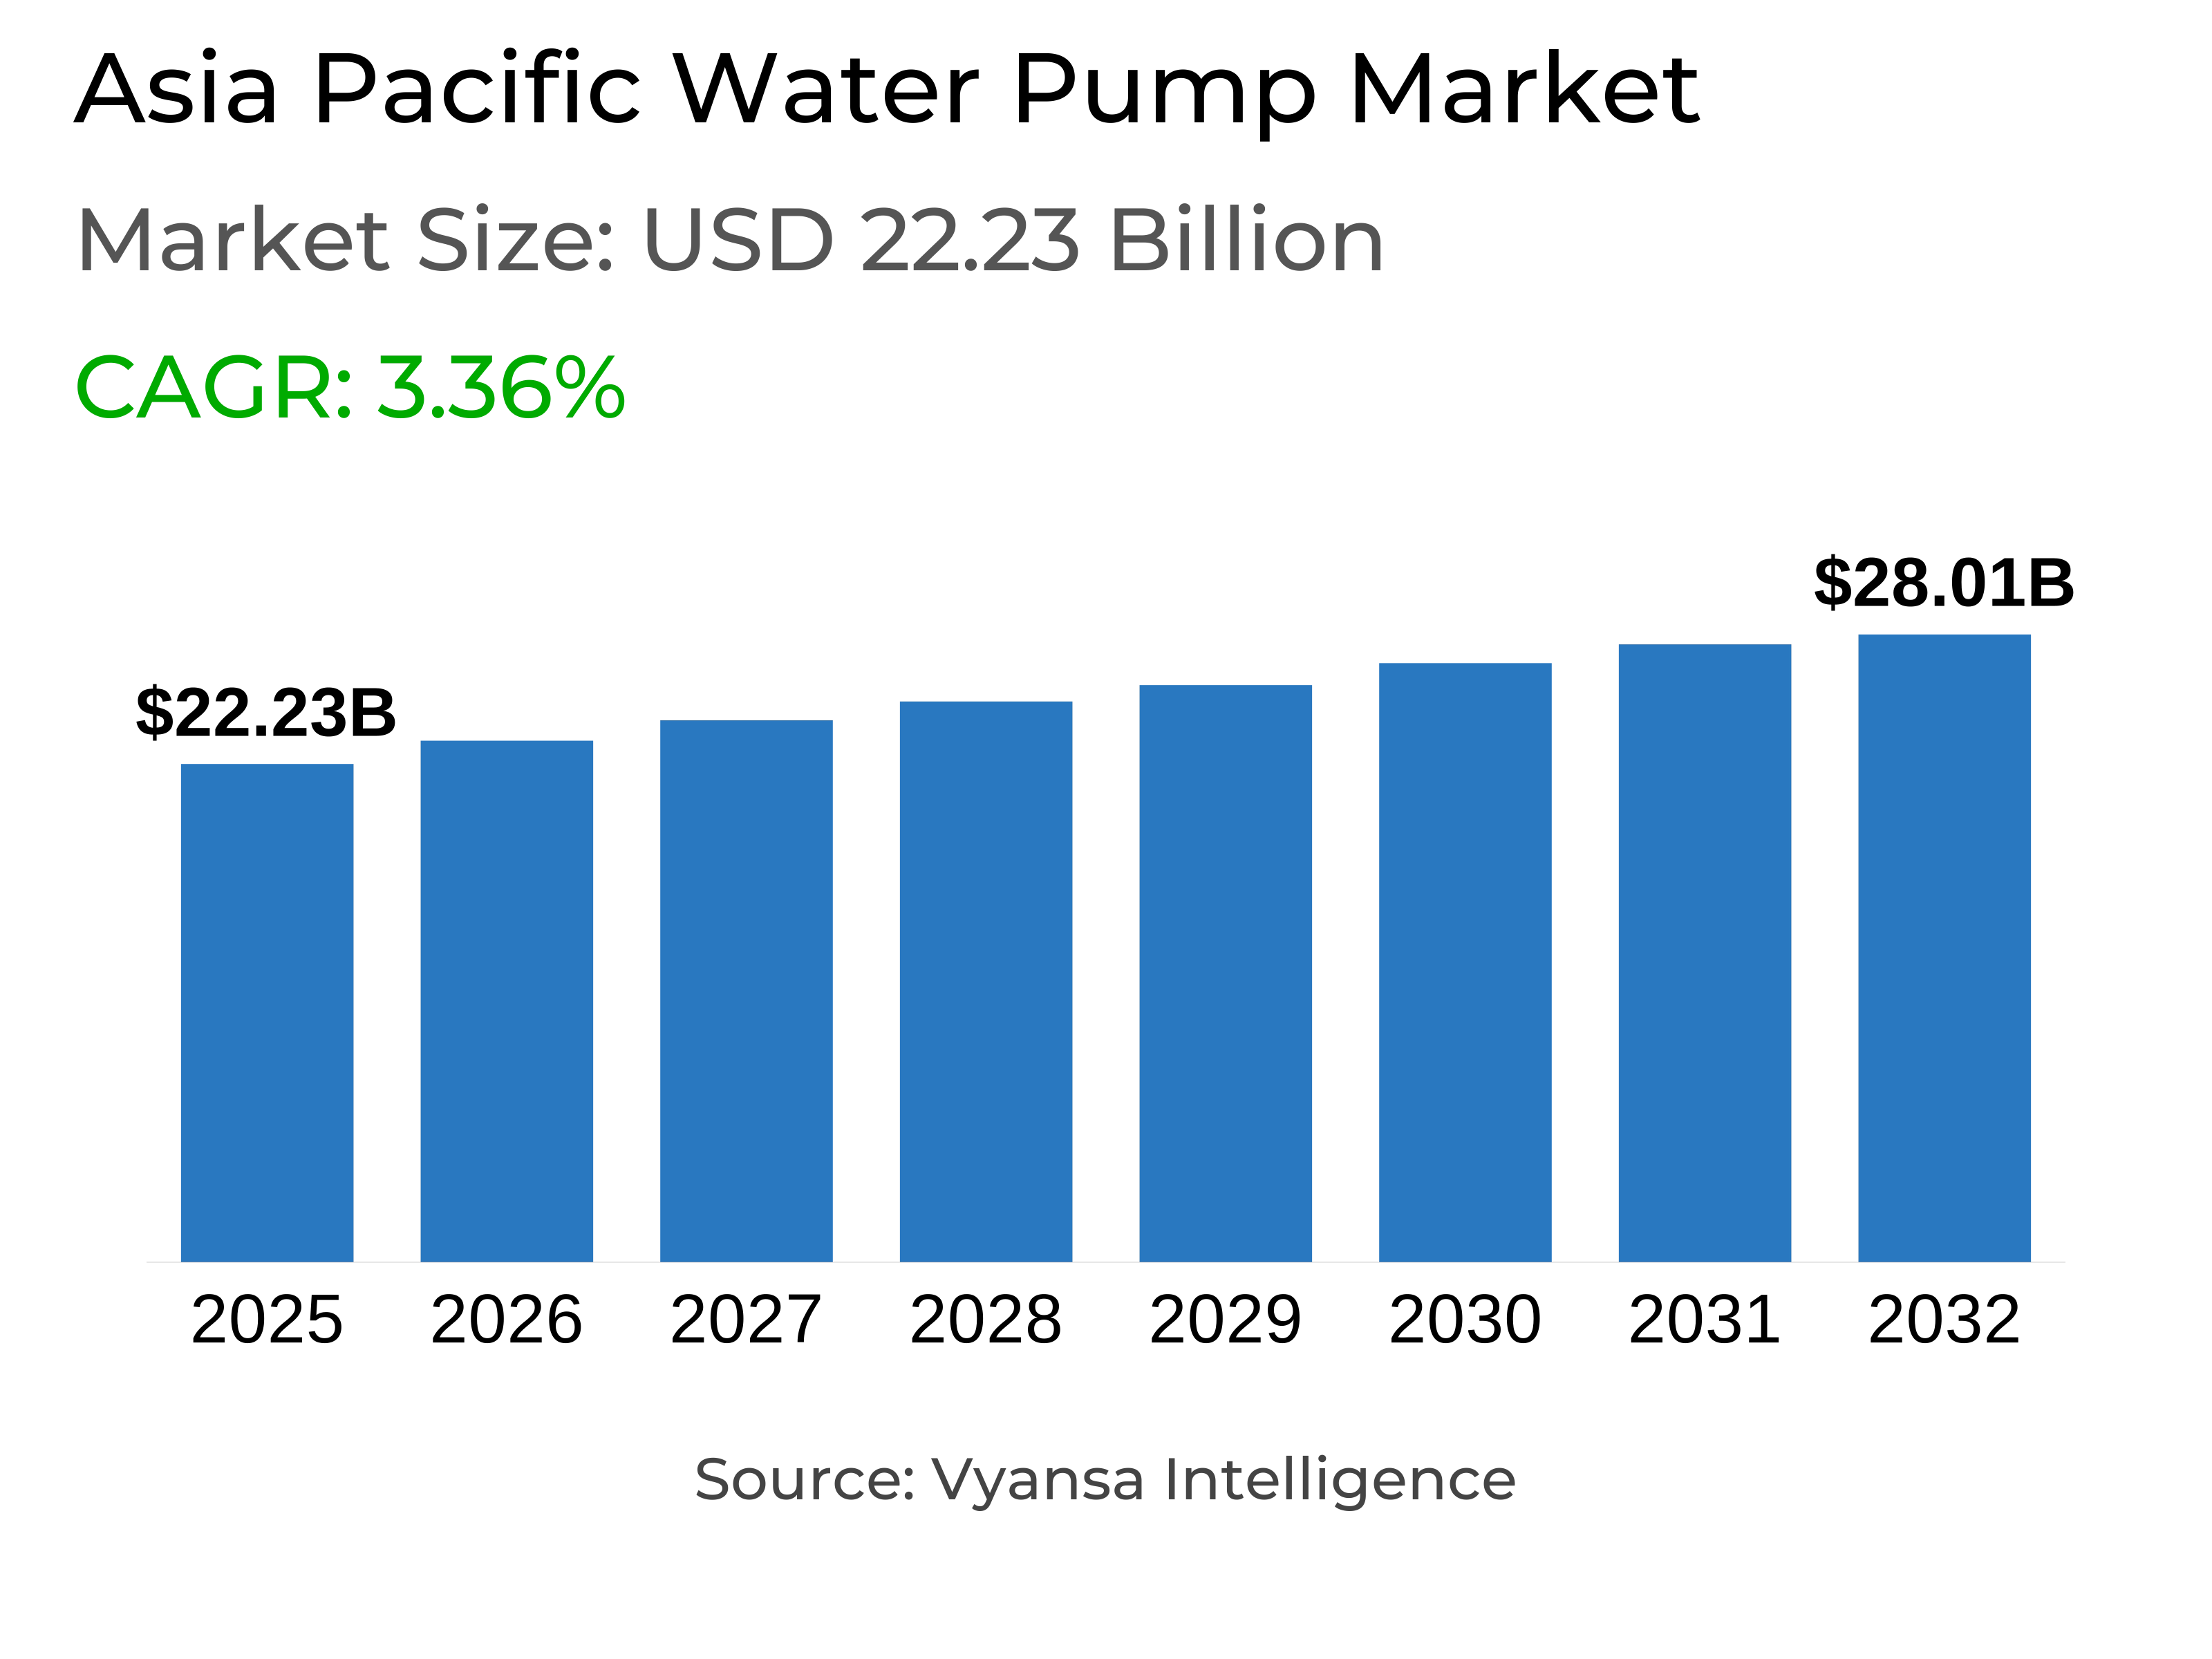
Asia Pacific Water Pump Market Statistics and Insights, 2026
- Market Size Statistics
- Asia Pacific Water Pump Market is estimated at $ 22.23 Billion.
- The market size is expected to grow to $ 28.01 Billion by 2032.
- Market to register a CAGR of around 3.36% during 2026-32.
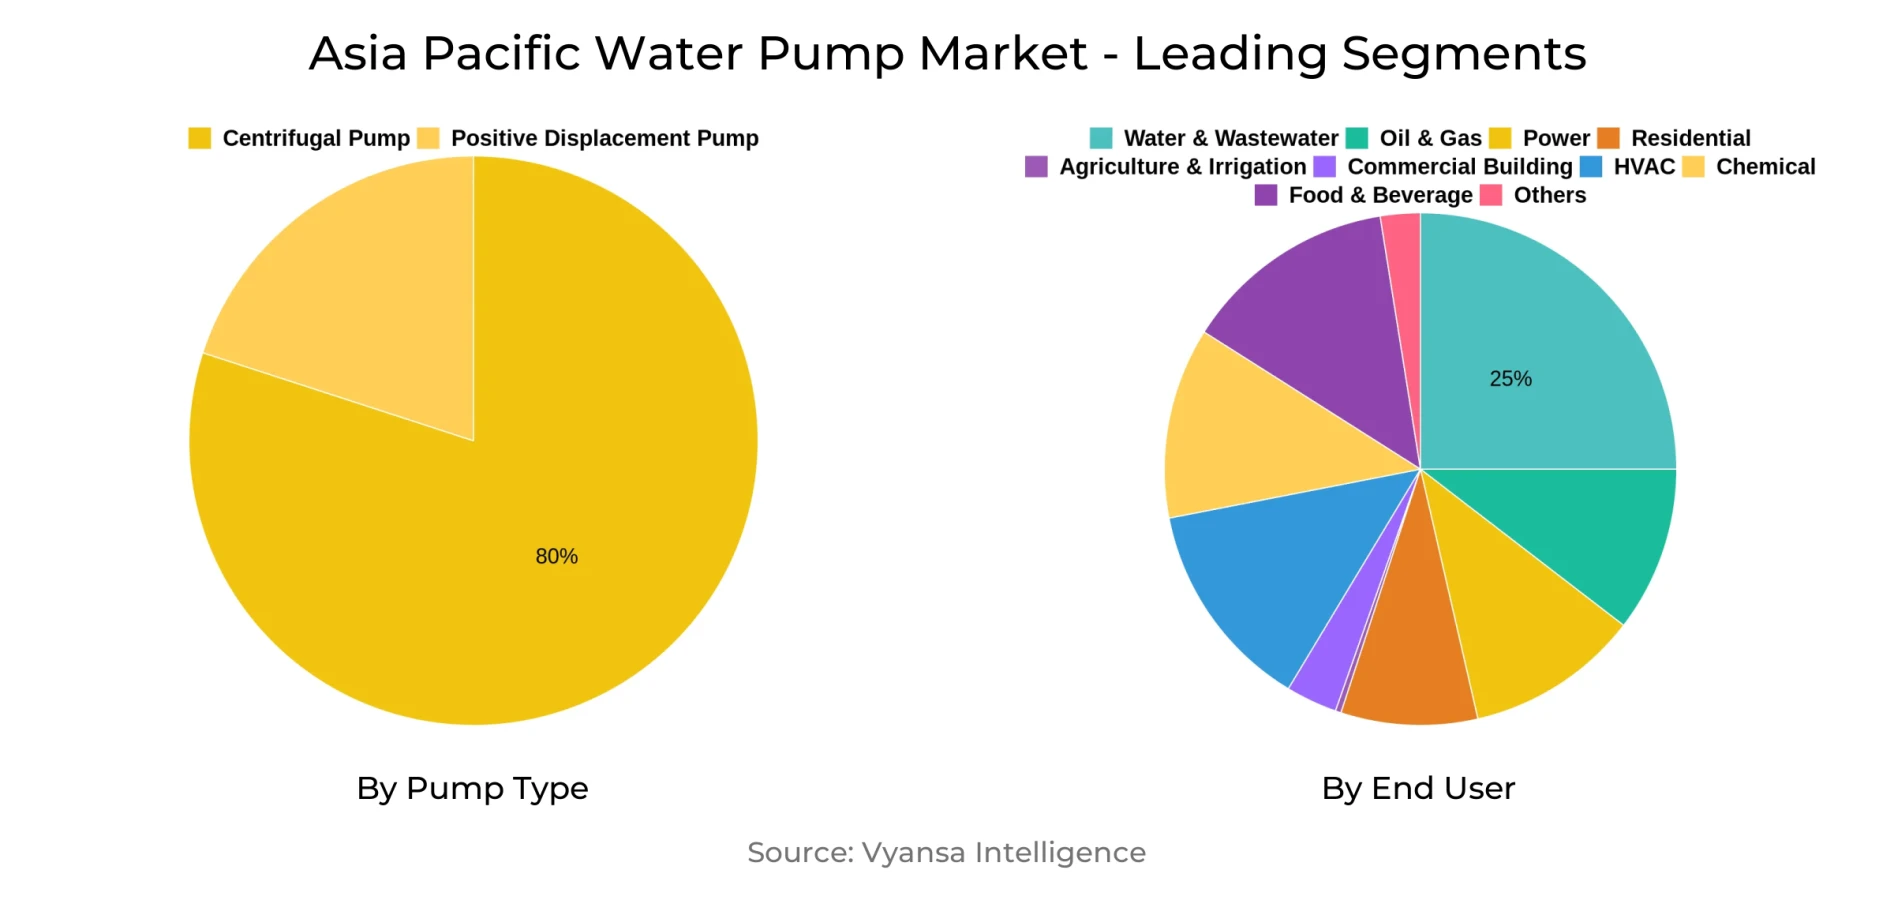
- Pump Type Shares
- Centrifugal Pump grabbed market share of 80%.
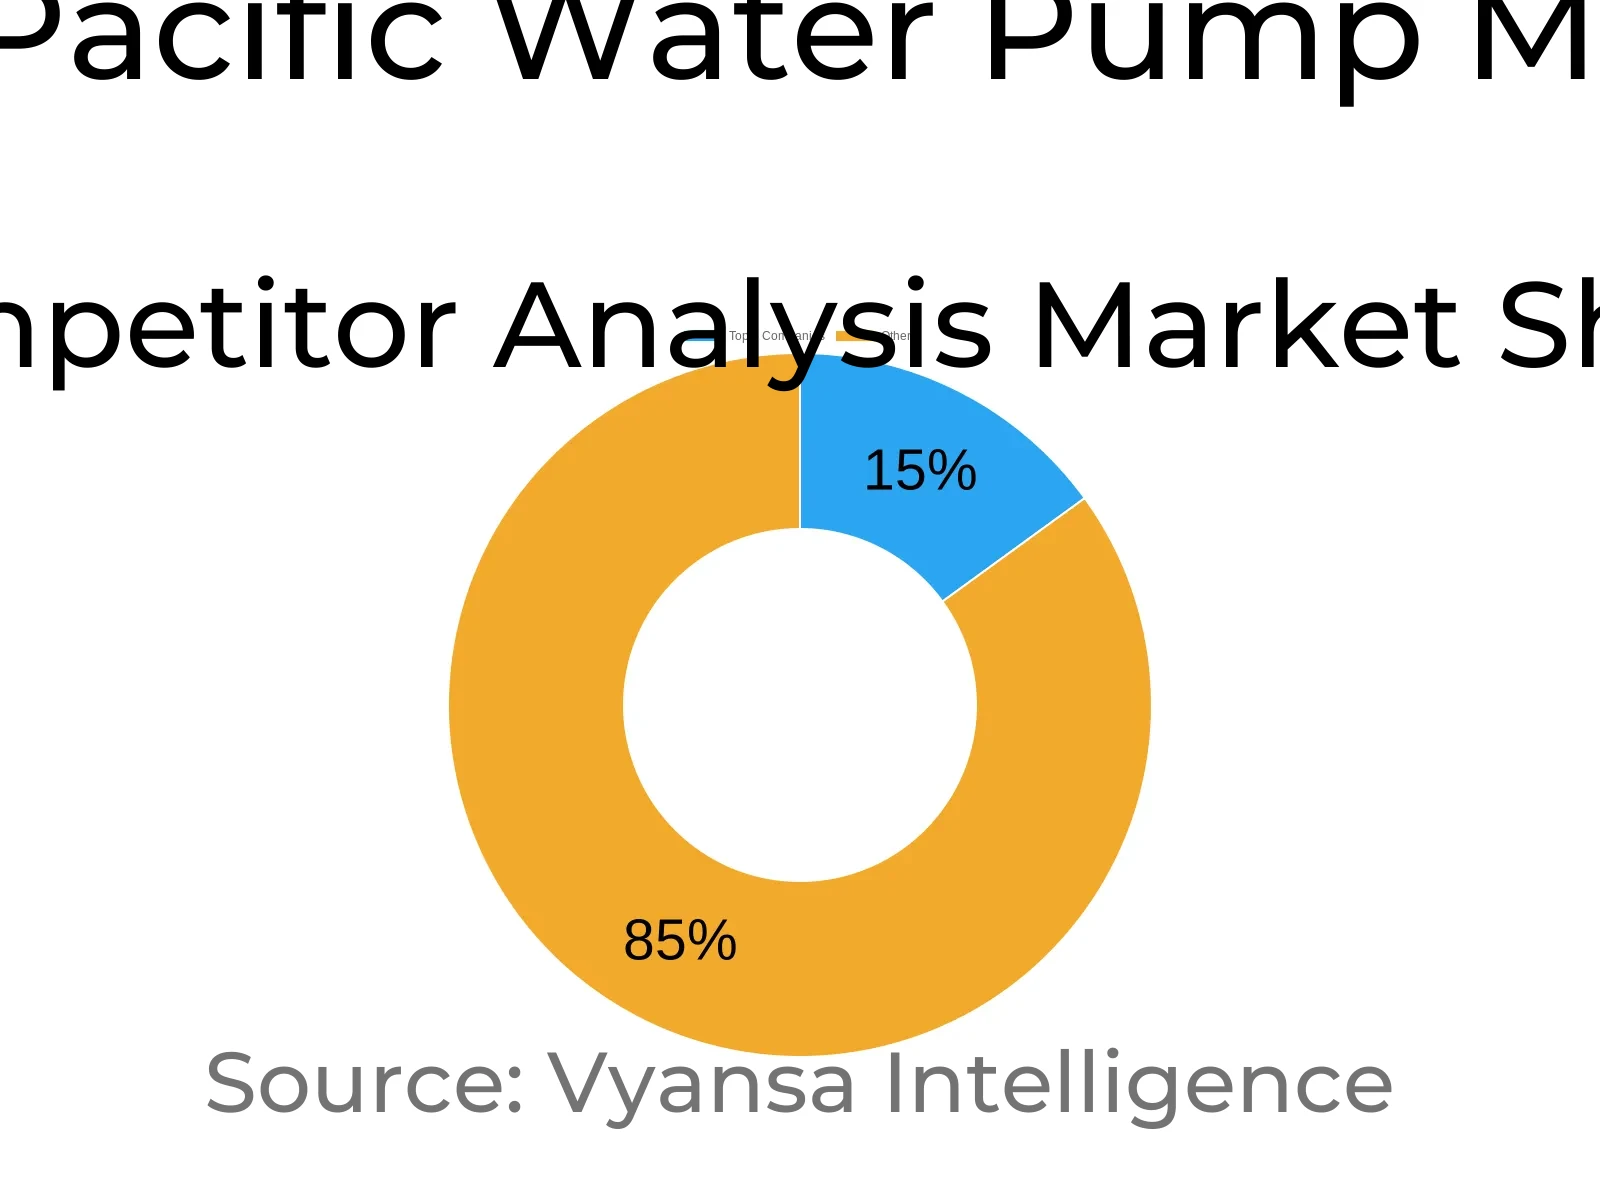
- Competition
- More than 10 companies are actively engaged in producing Water Pump in Asia Pacific.
- Top 5 companies acquired 15% of the market share.
- ITT, IDEX, Dover, Flowserve, Sulzer AG etc., are few of the top companies.
- End User
- Water & Wastewater grabbed 25% of the market.
- Country
- China leads with a 40% share of the Asia Pacific Market.
Asia Pacific Water Pump Market Outlook
The Asia-Pacific Water Pump Market, worth USD 22.23 billion in 2025, will grow to USD 28.01 billion by the year 2032, spurred by increased water scarcity and high-speed urbanization throughout the Asia-Pacific region. More than 1.8 billion individuals reside in regions with water stress, generating immense demand for effective pumping systems to provide secure water supply for drinking, sanitation, and irrigation purposes. Governments are spending on new infrastructure to eliminate leakage and make supplies more reliable, with India's municipal systems alone losing almost 35% of water through obsolete networks. Such investments make pumps a critical part of sustainable water management.
Aging infrastructure is a significant hurdle, since close to 60% of the region's pumping assets are in excess of two decades old, leading to repeated breakdowns and high upkeep costs. Budget constraints and delayed project approvals hold back modernization, compelling utilities to opt for short-term fix-ups as opposed to complete replacements. This inhibits efficiency and raises the cost of running, especially in emerging economies that lack technical know-how and funding.
Digitalization is transforming the market environment as approximately 22% of new pump installations already provide IoT connectivity for real-time monitoring and predictive maintenance. The intelligent solutions help utilities save energy consumption by as much as 15%, increasing reliability and cost-effectiveness. Moreover, the integration of renewable energy—mostly solar-powered pumps—is utilized for off-grid applications and aligns with the region's sustainability targets.
Centrifugal pumps are the market leader with 80% of market share because they are versatile and easy to maintain, and among end users, the water and wastewater segment is the strongest with 25% of overall demand. Over ten manufacturers operate in the market, but the top five control 15% of the market. China is the largest market, driven by urban growth and massive investment in the upgrading of water infrastructure.
Asia Pacific Water Pump Market Growth Driver
Rising Water Scarcity Amplifies Pump Demand
Asia-Pacific is increasingly experiencing water stress with more than 1.8 billion inhabitants living in water-scarce countries, placing tremendous pressure on supply chains and precipitating the increased uptake of high-tech pumping systems. Fast-growing urbanization also necessitates demand for trusted solutions to support water delivery without interruption to meet drinking and sanitation requirements. Irrigation for agriculture continues to be a strong competitor for scarce freshwater, compeling investment into efficient pumps that reduce both energy and operating expenditures.
Government initiatives throughout the region target minimizing losses in aging pipe networks, increasing the installation of new pumping equipment. In India, for instance, 35% average leakage rates in municipal systems highlight the urgent need for strong pump technologies to maximize delivery efficiency. This intersection of scarcity, infrastructure upgrade, and conservation of resources positions water pumps as a key solution to achieving sustainable water management throughout the region.
Asia Pacific Water Pump Market Challenge
Aging Infrastructure Poses Operational Barriers
Most of Asia-Pacific water infrastructure is aging, with almost 60% of pumping assets being more than 20 years old, leading to regular breaks and exorbitant maintenance expenses. These older systems usually fail to keep pace with increasing demand, leading to spasmodic service interruptions in both high-density urban areas and rural areas.
Ongoing budget limitations and skilled labor shortages impede timely upgrades, having utilities reliant on inefficient, energy-consumptive pumps. Retrofitting efforts are then impaired by bureaucratic procedures and constrained financial expenditure, exacerbating performance inefficiencies. As a result, most operators have an arduous task maintaining short-term fixes with performing long-term modernization. The recurring infrastructure challenge impedes operating reliability, having overall renewal a key imperative to supporting sustainable and resilient water supply throughout the region.
Unlock Market Intelligence
Explore the market potential with our data-driven report
Asia Pacific Water Pump Market Trend
Digital Technologies Enhance Pump Performance
Smart pump solutions are seeing greater uptake as utilities adopt digitalization for better operational performance. Approximately 22% of recent pump installations in Asia-Pacific, as noted in 2023, include IoT connectivity to facilitate predictive maintenance and remote optimization of performance. These systems considerably minimize downtime and reduce energy spending by up to 15% by means of intelligent pump scheduling and real-time optimization.
The incorporation of cloud-based analytics enables operators to dig deeper into equipment condition, enabling the identification of anomalies prior to failure. As digital maturity progresses, the role of artificial intelligence and machine learning in automating control functions and optimizing performance parameters increases. Such technological advancements not only increase reliability and energy efficiency but also represent a move toward data-driven water management, with smart pumps positioned at the heart of the next wave of industry innovation.
Asia Pacific Water Pump Market Opportunity
Renewable Energy Integration Creates Growth Pathways
The coupling of water pumps with renewable energy systems is an exciting area for sustainable growth throughout the region. Solar-driven pump systems have emerged as critical for off-grid agriculture and rural water uses, eliminating diesel dependence altogether and lowering long-term operating costs significantly. The hybrid configurations also enhance energy security in regions with erratic grid connections, well-suited to national sustainability plans.
Pioneering pilot projects in Southeast Asia are experimenting with floating solar panels mounted across reservoirs to energize adjacent pumping stations. This innovation maximizes land use and lowers carbon footprints, demonstrating the scalability of renewable-tied water pumping infrastructure. As more policy support and favorable financing frameworks become available, renewable integration will dominate the upgrading of water infrastructure resilience while lowering Asia-Pacific's environmental footprint.
Asia Pacific Water Pump Market Country Analysis
China is the dominanting the Asia-Pacific water pump market, capturing market share of approximately 40%, fueled by huge infrastructure investments and accelerated urbanization. Urban projects on a large scale give importance to the installation of high-capacity pumping stations to ensure consistent provision of water for over 600 million city dwellers. This heavy focus on infrastructure resiliency and service continuity continues to drive demand for centrifugal as well as smart pump systems optimized to ensure energy use and performance.
Rural development initiatives also lead to market momentum with extensive use of solar and energy-efficient pumps under agriculture modernization and electrification programs. Accessible financing channels and government subsidies improve adoption levels, speeding up the replacement of old systems. Thus, China not only leads the regional market by volume but is also the standard-bearer for innovation and policy-led development in Asia-Pacific water management solutions.
Unlock Market Intelligence
Explore the market potential with our data-driven report
Asia Pacific Water Pump Market Segmentation Analysis
By Pump Type
- Centrifugal Pump
- Positive Displacement Pump
Centrifugal pumps dominate under the Pump Type category with 80% of overall installations in Asia-Pacific. Their simple design, minimal maintenance needs, and versatility in a broad head-flow range make them the most sought-after in municipal, agricultural, and industrial applications. End users welcome their capacity to handle fluctuating water quality and pressure conditions with little performance loss to maintain consistent operating efficiency.
Ongoing product innovations are enhancing the leadership of this segment. Manufacturers are optimizing impeller and case designs to enhance hydraulic performance, with gains of as much as 75% compared to previous models. Material innovation like corrosion-resistant alloys and reinforcement composites is improving durability and service life. Ongoing development ensures centrifugal pumps remain the backbone of regional water supplies, underpinning both modernization and sustainability objectives.
By End User
- Oil & Gas
- Power
- Residential
- Agriculture & Irrigation
- Commercial Building
- HVAC
- Chemical
- Water & Wastewater
- Food & Beverage
- Others
Water and wastewater is the biggest share under the End-User category, contributing 25% of Asia-Pacific's total demand for pumps. Municipal utilities are driving this growth by replacing aging pumps in order to meet stringent service-level requirements and augment sewerage infrastructure to cater to urban populations. Stable pumping systems are important for the safety of water supply and efficient wastewater treatment to maintain public health and environmental acceptability.
At the same time, the HVAC segment is shaping up to be the most rapidly expanding end-user segment, set to register a CAGR of 6.43%. Chilled-water pumping systems for commercial buildings and data centers are more and more counting on sophisticated pumping solutions that are energy-efficient, low-maintenance, and optimal in design. This development echoes the overall regional pattern of building green-certified structures and the growing significance of eco-friendly climate-control systems in dense urban complexes.
Top Companies in Asia Pacific Water Pump Market
The top companies operating in the market include ITT, IDEX, Dover, Flowserve, Sulzer AG, KSB, Xylem, Grundfos, Ebara, SPX Flow, Others (Kirloskar, Wilo, etc.), etc., are the top players operating in the Asia Pacific Water Pump Market.
Frequently Asked Questions
Related Report
1. Market Segmentation
1.1. Research Scope
1.2. Research Methodology
1.3. Definitions and Assumptions
2. Executive Summary
3. Asia Pacific Water Pump Market Policies, Regulations, and Standards
4. Asia Pacific Water Pump Market Dynamics
4.1. Growth Factors
4.2. Challenges
4.3. Trends
4.4. Opportunities
5. Asia Pacific Water Pump Market Statistics, 2022-2032F
5.1. Market Size & Growth Outlook
5.1.1.By Revenues in US$ Million
5.1.2.By Units Sold in Million Units
5.2. Market Segmentation & Growth Outlook
5.2.1.By Pump Type
5.2.1.1. Centrifugal Pump- Market Insights and Forecast 2022-2032, USD Million
5.2.1.1.1. Overhung Pumps- Market Insights and Forecast 2022-2032, USD Million
5.2.1.1.1.1. Vertical Line- Market Insights and Forecast 2022-2032, USD Million
5.2.1.1.1.2. Horizontal End Suction- Market Insights and Forecast 2022-2032, USD Million
5.2.1.1.2. Split Case Pumps- Market Insights and Forecast 2022-2032, USD Million
5.2.1.1.2.1. Single/Two Stage- Market Insights and Forecast 2022-2032, USD Million
5.2.1.1.2.2. Multi Stage- Market Insights and Forecast 2022-2032, USD Million
5.2.1.1.3. Vertical Pumps- Market Insights and Forecast 2022-2032, USD Million
5.2.1.1.3.1. Turbine- Market Insights and Forecast 2022-2032, USD Million
5.2.1.1.3.2. Axial- Market Insights and Forecast 2022-2032, USD Million
5.2.1.1.3.3. Mixed Flow- Market Insights and Forecast 2022-2032, USD Million
5.2.1.1.4. Submersible Pumps- Market Insights and Forecast 2022-2032, USD Million
5.2.1.1.4.1. Solid Handling- Market Insights and Forecast 2022-2032, USD Million
5.2.1.1.4.2. Non-Solid Handling- Market Insights and Forecast 2022-2032, USD Million
5.2.1.2. Positive Displacement Pump- Market Insights and Forecast 2022-2032, USD Million
5.2.1.2.1. Diaphragm Pumps- Market Insights and Forecast 2022-2032, USD Million
5.2.1.2.2. Piston Pumps- Market Insights and Forecast 2022-2032, USD Million
5.2.1.2.3. Gear Pumps- Market Insights and Forecast 2022-2032, USD Million
5.2.1.2.4. Lobe Pumps- Market Insights and Forecast 2022-2032, USD Million
5.2.1.2.5. Progressive Cavity Pumps- Market Insights and Forecast 2022-2032, USD Million
5.2.1.2.6. Screw Pumps- Market Insights and Forecast 2022-2032, USD Million
5.2.1.2.7. Vane Pumps- Market Insights and Forecast 2022-2032, USD Million
5.2.1.2.8. Peristaltic Pumps- Market Insights and Forecast 2022-2032, USD Million
5.2.1.2.9. Others- Market Insights and Forecast 2022-2032, USD Million
5.2.2.By End User
5.2.2.1. Oil & Gas- Market Insights and Forecast 2022-2032, USD Million
5.2.2.2. Power- Market Insights and Forecast 2022-2032, USD Million
5.2.2.3. Residential- Market Insights and Forecast 2022-2032, USD Million
5.2.2.4. Agriculture & Irrigation- Market Insights and Forecast 2022-2032, USD Million
5.2.2.5. Commercial Building- Market Insights and Forecast 2022-2032, USD Million
5.2.2.6. HVAC- Market Insights and Forecast 2022-2032, USD Million
5.2.2.7. Chemical- Market Insights and Forecast 2022-2032, USD Million
5.2.2.8. Water & Wastewater- Market Insights and Forecast 2022-2032, USD Million
5.2.2.9. Food & Beverage- Market Insights and Forecast 2022-2032, USD Million
5.2.2.10. Others- Market Insights and Forecast 2022-2032, USD Million
5.2.3.By Country
5.2.3.1. China
5.2.3.2. India
5.2.3.3. Japan
5.2.3.4. South Korea
5.2.3.5. Southeast Asia
5.2.3.6. Rest of Asia Pacific
5.2.4.By Competitors
5.2.4.1. Competition Characteristics
5.2.4.2. Market Share & Analysis
6. China Water Pump Market Statistics, 2022-2032F
6.1. Market Size & Growth Outlook
6.1.1.By Revenues in US$ Million
6.1.2.By Units Sold in Million Units
6.2. Market Segmentation & Growth Outlook
6.2.1.By Pump Type- Market Insights and Forecast 2022-2032, USD Million
6.2.2.By End User- Market Insights and Forecast 2022-2032, USD Million
7. India Water Pump Market Statistics, 2022-2032F
7.1. Market Size & Growth Outlook
7.1.1.By Revenues in US$ Million
7.1.2.By Units Sold in Million Units
7.2. Market Segmentation & Growth Outlook
7.2.1.By Pump Type- Market Insights and Forecast 2022-2032, USD Million
7.2.2.By End User- Market Insights and Forecast 2022-2032, USD Million
8. Japan Water Pump Market Statistics, 2022-2032F
8.1. Market Size & Growth Outlook
8.1.1.By Revenues in US$ Million
8.1.2.By Units Sold in Million Units
8.2. Market Segmentation & Growth Outlook
8.2.1.By Pump Type- Market Insights and Forecast 2022-2032, USD Million
8.2.2.By End User- Market Insights and Forecast 2022-2032, USD Million
9. South Korea Water Pump Market Statistics, 2022-2032F
9.1. Market Size & Growth Outlook
9.1.1.By Revenues in US$ Million
9.1.2.By Units Sold in Million Units
9.2. Market Segmentation & Growth Outlook
9.2.1.By Pump Type- Market Insights and Forecast 2022-2032, USD Million
9.2.2.By End User- Market Insights and Forecast 2022-2032, USD Million
10. Southeast Asia Water Pump Market Statistics, 2022-2032F
10.1. Market Size & Growth Outlook
10.1.1. By Revenues in US$ Million
10.1.2. By Units Sold in Million Units
10.2. Market Segmentation & Growth Outlook
10.2.1. By Pump Type- Market Insights and Forecast 2022-2032, USD Million
10.2.2. By End User- Market Insights and Forecast 2022-2032, USD Million
11. Competitive Outlook
11.1. Company Profiles
11.1.1. Flowserve
11.1.1.1. Business Description
11.1.1.2. Product Portfolio
11.1.1.3. Collaborations & Alliances
11.1.1.4. Recent Developments
11.1.1.5. Financial Details
11.1.1.6. Others
11.1.2. Sulzer AG
11.1.2.1. Business Description
11.1.2.2. Product Portfolio
11.1.2.3. Collaborations & Alliances
11.1.2.4. Recent Developments
11.1.2.5. Financial Details
11.1.2.6. Others
11.1.3. KSB
11.1.3.1. Business Description
11.1.3.2. Product Portfolio
11.1.3.3. Collaborations & Alliances
11.1.3.4. Recent Developments
11.1.3.5. Financial Details
11.1.3.6. Others
11.1.4. Xylem
11.1.4.1. Business Description
11.1.4.2. Product Portfolio
11.1.4.3. Collaborations & Alliances
11.1.4.4. Recent Developments
11.1.4.5. Financial Details
11.1.4.6. Others
11.1.5. Grundfos
11.1.5.1. Business Description
11.1.5.2. Product Portfolio
11.1.5.3. Collaborations & Alliances
11.1.5.4. Recent Developments
11.1.5.5. Financial Details
11.1.5.6. Others
11.1.6. ITT
11.1.6.1. Business Description
11.1.6.2. Product Portfolio
11.1.6.3. Collaborations & Alliances
11.1.6.4. Recent Developments
11.1.6.5. Financial Details
11.1.6.6. Others
11.1.7. IDEX
11.1.7.1. Business Description
11.1.7.2. Product Portfolio
11.1.7.3. Collaborations & Alliances
11.1.7.4. Recent Developments
11.1.7.5. Financial Details
11.1.7.6. Others
11.1.8. Dover
11.1.8.1. Business Description
11.1.8.2. Product Portfolio
11.1.8.3. Collaborations & Alliances
11.1.8.4. Recent Developments
11.1.8.5. Financial Details
11.1.8.6. Others
11.1.9. Ebara
11.1.9.1. Business Description
11.1.9.2. Product Portfolio
11.1.9.3. Collaborations & Alliances
11.1.9.4. Recent Developments
11.1.9.5. Financial Details
11.1.9.6. Others
11.1.10. SPX Flow
11.1.10.1.Business Description
11.1.10.2.Product Portfolio
11.1.10.3.Collaborations & Alliances
11.1.10.4.Recent Developments
11.1.10.5.Financial Details
11.1.10.6.Others
11.1.11. Others (Kirloskar, Wilo, etc.)
11.1.11.1.Business Description
11.1.11.2.Product Portfolio
11.1.11.3.Collaborations & Alliances
11.1.11.4.Recent Developments
11.1.11.5.Financial Details
11.1.11.6.Others
12. Disclaimer
| Segment | Sub-Segment |
|---|---|
| By Pump Type |
|
| By End User |
|
| By Country |
|
Research Methodology
This study followed a structured approach comprising four key phases to assess the size and scope of the electro-oxidation market. The process began with thorough secondary research to collect data on the target market, related markets, and broader industry context. These findings, along with preliminary assumptions and estimates, were then validated through extensive primary research involving industry experts from across the value chain. To calculate the overall market size, both top-down and bottom-up methodologies were employed. Finally, market segmentation and data triangulation techniques were applied to refine and validate segment-level estimations.
Secondary Research
The secondary research phase involved gathering data from a wide range of credible and published sources. This step helped in identifying industry trends, defining market segmentation, and understanding the market landscape and value chain.
Sources consulted during this phase included:
- Company annual reports, investor presentations, and press releases
- Industry white papers and certified publications
- Trade directories and market-recognized databases
- Articles from authoritative authors and reputable journals
- Gold and silver standard websites
Secondary research was critical in mapping out the industry's value chain and monetary flow, identifying key market segments, understanding regional variations, and tracking significant industry developments.
Other key sources:
- Financial disclosures
- Industry associations and trade bodies
- News outlets and business magazines
- Academic journals and research studies
- Paid industry databases
Primary Research
To validate secondary data and gain deeper market insights, primary research was conducted with key stakeholders across both the supply and demand sides of the market.
On the demand side, participants included decision-makers and influencers from end-user industries—such as CIOs, CTOs, and CSOs—who provided first-hand perspectives on market needs, product usage, and future expectations.
On the supply side, interviews were conducted with manufacturers, industry associations, and institutional participants to gather insights into current offerings, product pipelines, and market challenges.
Primary interviews provided critical inputs such as:
- Market size and revenue data
- Product and service breakdowns
- Market forecasts
- Regional and application-specific trends
Stakeholders consulted included:
- Leading OEM and solution providers
- Channel and distribution partners
- End users across various applications
- Independent consultants and industry specialists
Market Size Estimation and Data Triangulation
- Identifying Key Market Participants (Secondary Research)
- Goal: To identify the major players or companies in the target market. This typically involves using publicly available data sources such as industry reports, market research publications, and financial statements of companies.
- Tools: Reports from firms like Gartner, Forrester, Euromonitor, Statista, IBISWorld, and others. Public financial statements, news articles, and press releases from top market players.
- Extracting Earnings of Key Market Participants
- Goal: To estimate the earnings generated from the product or service being analyzed. This step helps in understanding the revenue potential of each market player in a specific geography.
- Methods: Earnings data can be gathered from:
- Publicly available financial reports (for listed companies).
- Interviews and primary data sources from professionals, such as Directors, VPs, SVPs, etc. This is especially useful for understanding more nuanced, internal data that isn't publicly disclosed.
- Annual reports and investor presentations of key players.
- Data Collation and Development of a Relevant Data Model
- Goal: To collate inputs from both primary and secondary sources into a structured, data-driven model for market estimation. This model will incorporate key market KPIs and any independent variables relevant to the market.
- Key KPIs: These could include:
- Market size, growth rate, and demand drivers.
- Industry-specific metrics like market share, average revenue per customer (ARPC), or average deal size.
- External variables, such as economic growth rates, inflation rates, or commodity prices, that could affect the market.
- Data Modeling: Based on this data, the market forecasts are developed for the next 5 years. A combination of trend analysis, scenario modeling, and statistical regression might be used to generate projections.
- Scenario Analysis
- Goal: To test different assumptions and validate how sensitive the market is to changes in key variables (e.g., market demand, regulatory changes, technological disruptions).
- Types of Scenarios:
- Base Case: Based on current assumptions and historical data.
- Best-Case Scenario: Assuming favorable market conditions, regulatory environments, and technological advancements.
- Worst-Case Scenario: Accounting for adverse factors, such as economic downturns, stricter regulations, or unexpected disruptions.


