South Africa Sports Nutrition Market Report: Trends, Growth and Forecast (2026-2032)
By Product Type (Sports Protein Products (Protein/Energy Bars, Sports Protein Powder, Sports Protein RTD), Sports Non-Protein Products), By Sales Channel (Retail Offline, Retail Online), By Ingredients (Vitamins and Minerals, Proteins and Amino Acids, Carbohydrates, Probiotics, Botanicals/Herbals, Others), By Functionality (Energy, Muscle growth, Hydration, Weight Management, Others), By End User (Bodybuilders, Athletes, Lifestyle Users) ... Read more
|
Major Players
|
South Africa Sports Nutrition Market Statistics and Insights, 2026
- Market Size Statistics
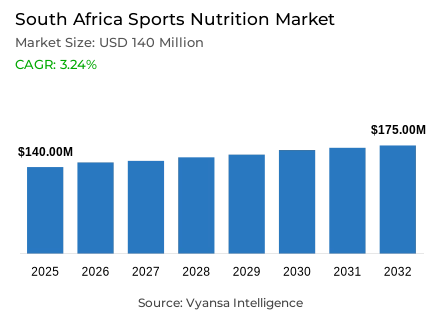
- Sports nutrition in South Africa is estimated at USD 140 million in 2025.
- The market size is expected to grow to USD 175 million by 2032.
- Market to register a cagr of around 3.24% during 2026-32.
- Product Type Shares
- Sports protein products grabbed market share of 60%.
- Competition
- More than 10 companies are actively engaged in producing sports nutrition in South Africa.
- Top 5 companies acquired around 70% of the market share.
- Bolus Distribution, Simba (Pty) Ltd, Woolworths Holdings Ltd (South Africa), Ultimate Sports Nutrition (Pty) Ltd, Dis-Chem Pharmacies (Pty) Ltd etc., are few of the top companies.
- Sales Channel
- Retail offline grabbed 70% of the market.
South Africa Sports Nutrition Market Outlook
The South Africa sports nutrition market is set to experience a consistent growth due to the expansion of demand beyond the conventional niche of fitness enthusiasts. The market is estimated to be USD 140 million in 2025 and USD 175 million in 2032 with a compound annual growth rate of about 3.24%. The growing interest in general health and wellness after the pandemic will further contribute to growth, and more end users will be interested in nutritional support of exercise, immunity and energy needs in their daily activities. Even though sports nutrition has traditionally been applied by the middle- and high-income gymnasium visitors, it is slowly gaining acceptance among the average end users who want to supplement their healthier diets.
The sports protein products that retain 60% of the market share will continue to be the value sales driver. Protein powders remain the most popular because of their versatility — they are being used not just to recover after a workout but also in more and more breakfast shakes or snacks. Expansion will also be based on the increasing popularity of protein and energy bars, especially among busy professionals and parents who are interested in convenient and healthier snack options. These bars will reflect the highest growth in volume with a low base in the forecast period.
The brand loyalty is high in South Africa and the end users are loyal to the names they trust like USN, Biogen, Evox and MuscleTech because of the fear of product effectiveness and safety. Nevertheless, there will be a chance to see the emergence of the private-label and smaller brands that provide cheaper alternatives due to the economic pressure. Convenient formats like pre-measured sachets or ready-made solutions will be significant, especially to busy, time-starved end users.
In terms of distribution, 70% of the sales are made through retail offline channels, with pharmacies, specialist stores and supermarkets where end users depend on advice and familiarity. Although offline will still prevail, online platforms are slowly catching up as shoppers pursue promotional deals and bulk-buying. In general, with the growth in health awareness and the introduction of brands that fit into the hectic lifestyle, the sports nutrition market in South Africa will continue to grow positively up to 2032.

South Africa Sports Nutrition Market Growth Driver
Growing Health and Fitness Awareness Supporting Sports Nutrition
The health awareness that has developed after the pandemic is still boosting the demand of sports nutrition in South Africa. The National Department of Health states that 31% of adults in South Africa are involved in moderate or vigorous physical activity on a regular basis. This growing emphasis on exercise, immunity, and wellness contributes to the long-term popularity of products that aid endurance, muscle repair and post-workout recovery. The World Health Organization also states that 39% of adults in South Africa are overweight, which increases the interest in nutrition solutions associated with fitness and weight management. These aspects support the increasing popularity of sports nutrition among end users who are interested in fitness.
Although the core end user group is still mid- to high-income gymnasium visitors, the usage is growing as more people are adding sports protein powder to their daily food habits. As people become more conscious of healthy diets and the advantages of proper protein consumption, sports nutrition is increasingly becoming a part of daily consumption habits. These conditions still favour positive category momentum.
South Africa Sports Nutrition Market Challenge
Strong Brand Loyalty Limiting Experimentation
High brand loyalty is also a major challenge in the South African sports nutrition market. The users of sports nutrition are often loyal to the brands they are used to because of the fear of the effectiveness of the product and the personal tolerance. This behaviour is supported by the 2023 Income and Expenditure Survey by Statistics South Africa, which shows that households in the top income decile spend 53% of their discretionary health and wellness on premium categories, which suggests that they make careful decisions when purchasing health and wellness products. These customers are concerned with reliability and are less willing to test new products.
Another obstacle to entry is price sensitivity. As South Africa has registered food inflation of 9.0% in 2023, families are becoming more interested in promotional opportunities and bulk-buying. As a result, old brands like USN, Biogen and Evox have a lot of loyalty, whereas new and smaller brands have a hard time getting into the market. The lack of end user experimentation stifles the diversity of competition and reduces the rate of adoption of alternative sports nutrition formats.
Unlock Market Intelligence
Explore the market potential with our data-driven report
South Africa Sports Nutrition Market Trend
Broadening End users Base Through Health-Driven Usage
The most notable trends that are influencing the category is the slow but steady growth of the use of sports protein powder beyond the conventional fitness enthusiasts. According to the South African National Health and Nutrition Examination Survey (SANHANES), 62% of adults report that they do not consume the recommended daily protein intake, which has led to a greater interest in protein supplementation. This has led to its uptake by health-conscious people who use sports protein in breakfast smoothies or functional meals.
Simultaneously, the functional foods have been on the rise in demand. The functional and fortified food category grew by 8% in 2023, according to the Department of Trade, Industry and Competition, which underscores the popularity of convenience foods with nutrients among end users. This trend erases the lines between categories, with breakfast cereals and other fortified products competing directly with sports protein powder. The broadening end user base contributes to the growth of the category and, at the same time, increases the competitive pressure of the neighboring health-food categories.
South Africa Sports Nutrition Market Opportunity
New Convenient Formats for Busy, High-Income End user
The innovation of convenience is a significant future category expansion opportunity. According to the Department of Small Business Development in South Africa, 71% of working adults travel to work every day, and the average time spent on the road is more than 46 minutes a day. This strengthens the need to have ready-to-consume, portable forms of nutrition that do not require preparation time. The convenience-based formats like pre-measured sachets, ready-to-drink hybrid mixes or small functional snacks are particularly open to high-income end users, who are the core sports nutrition audience.
Demographics of the workforce also favor this opportunity. The Labour Force Survey conducted by Statistics South Africa shows that 15.8 million South Africans are full-time employees, a significant number of whom work long hours and are in need of effective nutritional remedies. Creating fast, convenient, high-nutrition packaging that fits busy schedules can expand consumption outside gymnasium settings into workplaces, commuting and daily activities, and thus allow brands to expand their reach into time-starved but health-conscious end users.
Unlock Market Intelligence
Explore the market potential with our data-driven report
South Africa Sports Nutrition Market Segmentation Analysis
By Product Type
- Sports Protein Products
- Protein/Energy Bars
- Sports Protein Powder
- Sports Protein RTD
- Sports Non-Protein Products
The segment with highest market share under product type is Sports protein products, capturing around 60% of the South Africa sports nutrition market. Sports protein powder leads due to its extensive usage among gymnasium attendees, fitness enthusiasts, and increasingly, health-conscious individuals who incorporate it into daily meals such as shakes or breakfast preparations. Its affordability compared to ready-to-drink formats and its versatility for pre- and post-workout consumption continue to support substantial demand, rendering it the market's core product category.
Throughout the forecast period, sports protein products are expected to retain their leading position as the end user base gradually expands beyond athletes to include busy professionals and families seeking convenient nutrition. With rising interest in wellness, immune support, and functional diets, the category will benefit from broader adoption and innovations in flavour profiles, formulation, and packaging. Protein and energy bars will additionally support growth as convenient, portable options complement the dominance of protein powders.

By Sales Channel
- Retail Offline
- Retail Online
Retail offline represents the segment with the highest share within the sales channel, capturing 70% of the South Africa sports nutrition market. Supermarkets, pharmacies, and speciality retailers remain the primary purchasing points as end users prefer familiar retail outlets and benefit from in-store promotional campaigns, bulk-purchase discounts, and convenient access to trusted brands such as USN, Biogen, Evox, and Herbalife Nutrition. Offline channels additionally help reinforce brand loyalty, which remains elevated due to end user hesitation toward experimenting with unfamiliar products.
During the forecast period, retail offline is expected to maintain its dominant position as it continues offering reliable accessibility and attractive promotional opportunities for both premium and private-label product ranges. The presence of speciality stores additionally supports offline sales by guiding end users—particularly newcomers—toward suitable sports nutrition selections. Notwithstanding growing online interest, the assurance and convenience of offline shopping will maintain its position as the leading distribution channel across the forecast period.
List of Companies Covered in South Africa Sports Nutrition Market
The companies listed below are highly influential in the South Africa sports nutrition market, with a significant market share and a strong impact on industry developments.
- Bolus Distribution
- Simba (Pty) Ltd
- Woolworths Holdings Ltd (South Africa)
- Ultimate Sports Nutrition (Pty) Ltd
- Dis-Chem Pharmacies (Pty) Ltd
- Evox Ltd
- Herbalife International South Africa Ltd
- PVM Nutritional Sciences (Pty) Ltd
- Optimum Nutrition Distributors (Pty) Ltd
- Futurelife Health Products CC
Competitive Landscape
USN remained the dominant force in South Africa sports nutrition market in 2024, supported by strong brand loyalty among committed gym-goers and mid- to high-income consumers who rely on trusted products for performance and recovery. Brands such as Biogen, Evox, Herbalife Nutrition and MuscleTech also maintained solid presence, benefiting from loyal followings and retailer-driven promotions that encourage bulk purchasing of preferred products. Private label options, particularly from Woolworths, recorded dynamic double-digit growth as cost-conscious shoppers sought more affordable alternatives without compromising perceived quality. Meanwhile, smaller niche brands under others gained traction by appealing to consumers open to exploring new formulations, contributing to a more competitive landscape despite the category’s relatively narrow target audience.
Frequently Asked Questions
Related Report
1. Market Segmentation
1.1. Research Scope
1.2. Research Methodology
1.3. Definitions and Assumptions
2. Executive Summary
3. South Africa Sports Nutrition Market Policies, Regulations, and Standards
4. South Africa Sports Nutrition Market Dynamics
4.1. Growth Factors
4.2. Challenges
4.3. Trends
4.4. Opportunities
5. South Africa Sports Nutrition Market Statistics, 2022-2032F
5.1. Market Size & Growth Outlook
5.1.1.By Revenues in USD Million
5.2. Market Segmentation & Growth Outlook
5.2.1.By Product Type
5.2.1.1. Sports Protein Products- Market Insights and Forecast 2022-2032, USD Million
5.2.1.1.1. Protein/Energy Bars- Market Insights and Forecast 2022-2032, USD Million
5.2.1.1.2. Sports Protein Powder- Market Insights and Forecast 2022-2032, USD Million
5.2.1.1.3. Sports Protein RTD- Market Insights and Forecast 2022-2032, USD Million
5.2.1.2. Sports Non-Protein Products- Market Insights and Forecast 2022-2032, USD Million
5.2.2.By Sales Channel
5.2.2.1. Retail Offline- Market Insights and Forecast 2022-2032, USD Million
5.2.2.2. Retail Online- Market Insights and Forecast 2022-2032, USD Million
5.2.3.By Ingredients
5.2.3.1. Vitamins and Minerals- Market Insights and Forecast 2022-2032, USD Million
5.2.3.2. Proteins and Amino Acids- Market Insights and Forecast 2022-2032, USD Million
5.2.3.3. Carbohydrates- Market Insights and Forecast 2022-2032, USD Million
5.2.3.4. Probiotics- Market Insights and Forecast 2022-2032, USD Million
5.2.3.5. Botanicals/Herbals- Market Insights and Forecast 2022-2032, USD Million
5.2.3.6. Others- Market Insights and Forecast 2022-2032, USD Million
5.2.4.By Functionality
5.2.4.1. Energy- Market Insights and Forecast 2022-2032, USD Million
5.2.4.2. Muscle growth- Market Insights and Forecast 2022-2032, USD Million
5.2.4.3. Hydration- Market Insights and Forecast 2022-2032, USD Million
5.2.4.4. Weight Management- Market Insights and Forecast 2022-2032, USD Million
5.2.4.5. Others- Market Insights and Forecast 2022-2032, USD Million
5.2.5.By End User
5.2.5.1. Bodybuilders- Market Insights and Forecast 2022-2032, USD Million
5.2.5.2. Athletes- Market Insights and Forecast 2022-2032, USD Million
5.2.5.3. Lifestyle Users- Market Insights and Forecast 2022-2032, USD Million
5.2.6.By Competitors
5.2.6.1. Competition Characteristics
5.2.6.2. Market Share & Analysis
6. South Africa Protein Products Sports Nutrition Market Statistics, 2022-2032F
6.1. Market Size & Growth Outlook
6.1.1.By Revenues in USD Million
6.2. Market Segmentation & Growth Outlook
6.2.1.By Sales Channel- Market Insights and Forecast 2022-2032, USD Million
6.2.2.By Ingredients- Market Insights and Forecast 2022-2032, USD Million
6.2.3.By Functionality- Market Insights and Forecast 2022-2032, USD Million
6.2.4.By End User- Market Insights and Forecast 2022-2032, USD Million
7. South Africa Non-Protein Products Sports Nutrition Market Statistics, 2022-2032F
7.1. Market Size & Growth Outlook
7.1.1.By Revenues in USD Million
7.2. Market Segmentation & Growth Outlook
7.2.1.By Sales Channel- Market Insights and Forecast 2022-2032, USD Million
7.2.2.By Ingredients- Market Insights and Forecast 2022-2032, USD Million
7.2.3.By Functionality- Market Insights and Forecast 2022-2032, USD Million
7.2.4.By End User- Market Insights and Forecast 2022-2032, USD Million
8. Competitive Outlook
8.1. Company Profiles
8.1.1.Ultimate Sports Nutrition (Pty) Ltd
8.1.1.1. Business Description
8.1.1.2. Product Portfolio
8.1.1.3. Collaborations & Alliances
8.1.1.4. Recent Developments
8.1.1.5. Financial Details
8.1.1.6. Others
8.1.2.Dis-Chem Pharmacies (Pty) Ltd
8.1.2.1. Business Description
8.1.2.2. Product Portfolio
8.1.2.3. Collaborations & Alliances
8.1.2.4. Recent Developments
8.1.2.5. Financial Details
8.1.2.6. Others
8.1.3.Evox Ltd
8.1.3.1. Business Description
8.1.3.2. Product Portfolio
8.1.3.3. Collaborations & Alliances
8.1.3.4. Recent Developments
8.1.3.5. Financial Details
8.1.3.6. Others
8.1.4.Herbalife International South Africa Ltd
8.1.4.1. Business Description
8.1.4.2. Product Portfolio
8.1.4.3. Collaborations & Alliances
8.1.4.4. Recent Developments
8.1.4.5. Financial Details
8.1.4.6. Others
8.1.5.PVM Nutritional Sciences (Pty) Ltd
8.1.5.1. Business Description
8.1.5.2. Product Portfolio
8.1.5.3. Collaborations & Alliances
8.1.5.4. Recent Developments
8.1.5.5. Financial Details
8.1.5.6. Others
8.1.6.Bolus Distribution
8.1.6.1. Business Description
8.1.6.2. Product Portfolio
8.1.6.3. Collaborations & Alliances
8.1.6.4. Recent Developments
8.1.6.5. Financial Details
8.1.6.6. Others
8.1.7.Simba (Pty) Ltd
8.1.7.1. Business Description
8.1.7.2. Product Portfolio
8.1.7.3. Collaborations & Alliances
8.1.7.4. Recent Developments
8.1.7.5. Financial Details
8.1.7.6. Others
8.1.8.Woolworths Holdings Ltd
8.1.8.1. Business Description
8.1.8.2. Product Portfolio
8.1.8.3. Collaborations & Alliances
8.1.8.4. Recent Developments
8.1.8.5. Financial Details
8.1.8.6. Others
8.1.9.Optimum Nutrition Distributors (Pty) Ltd
8.1.9.1. Business Description
8.1.9.2. Product Portfolio
8.1.9.3. Collaborations & Alliances
8.1.9.4. Recent Developments
8.1.9.5. Financial Details
8.1.9.6. Others
8.1.10. Futurelife Health Products CC
8.1.10.1. Business Description
8.1.10.2. Product Portfolio
8.1.10.3. Collaborations & Alliances
8.1.10.4. Recent Developments
8.1.10.5. Financial Details
8.1.10.6. Others
9. Disclaimer
| Segment | Sub-Segment |
|---|---|
| By Product Type |
|
| By Sales Channel |
|
| By Ingredients |
|
| By Functionality |
|
| By End User |
|
Research Methodology
This study followed a structured approach comprising four key phases to assess the size and scope of the electro-oxidation market. The process began with thorough secondary research to collect data on the target market, related markets, and broader industry context. These findings, along with preliminary assumptions and estimates, were then validated through extensive primary research involving industry experts from across the value chain. To calculate the overall market size, both top-down and bottom-up methodologies were employed. Finally, market segmentation and data triangulation techniques were applied to refine and validate segment-level estimations.
Secondary Research
The secondary research phase involved gathering data from a wide range of credible and published sources. This step helped in identifying industry trends, defining market segmentation, and understanding the market landscape and value chain.
Sources consulted during this phase included:
- Company annual reports, investor presentations, and press releases
- Industry white papers and certified publications
- Trade directories and market-recognized databases
- Articles from authoritative authors and reputable journals
- Gold and silver standard websites
Secondary research was critical in mapping out the industry's value chain and monetary flow, identifying key market segments, understanding regional variations, and tracking significant industry developments.
Other key sources:
- Financial disclosures
- Industry associations and trade bodies
- News outlets and business magazines
- Academic journals and research studies
- Paid industry databases
Primary Research
To validate secondary data and gain deeper market insights, primary research was conducted with key stakeholders across both the supply and demand sides of the market.
On the demand side, participants included decision-makers and influencers from end-user industries—such as CIOs, CTOs, and CSOs—who provided first-hand perspectives on market needs, product usage, and future expectations.
On the supply side, interviews were conducted with manufacturers, industry associations, and institutional participants to gather insights into current offerings, product pipelines, and market challenges.
Primary interviews provided critical inputs such as:
- Market size and revenue data
- Product and service breakdowns
- Market forecasts
- Regional and application-specific trends
Stakeholders consulted included:
- Leading OEM and solution providers
- Channel and distribution partners
- End users across various applications
- Independent consultants and industry specialists
Market Size Estimation and Data Triangulation
- Identifying Key Market Participants (Secondary Research)
- Goal: To identify the major players or companies in the target market. This typically involves using publicly available data sources such as industry reports, market research publications, and financial statements of companies.
- Tools: Reports from firms like Gartner, Forrester, Euromonitor, Statista, IBISWorld, and others. Public financial statements, news articles, and press releases from top market players.
- Extracting Earnings of Key Market Participants
- Goal: To estimate the earnings generated from the product or service being analyzed. This step helps in understanding the revenue potential of each market player in a specific geography.
- Methods: Earnings data can be gathered from:
- Publicly available financial reports (for listed companies).
- Interviews and primary data sources from professionals, such as Directors, VPs, SVPs, etc. This is especially useful for understanding more nuanced, internal data that isn't publicly disclosed.
- Annual reports and investor presentations of key players.
- Data Collation and Development of a Relevant Data Model
- Goal: To collate inputs from both primary and secondary sources into a structured, data-driven model for market estimation. This model will incorporate key market KPIs and any independent variables relevant to the market.
- Key KPIs: These could include:
- Market size, growth rate, and demand drivers.
- Industry-specific metrics like market share, average revenue per customer (ARPC), or average deal size.
- External variables, such as economic growth rates, inflation rates, or commodity prices, that could affect the market.
- Data Modeling: Based on this data, the market forecasts are developed for the next 5 years. A combination of trend analysis, scenario modeling, and statistical regression might be used to generate projections.
- Scenario Analysis
- Goal: To test different assumptions and validate how sensitive the market is to changes in key variables (e.g., market demand, regulatory changes, technological disruptions).
- Types of Scenarios:
- Base Case: Based on current assumptions and historical data.
- Best-Case Scenario: Assuming favorable market conditions, regulatory environments, and technological advancements.
- Worst-Case Scenario: Accounting for adverse factors, such as economic downturns, stricter regulations, or unexpected disruptions.


