Philippines Cards and Payments Market Report: Trends, Growth and Forecast (2026-2032)
ByInstrument Type (Cards (Debit Card, Charge Card, ATM Card, Pre-Paid Card, Credit Card, Store Card), Mobile Wallets, Cheques, Others), ByCard Type (Contact Smart Card, Contactless Smart Card, Non-Smart Card), ByType of Payments (B2B, B2C, C2C, C2B (E-commerce Shopping, Payment at POS Terminals)), ByTransaction Type (Domestic, Foreign), ByApplication (Food & Groceries, Health & Pharmacies, Travel & Tourism, Hospitality, Others (Media & Entertainment)) ... Read more
|
Major Players
|
Philippines Cards and Payments Market Statistics and Insights, 2026
- Market Size Statistics
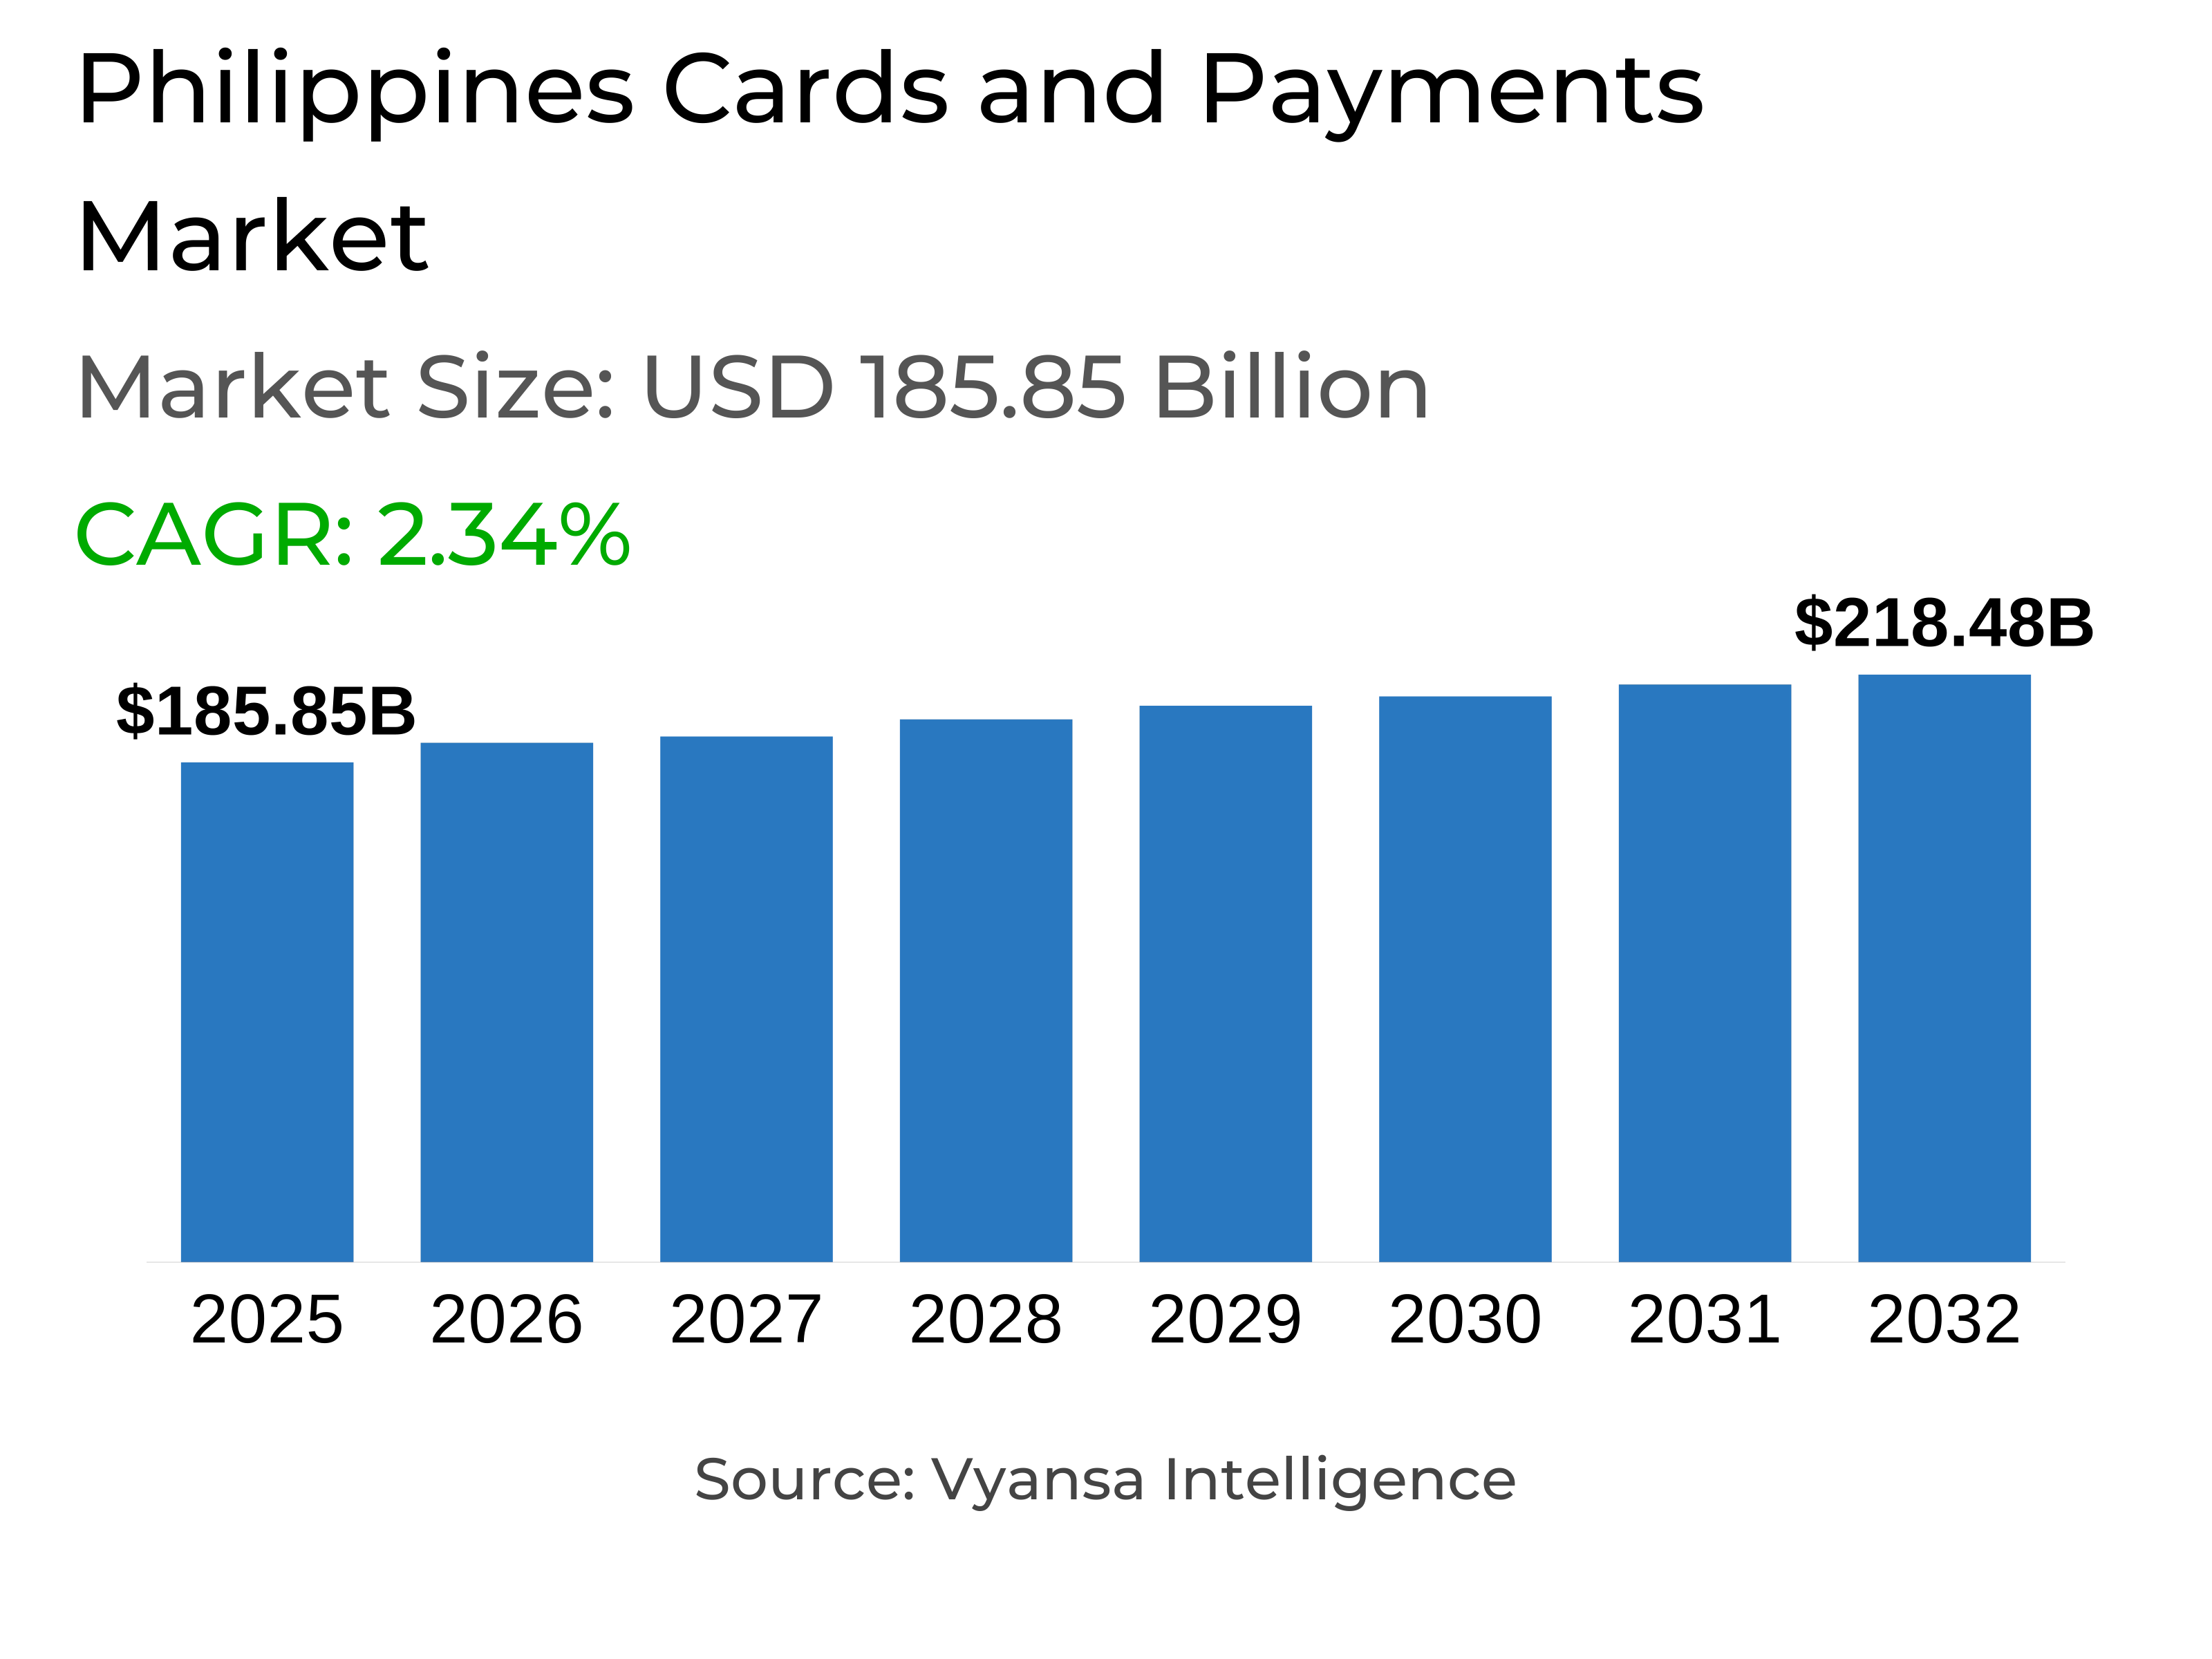
- Cards and Payments in Philippines is estimated at $ 185.85 Billion.
- The market size is expected to grow to $ 218.48 Billion by 2032.
- Market to register a CAGR of around 2.34% during 2026-32.
- Instrument Type Shares
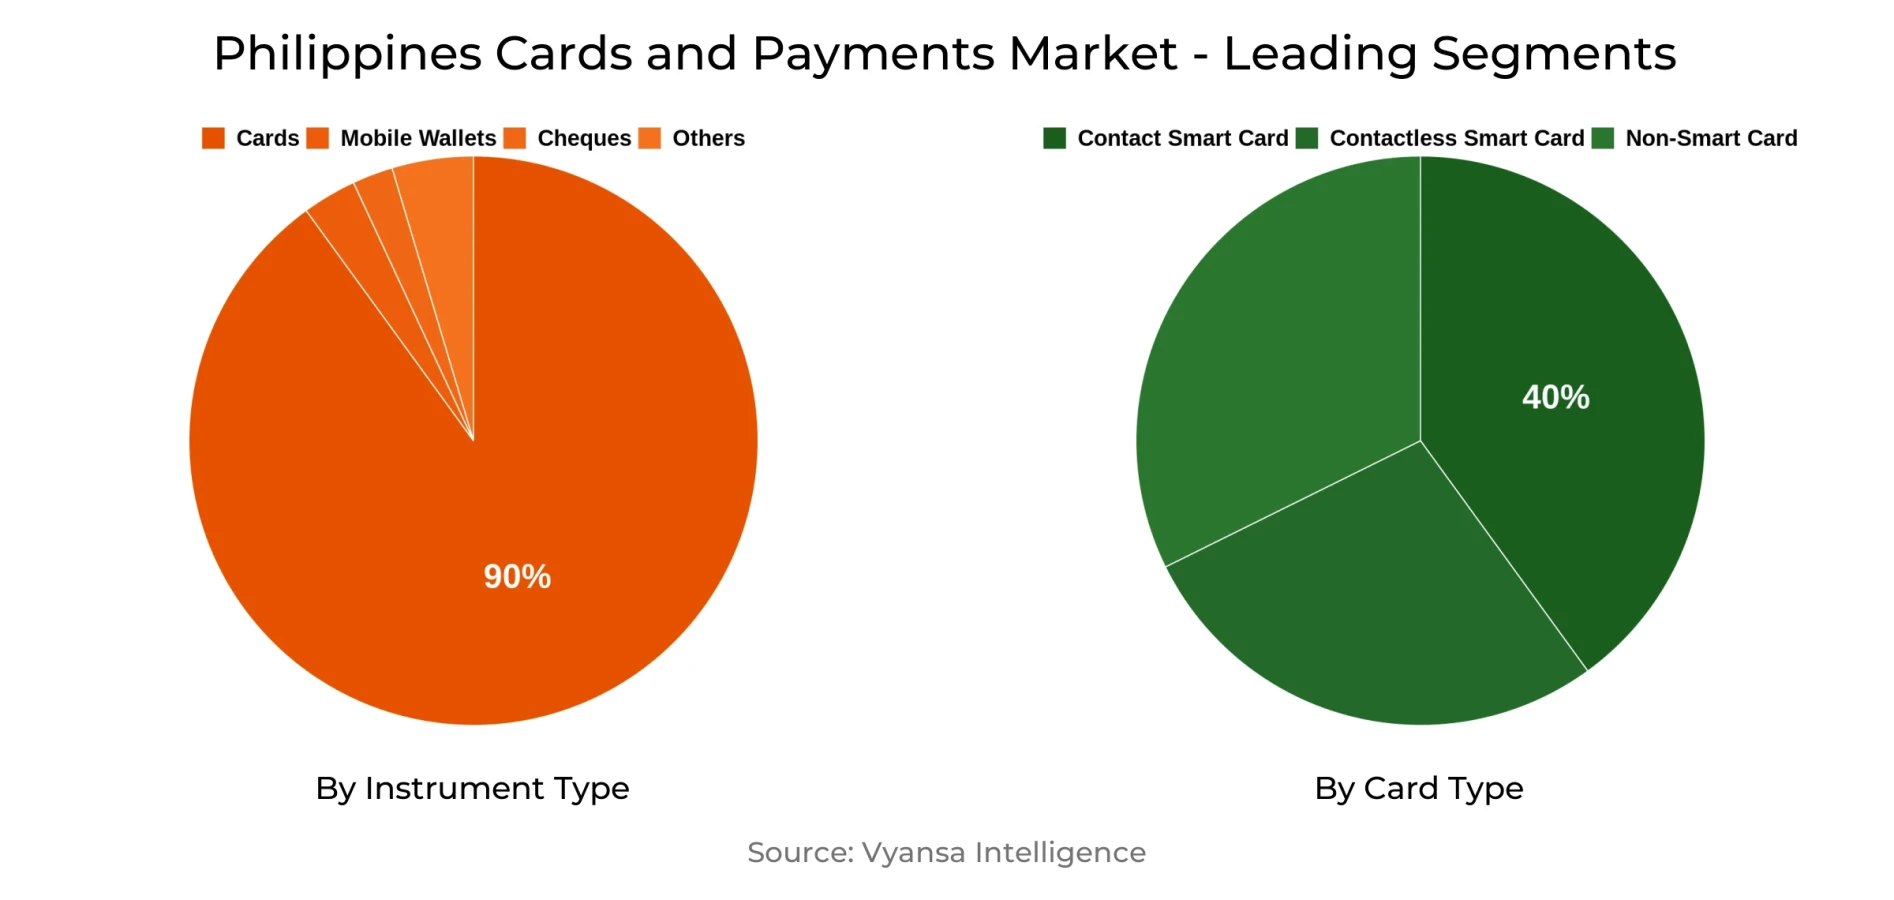
- Cards grabbed market share of 90%.
- Cards to witness a volume CAGR of around 4.37%.
- Competition
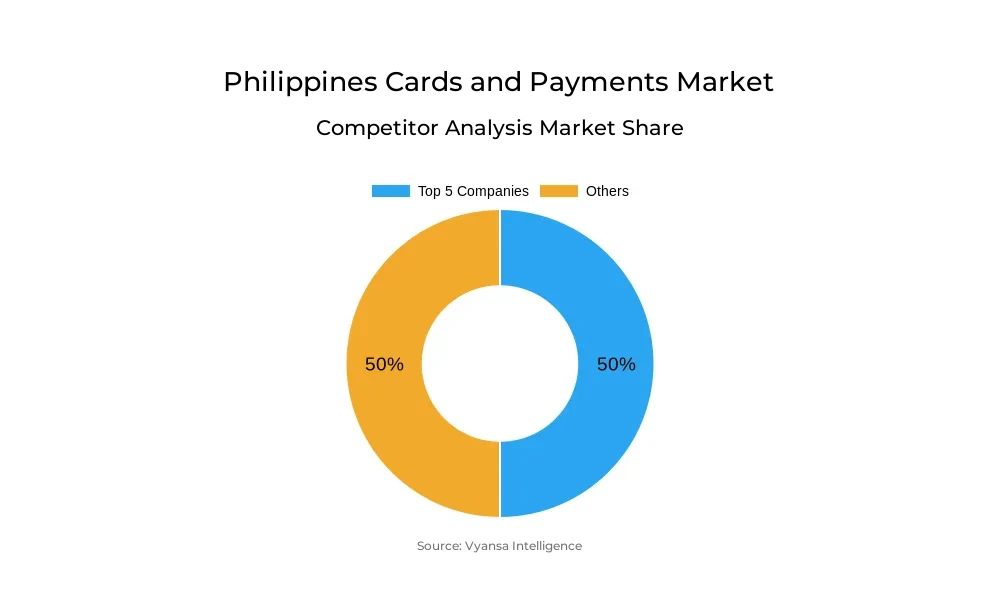
- More than 20 companies are actively engaged in producing Cards and Payments in Philippines.
- Top 5 companies acquired 50% of the market share.
- East West Banking Corp, G-Xchange Inc, Security Bank Corp, BDO Unibank Inc, Bank of the Philippine Islands - BPI etc., are few of the top companies.
- Card Type
- Contact Smart Card grabbed 40% of the market.
Philippines Cards and Payments Market Outlook
The Philippines cards and payments market, worth USD 185.85 billion, is poised to develop consistently to USD 218.48 billion by 2032. Expansion will be driven by the sharp rise in electronic payments, backed by the Central Bank's Digital Payments Transformation Roadmap, which has articulated aggressive ambitions for digitalisation. With digital payments already representing more than half of all payments, the market is inching towards a largely cash-lite economy.
Debit cards are likely to experience robust momentum as digital and conventional banks broaden their reach, extending financial services access. The market is also being supported through innovation in mobile app technology and the emergence of digital banks targeting smooth peer-to-peer and peer-to-merchant transactions. Meanwhile, ATM cards are estimated to register a volume CAGR of 4.37%, showing consistent demand for easy banking access. By card type, 40% of the market is dominated by contact smart cards, underlining their significant role in day-to-day transactions.
Credit cards will grow as younger generations, especially Gen Z, demand flexible credit products to reach their financial objectives. Issuers like RCBC and ZED are reaching out to this segment with tools that promote responsible use of credit as well as innovative no-fee credit card products. In the meantime, prepaid cards tied to wallets are gaining traction, providing low-cost and inclusive alternatives for underserved populations.
Mobile wallets will remain the kings of the digital financial space, with Maya and GCash leading adoption via innovative products, international collaborations, and increased use cases. By 2032, the Philippines will have a highly digitalized payments market, marked by broader card usage, increasing mobile wallet penetration, and robust government support for financial inclusion.
Philippines Cards and Payments Market Growth Driver
Central Bank Driving Digital Payments Adoption
The Digital Payments Transformation Roadmap of the Central Bank of the Philippines is a major driver of financial card and digital payment growth. In its efforts to facilitate secure, convenient, and inclusive digital payment schemes, the roadmap induces end users and merchants to move from cash to electronic transactions. Its emphasis on financial inclusion allows more Filipinos, even those in underserved segments, to tap formal payment channels, facilitating overall payments ecosystem growth.
The plan also solidifies the nation's digital infrastructure and builds trust in electronic payments. Through the establishment of a well-defined regulatory environment and embracing digital payment innovations, it drives the adoption of financial cards and mobile wallets. This change spurs the wider trend toward non-cash transactions, making the Philippines poised for sustained growth in electronic payments and a more extensive financial ecosystem.
Philippines Cards and Payments Market Trend
Growth and Use of Mobile Wallets
Online wallets such as GCash and Maya are spearheading a seismic change in the Philippines cards and payment market. Their ease of use, extensive range of financial services, and intuitive platforms have made them more popular among end users. Functionality such as money transfer, bill payments, online shopping, and investments enables users to conduct several financial activities using one app, further boosting adoption of digital payments.
Both Maya and GCash also associate physical prepaid cards with their wallets, making users more convenient and flexible. Strategic collaborations with international payment networks and abroad expansion allow Filipinos to pay on foreign lands with ease. The trend signals the increasing desire for digital-first financial products, which underpins the wider transition to cashless payments and amplifies the significance of mobile wallets as a major driver in the Philippines cards and payment market.
Unlock Market Intelligence
Explore the market potential with our data-driven report
Philippines Cards and Payments Market Opportunity
Increased Credit Demand by Young end users
The increasing demand for credit products from Generation Z is a major opportunity for the Philippine credit card market. Young end users are looking for tools to assist them in managing finances and reaching their financial aspirations, thus generating demand for innovative, accessible credit instruments. Banks and fintech companies with technology-driven, convenient platforms have the ability to tap into this segment, promoting responsible usage of credit while growing the base of end users.
Digital-oriented credit products, like fee-less cards and spending-tracking apps, enable issuers to target young end users who might have minimal access to banking services. By accessing this technology-driven segment, financial institutions have the potential to boost credit card adoption, deepen interaction with digital banking products, and encourage long-term growth in the Philippines' financial ecosystem.
Unlock Market Intelligence
Explore the market potential with our data-driven report
Philippines Cards and Payments Market Segmentation Analysis
By Instrument Type
- Cards
- Mobile Wallets
- Cheques
- Others
The most prominent segment under Instrument Type is cards with 90% of share. Cards lead the market because they have mass acceptance, are convenient to use, and make both electronic and conventional banking services available. Their dominant position is driven by banks' expansion of services and enhanced accessibility, enabling end users from various segments to efficiently manage their finances.
Other types of cards, such as debit, credit, and prepaid cards associated with electronic wallets, are also on the rise, addressing particularly millennials, Gen Z, and digitally inclined users. ATM cards are likely to experience a volume CAGR of approximately 4.37%, demonstrating consistent uptake. By and large, this break down captures end user behavior with respect to various card types, validating the transition towards a more digital and cash-light financial environment in the Philippines.
Top Companies in Philippines Cards and Payments Market
The top companies operating in the market include East West Banking Corp, G-Xchange Inc, Security Bank Corp, BDO Unibank Inc, Bank of the Philippine Islands - BPI, Metropolitan Bank & Trust Co - Metrobank - MBTC, Union Bank of the Philippines Inc, Rizal Commercial Banking Corp - RCBC, Philippine National Bank - PNB, Land Bank of the Philippines - LBP, etc., are the top players operating in the Philippines Cards and Payments Market.
Frequently Asked Questions
Related Report
1. Market Segmentation
1.1. Research Scope
1.2. Research Methodology
1.3. Definitions and Assumptions
2. Executive Summary
3. Philippines Cards and Payments Market Policies, Regulations, and Standards
4. Philippines Cards and Payments Market Dynamics
4.1. Growth Factors
4.2. Challenges
4.3. Trends
4.4. Opportunities
5. Philippines Cards and Payments Market Statistics, 2022-2032F
5.1. Market Size & Growth Outlook
5.1.1. By Revenues in US$ Million
5.2. Market Segmentation & Growth Outlook
5.2.1. By Instrument Type
5.2.1.1. Cards- Market Insights and Forecast 2022-2032, USD Million
5.2.1.1.1. Debit Card- Market Insights and Forecast 2022-2032, USD Million
5.2.1.1.2. Charge Card- Market Insights and Forecast 2022-2032, USD Million
5.2.1.1.3. ATM Card- Market Insights and Forecast 2022-2032, USD Million
5.2.1.1.4. Pre-Paid Card- Market Insights and Forecast 2022-2032, USD Million
5.2.1.1.5. Credit Card- Market Insights and Forecast 2022-2032, USD Million
5.2.1.1.6. Store Card- Market Insights and Forecast 2022-2032, USD Million
5.2.1.2. Mobile Wallets- Market Insights and Forecast 2022-2032, USD Million
5.2.1.3. Cheques- Market Insights and Forecast 2022-2032, USD Million
5.2.1.4. Others- Market Insights and Forecast 2022-2032, USD Million
5.2.2. By Card Type
5.2.2.1. Contact Smart Card- Market Insights and Forecast 2022-2032, USD Million
5.2.2.2. Contactless Smart Card- Market Insights and Forecast 2022-2032, USD Million
5.2.2.3. Non-Smart Card- Market Insights and Forecast 2022-2032, USD Million
5.2.3. By Type of Payments
5.2.3.1. B2B- Market Insights and Forecast 2022-2032, USD Million
5.2.3.2. B2C- Market Insights and Forecast 2022-2032, USD Million
5.2.3.3. C2C- Market Insights and Forecast 2022-2032, USD Million
5.2.3.4. C2B- Market Insights and Forecast 2022-2032, USD Million
5.2.3.4.1. E-commerce Shopping- Market Insights and Forecast 2022-2032, USD Million
5.2.3.4.2. Payment at POS Terminals- Market Insights and Forecast 2022-2032, USD Million
5.2.4. By Transaction Type
5.2.4.1. Domestic- Market Insights and Forecast 2022-2032, USD Million
5.2.4.2. Foreign- Market Insights and Forecast 2022-2032, USD Million
5.2.5. By Application
5.2.5.1. Food & Groceries- Market Insights and Forecast 2022-2032, USD Million
5.2.5.2. Health & Pharmacies- Market Insights and Forecast 2022-2032, USD Million
5.2.5.3. Travel & Tourism- Market Insights and Forecast 2022-2032, USD Million
5.2.5.4. Hospitality- Market Insights and Forecast 2022-2032, USD Million
5.2.5.5. Others (Media & Entertainment)- Market Insights and Forecast 2022-2032, USD Million
5.2.6. By Competitors
5.2.6.1. Competition Characteristics
5.2.6.2. Market Share & Analysis
6. Philippines Cards Market Statistics, 2022-2032F
6.1. Market Size & Growth Outlook
6.1.1. By Revenues in US$ Million
6.2. Market Segmentation & Growth Outlook
6.2.1. By Card Type- Market Insights and Forecast 2022-2032, USD Million
6.2.2. By Type of Payments- Market Insights and Forecast 2022-2032, USD Million
6.2.3. By Transaction Type- Market Insights and Forecast 2022-2032, USD Million
6.2.4. By Application- Market Insights and Forecast 2022-2032, USD Million
7. Philippines Mobile Wallets Market Statistics, 2022-2032F
7.1. Market Size & Growth Outlook
7.1.1. By Revenues in US$ Million
7.2. Market Segmentation & Growth Outlook
7.2.1. By Type of Payments- Market Insights and Forecast 2022-2032, USD Million
7.2.2. By Transaction Type- Market Insights and Forecast 2022-2032, USD Million
7.2.3. By Application- Market Insights and Forecast 2022-2032, USD Million
8. Philippines Cheques Market Statistics, 2022-2032F
8.1. Market Size & Growth Outlook
8.1.1. By Revenues in US$ Million
8.2. Market Segmentation & Growth Outlook
8.2.1. By Type of Payments- Market Insights and Forecast 2022-2032, USD Million
8.2.2. By Transaction Type- Market Insights and Forecast 2022-2032, USD Million
8.2.3. By Application- Market Insights and Forecast 2022-2032, USD Million
9. Competitive Outlook
9.1. Company Profiles
9.1.1. BDO Unibank Inc
9.1.1.1. Business Description
9.1.1.2. Product Portfolio
9.1.1.3. Collaborations & Alliances
9.1.1.4. Recent Developments
9.1.1.5. Financial Details
9.1.1.6. Others
9.1.2. Bank of the Philippine Islands - BPI
9.1.2.1. Business Description
9.1.2.2. Product Portfolio
9.1.2.3. Collaborations & Alliances
9.1.2.4. Recent Developments
9.1.2.5. Financial Details
9.1.2.6. Others
9.1.3. Metropolitan Bank & Trust Co - Metrobank - MBTC
9.1.3.1. Business Description
9.1.3.2. Product Portfolio
9.1.3.3. Collaborations & Alliances
9.1.3.4. Recent Developments
9.1.3.5. Financial Details
9.1.3.6. Others
9.1.4. Union Bank of the Philippines Inc
9.1.4.1. Business Description
9.1.4.2. Product Portfolio
9.1.4.3. Collaborations & Alliances
9.1.4.4. Recent Developments
9.1.4.5. Financial Details
9.1.4.6. Others
9.1.5. Rizal Commercial Banking Corp - RCBC
9.1.5.1. Business Description
9.1.5.2. Product Portfolio
9.1.5.3. Collaborations & Alliances
9.1.5.4. Recent Developments
9.1.5.5. Financial Details
9.1.5.6. Others
9.1.6. East West Banking Corp
9.1.6.1. Business Description
9.1.6.2. Product Portfolio
9.1.6.3. Collaborations & Alliances
9.1.6.4. Recent Developments
9.1.6.5. Financial Details
9.1.6.6. Others
9.1.7. G-Xchange Inc
9.1.7.1. Business Description
9.1.7.2. Product Portfolio
9.1.7.3. Collaborations & Alliances
9.1.7.4. Recent Developments
9.1.7.5. Financial Details
9.1.7.6. Others
9.1.8. Security Bank Corp
9.1.8.1. Business Description
9.1.8.2. Product Portfolio
9.1.8.3. Collaborations & Alliances
9.1.8.4. Recent Developments
9.1.8.5. Financial Details
9.1.8.6. Others
9.1.9. Philippine National Bank - PNB
9.1.9.1. Business Description
9.1.9.2. Product Portfolio
9.1.9.3. Collaborations & Alliances
9.1.9.4. Recent Developments
9.1.9.5. Financial Details
9.1.9.6. Others
9.1.10. Land Bank of the Philippines - LBP
9.1.10.1. Business Description
9.1.10.2. Product Portfolio
9.1.10.3. Collaborations & Alliances
9.1.10.4. Recent Developments
9.1.10.5. Financial Details
9.1.10.6. Others
10. Disclaimer
| Segment | Sub-Segment |
|---|---|
| By Instrument Type |
|
| By Card Type |
|
| By Type of Payments |
|
| By Transaction Type |
|
| By Application |
|
Research Methodology
This study followed a structured approach comprising four key phases to assess the size and scope of the electro-oxidation market. The process began with thorough secondary research to collect data on the target market, related markets, and broader industry context. These findings, along with preliminary assumptions and estimates, were then validated through extensive primary research involving industry experts from across the value chain. To calculate the overall market size, both top-down and bottom-up methodologies were employed. Finally, market segmentation and data triangulation techniques were applied to refine and validate segment-level estimations.
Secondary Research
The secondary research phase involved gathering data from a wide range of credible and published sources. This step helped in identifying industry trends, defining market segmentation, and understanding the market landscape and value chain.
Sources consulted during this phase included:
- Company annual reports, investor presentations, and press releases
- Industry white papers and certified publications
- Trade directories and market-recognized databases
- Articles from authoritative authors and reputable journals
- Gold and silver standard websites
Secondary research was critical in mapping out the industry's value chain and monetary flow, identifying key market segments, understanding regional variations, and tracking significant industry developments.
Other key sources:
- Financial disclosures
- Industry associations and trade bodies
- News outlets and business magazines
- Academic journals and research studies
- Paid industry databases
Primary Research
To validate secondary data and gain deeper market insights, primary research was conducted with key stakeholders across both the supply and demand sides of the market.
On the demand side, participants included decision-makers and influencers from end-user industries—such as CIOs, CTOs, and CSOs—who provided first-hand perspectives on market needs, product usage, and future expectations.
On the supply side, interviews were conducted with manufacturers, industry associations, and institutional participants to gather insights into current offerings, product pipelines, and market challenges.
Primary interviews provided critical inputs such as:
- Market size and revenue data
- Product and service breakdowns
- Market forecasts
- Regional and application-specific trends
Stakeholders consulted included:
- Leading OEM and solution providers
- Channel and distribution partners
- End users across various applications
- Independent consultants and industry specialists
Market Size Estimation and Data Triangulation
- Identifying Key Market Participants (Secondary Research)
- Goal: To identify the major players or companies in the target market. This typically involves using publicly available data sources such as industry reports, market research publications, and financial statements of companies.
- Tools: Reports from firms like Gartner, Forrester, Euromonitor, Statista, IBISWorld, and others. Public financial statements, news articles, and press releases from top market players.
- Extracting Earnings of Key Market Participants
- Goal: To estimate the earnings generated from the product or service being analyzed. This step helps in understanding the revenue potential of each market player in a specific geography.
- Methods: Earnings data can be gathered from:
- Publicly available financial reports (for listed companies).
- Interviews and primary data sources from professionals, such as Directors, VPs, SVPs, etc. This is especially useful for understanding more nuanced, internal data that isn't publicly disclosed.
- Annual reports and investor presentations of key players.
- Data Collation and Development of a Relevant Data Model
- Goal: To collate inputs from both primary and secondary sources into a structured, data-driven model for market estimation. This model will incorporate key market KPIs and any independent variables relevant to the market.
- Key KPIs: These could include:
- Market size, growth rate, and demand drivers.
- Industry-specific metrics like market share, average revenue per customer (ARPC), or average deal size.
- External variables, such as economic growth rates, inflation rates, or commodity prices, that could affect the market.
- Data Modeling: Based on this data, the market forecasts are developed for the next 5 years. A combination of trend analysis, scenario modeling, and statistical regression might be used to generate projections.
- Scenario Analysis
- Goal: To test different assumptions and validate how sensitive the market is to changes in key variables (e.g., market demand, regulatory changes, technological disruptions).
- Types of Scenarios:
- Base Case: Based on current assumptions and historical data.
- Best-Case Scenario: Assuming favorable market conditions, regulatory environments, and technological advancements.
- Worst-Case Scenario: Accounting for adverse factors, such as economic downturns, stricter regulations, or unexpected disruptions.


