Philippines Bottled Water Market Report: Trends, Growth and Forecast (2026-2032)
By Type of Water (Carbonated Bottled Water, Flavoured Bottled Water, Functional Bottled Water, Still Bottled Water), By Sub Types (Purified (Desalinated, Atmospheric Generated, Others), Mineral, Other (Spring, Alkaline, Other)), By Packaging Material (Flexible Packaging (Aluminium, Pouches), Glass, Rigid Plastic (PET Bottles, Thin Wall Plastic Containers, Others)), By Price Category (Budget, Economy, Premium), By Pack Size (100 ml, 125 ml, 200 ml, 250 ml, 330 ml, 370 ml, 450 ml, 500 ml, 591 ml, 750 ml, 1,000 ml, 1,500 ml, 4,000 ml, 5,000 ml, Others), By Sales Channel (On Trade (Restaurants, Hotels, Cafes, Others), Off Trade (Grocery Retailers (Convenience Retail, Supermarkets, Hypermarkets, Small Local Grocer), Non-Grocery Retailers (General Merchandise Stores, Health and Beauty Specialists), Vending, E-commerce)) ... Read more
|
Major Players
|
Philippines Bottled Water Market Statistics and Insights, 2026
- Market Size Statistics
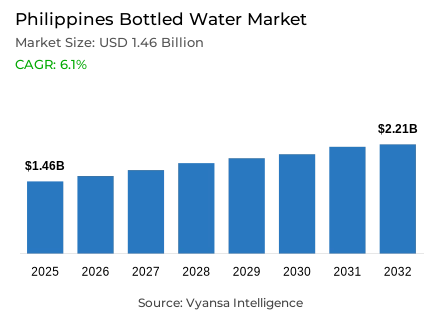
- Bottled water market size in Philippines was estimated at USD 1.46 billion in 2025.
- The market size is expected to grow to USD 2.21 billion by 2032.
- Market to register a CAGR of around 6.1% during 2026-32.
- Type of Water Shares
- Still bottled water grabbed market share of 85%.
- Competition
- More than 5 companies are actively engaged in producing bottled water in Philippines.
- Top 5 companies acquired around 90% of the market share.
- Nestle SA, Pepsi-Cola Products Philippines Inc, Danone Universal Robina Beverages Inc, Philippine Spring Water Resources Inc, Asia Brewery Inc etc., are few of the top companies.
- Sales Channel
- Off trade grabbed 85% of the market.
Philippines Bottled Water Market Outlook
The market of Philippines bottled water was estimated at USD 1.46 billion in 2025 and continues to expand as end users prioritize safe and convenient hydration. Growth is supported by sustained reliance on packaged drinking water, particularly in areas where access to fully reliable water services remains uneven. The market is projected to reach USD 2.21 billion by 2032, registering a CAGR of around 6.1% during 2026–2032, reflecting steady demand across urban and semi-urban locations.
The most common consumption pattern is still bottled water with 85 % of the total market share. Its leading status can be explained by its low cost, wide distribution, and regular replenishment in retail stores. The purified still water is the preferred daily hydration of end users, which consolidates its leadership in the wider category.
Under sales channel, off-trade holds 85% of the market, highlighting the importance of supermarkets, convenience stores, and sari-sari stores. These outlets ensure easy accessibility for at-home and on-the-go consumption, supporting consistent purchase behavior.
Overall, the outlook remains stable and growth-oriented through 2032, supported by daily essential usage, strong retail presence, and continued end user preference for safe packaged hydration solutions across the Philippines.

Philippines Bottled Water Market Growth DriverLimited Safely Managed Water Access Sustains Bottled Water Demand
Factor affecting the consumption of bottled water in the Philippines is the continued lack of access to safely managed and reliable water services. The preliminary 2024 Annual Poverty Indicators Survey by the Philippine Statistics Authority (PSA) showed that 97.5% of Philippines households had access to at least basic drinking water services in 2024, compared to 96.3% in 2022; however, there is still a group of households that lack fully reliable or safely managed water supplies at home.
The lack of safe drinking water on a regular basis makes end users choose bottled water as a reliable source of daily hydration. The reliance on packaged water is more pronounced in areas where piped water is not always available or where perceptions of water quality vary, which further supports the role of bottled water as a reliable and convenient source of safe drinking water.
Philippines Bottled Water Market ChallengeInfrastructure & Inequity in Safe Water Service Delivery
Despite the improvement of basic water access, there are still large gaps in safe water services that remain a challenge. According to the World Bank Philippines Economic Update, only 48% of the population have access to safely managed or piped water, with significant urban-rural disparities and underserved regions lagging behind.
This disparity negatively affects the even distribution and demand trends of bottled water, where producers have to deal with uneven infrastructure and end user dependence on refill stations, delivered water, or packaged products. These infrastructural shortcomings need to be addressed to realize long-term sustainable access and may change the dynamics of bottled water consumption.
Unlock Market Intelligence
Explore the market potential with our data-driven report
Philippines Bottled Water Market TrendHousehold Access to Basic Drinking Water
One of the most notable trends that influence the hydration decisions in the Philippines is the growing availability of the basic drinking water services. According to the 2024 Annual Poverty Indicators Survey by the PSA, access to water supply infrastructure has improved by small steps, with 97.5% of families having access in 2024.
End users are still conscious of water quality and reliability as more households achieve basic access. Despite the high levels of basic access, the scarcity of safely controlled services maintains a strong demand of bottled water, especially in urban and peri-urban areas where portability and convenience on the go are
Philippines Bottled Water Market OpportunityIncreasing Basic Water Access Enhances Consumer Confidence
The continued growth of the availability of basic drinking water is an opportunity that the bottled water brands can use to match the expectations of the people in terms of safety and quality. Since most of Philippines' families indicated access to basic drinking water in 2024 (PSA), bottled water will be able to position itself as a trusted complement where perceived service quality or convenience is most applicable.
Brands that focus on certified safety, trusted purification standards, and convenience will have end users who already appreciate increased access but require some assurance about water quality. This focus can enhance the involvement in retail and foodservice channels as end users incorporate bottled water into their daily hydration habits.
Unlock Market Intelligence
Explore the market potential with our data-driven report
Philippines Bottled Water Market Segmentation Analysis
By Type of Water
- Carbonated Bottled Water
- Flavoured Bottled Water
- Functional Bottled Water
- Still Bottled Water
The category of type of water that has dominated is still bottled water which has the largest market share of approximately 90%, and still water has dominated consumption patterns because of its popularity and daily use. Still bottled water is the most popular choice, which is justified by its low cost and regular replenishment in both the conventional and the modern sales outlets, as shown in the given data.
Still variants are perceived by end users as a dependable daily hydration option, and its wide presence in small formats guarantees a high number of purchases. As functional and fortified water types gain a bit of visibility, the main volume remains dominated by still purified bottled water.

By Sales Channel
- On Trade
- Restaurants
- Hotels
- Cafes
- Others
- Off Trade
- Grocery Retailers
- Convenience Retail
- Supermarkets
- Hypermarkets
- Small Local Grocer
- Non-Grocery Retailers
- General Merchandise Stores
- Health and Beauty Specialists
- Vending
- E-commerce
- Grocery Retailers
The segment with the largest share in the sales channel is the one with the highest share in the off-trade with 85%. The off-trade outlets such as sari-sari stores, supermarkets, and convenience stores are the main points of purchase of the bottled water making it easily available as a source of at-home and on-the-go consumption.
These outlets facilitate daily shopping and regular replenishment, which strengthens the position of bottled water as a household necessity in the Philippines. Although on-trade channels are used via food service and hospitality outlets, the majority of volume is produced via off-trade retail.
List of Companies Covered in Philippines Bottled Water Market
The companies listed below are highly influential in the Philippines bottled water market, with a significant market share and a strong impact on industry developments.
- Nestle SA
- Pepsi-Cola Products Philippines Inc
- Danone Universal Robina Beverages Inc
- Philippine Spring Water Resources Inc
- Asia Brewery Inc
- Coca-Cola Beverages Philippines Inc
- Universal Robina Corp
Competitive Landscape
Philippine Spring Water Resources is the market leader in the bottled water industry in the Philippines, with the highest growth rate in 2025. The company has strengthened its flagship brand, Nature’s Spring, through product innovation coupled with sustainability-oriented programs. One of the improvements is the introduction of a tethered cap design that is fixed to the bottle but can be easily twisted, flipped and locked. This aspect increases the convenience of consumers and promotes responsible packaging. In this way, the company strengthens its functional advantages as well as its environmental positioning, thus retaining a significant mass-market appeal and a wide distribution base.Coca-Cola Beverages Philippines remains a key competitor through its Wilkins brand, especially in the high end market. Wilkins appeals to health-conscious consumers by focusing on purity and quality. However, even with its strong brand equity, it faces the challenge of not being able to match the wider market penetration and scale achieved by Nature’s Spring.
Frequently Asked Questions
Related Report
- Market Segmentation
- Research Scope
- Research Methodology
- Definitions and Assumptions
- Executive Summary
- Philippines Bottled Water Market Policies, Regulations, and Standards
- Philippines Bottled Water Market Dynamics
- Growth Factors
- Challenges
- Trends
- Opportunities
- Philippines Bottled Water Market Statistics, 2022-2032F
- Market Size & Growth Outlook
- By Revenues in USD Million
- By Volume (Million Litres)
- Market Segmentation & Growth Outlook
- By Type of Water
- Carbonated Bottled Water- Market Insights and Forecast 2022-2032, USD Million
- Flavoured Bottled Water- Market Insights and Forecast 2022-2032, USD Million
- Functional Bottled Water- Market Insights and Forecast 2022-2032, USD Million
- Still Bottled Water- Market Insights and Forecast 2022-2032, USD Million
- By Sub Types
- Purified- Market Insights and Forecast 2022-2032, USD Million
- Desalinated- Market Insights and Forecast 2022-2032, USD Million
- Atmospheric Generated- Market Insights and Forecast 2022-2032, USD Million
- Others- Market Insights and Forecast 2022-2032, USD Million
- Mineral- Market Insights and Forecast 2022-2032, USD Million
- Other (Spring, Alkaline, Other) - Market Insights and Forecast 2022-2032, USD Million
- Purified- Market Insights and Forecast 2022-2032, USD Million
- By Packaging Material
- Flexible Packaging- Market Insights and Forecast 2022-2032, USD Million
- Aluminium- Market Insights and Forecast 2022-2032, USD Million
- Pouches- Market Insights and Forecast 2022-2032, USD Million
- Glass- Market Insights and Forecast 2022-2032, USD Million
- Rigid Plastic- Market Insights and Forecast 2022-2032, USD Million
- PET Bottles- Market Insights and Forecast 2022-2032, USD Million
- Thin Wall Plastic Containers- Market Insights and Forecast 2022-2032, USD Million
- Others- Market Insights and Forecast 2022-2032, USD Million
- Flexible Packaging- Market Insights and Forecast 2022-2032, USD Million
- By Price Category
- Budget- Market Insights and Forecast 2022-2032, USD Million
- Economy- Market Insights and Forecast 2022-2032, USD Million
- Premium- Market Insights and Forecast 2022-2032, USD Million
- By Pack Size
- 100 ml- Market Insights and Forecast 2022-2032, USD Million
- 125 ml- Market Insights and Forecast 2022-2032, USD Million
- 200 ml- Market Insights and Forecast 2022-2032, USD Million
- 250 ml- Market Insights and Forecast 2022-2032, USD Million
- 330 ml- Market Insights and Forecast 2022-2032, USD Million
- 370 ml- Market Insights and Forecast 2022-2032, USD Million
- 450 ml- Market Insights and Forecast 2022-2032, USD Million
- 500 ml- Market Insights and Forecast 2022-2032, USD Million
- 591 ml- Market Insights and Forecast 2022-2032, USD Million
- 750 ml- Market Insights and Forecast 2022-2032, USD Million
- 1,000 ml- Market Insights and Forecast 2022-2032, USD Million
- 1,500 ml- Market Insights and Forecast 2022-2032, USD Million
- 4,000 ml- Market Insights and Forecast 2022-2032, USD Million
- 5,000 ml- Market Insights and Forecast 2022-2032, USD Million
- Others- Market Insights and Forecast 2022-2032, USD Million
- By Sales Channel
- On Trade- Market Insights and Forecast 2022-2032, USD Million
- Restaurants- Market Insights and Forecast 2022-2032, USD Million
- Hotels- Market Insights and Forecast 2022-2032, USD Million
- Cafes- Market Insights and Forecast 2022-2032, USD Million
- Others- Market Insights and Forecast 2022-2032, USD Million
- Off Trade- Market Insights and Forecast 2022-2032, USD Million
- Grocery Retailers- Market Insights and Forecast 2022-2032, USD Million
- Convenience Retail- Market Insights and Forecast 2022-2032, USD Million
- Supermarkets- Market Insights and Forecast 2022-2032, USD Million
- Hypermarkets- Market Insights and Forecast 2022-2032, USD Million
- Small Local Grocer- Market Insights and Forecast 2022-2032, USD Million
- Non-Grocery Retailers- Market Insights and Forecast 2022-2032, USD Million
- General Merchandise Stores- Market Insights and Forecast 2022-2032, USD Million
- Health and Beauty Specialists- Market Insights and Forecast 2022-2032, USD Million
- Vending- Market Insights and Forecast 2022-2032, USD Million
- E-commerce- Market Insights and Forecast 2022-2032, USD Million
- Grocery Retailers- Market Insights and Forecast 2022-2032, USD Million
- On Trade- Market Insights and Forecast 2022-2032, USD Million
- By Competitors
- Competition Characteristics
- Market Share & Analysis
- By Type of Water
- Market Size & Growth Outlook
- Philippines Carbonated Bottled Water Market Statistics, 2022-2032
- Market Size & Growth Outlook
- By Revenues in USD Million
- By Volume (Million Litres)
- Market Segmentation & Growth Outlook
- By Sub Types- Market Insights and Forecast 2022-2032, USD Million
- By Packaging Material- Market Insights and Forecast 2022-2032, USD Million
- By Pack Size- Market Insights and Forecast 2022-2032, USD Million
- By Price Category- Market Insights and Forecast 2022-2032, USD Million
- By Sales Channel- Market Insights and Forecast 2022-2032, USD Million
- Market Size & Growth Outlook
- Philippines Flavoured Bottled Water Market Statistics, 2022-2032
- Market Size & Growth Outlook
- By Revenues in USD Million
- By Volume (Million Litres)
- Market Segmentation & Growth Outlook
- By Sub Types- Market Insights and Forecast 2022-2032, USD Million
- By Packaging Material- Market Insights and Forecast 2022-2032, USD Million
- By Pack Size- Market Insights and Forecast 2022-2032, USD Million
- By Price Category- Market Insights and Forecast 2022-2032, USD Million
- By Sales Channel- Market Insights and Forecast 2022-2032, USD Million
- Market Size & Growth Outlook
- Philippines Functional Bottled Water Market Statistics, 2022-2032
- Market Size & Growth Outlook
- By Revenues in USD Million
- By Volume (Million Litres)
- Market Segmentation & Growth Outlook
- By Sub Types- Market Insights and Forecast 2022-2032, USD Million
- By Packaging Material- Market Insights and Forecast 2022-2032, USD Million
- By Pack Size- Market Insights and Forecast 2022-2032, USD Million
- By Price Category- Market Insights and Forecast 2022-2032, USD Million
- By Sales Channel- Market Insights and Forecast 2022-2032, USD Million
- Market Size & Growth Outlook
- Philippines Still Bottled Water Market Statistics, 2022-2032
- Market Size & Growth Outlook
- By Revenues in USD Million
- By Volume (Million Litres)
- Market Segmentation & Growth Outlook
- By Sub Types- Market Insights and Forecast 2022-2032, USD Million
- By Packaging Material- Market Insights and Forecast 2022-2032, USD Million
- By Pack Size- Market Insights and Forecast 2022-2032, USD Million
- By Price Category- Market Insights and Forecast 2022-2032, USD Million
- By Sales Channel- Market Insights and Forecast 2022-2032, USD Million
- Market Size & Growth Outlook
- Competitive Outlook
- Company Profiles
- Philippine Spring Water Resources Inc
- Business Description
- Product Portfolio
- Collaborations & Alliances
- Recent Developments
- Financial Details
- Others
- Asia Brewery Inc
- Business Description
- Product Portfolio
- Collaborations & Alliances
- Recent Developments
- Financial Details
- Others
- Coca-Cola Beverages Philippines Inc
- Business Description
- Product Portfolio
- Collaborations & Alliances
- Recent Developments
- Financial Details
- Others
- Universal Robina Corp
- Business Description
- Product Portfolio
- Collaborations & Alliances
- Recent Developments
- Financial Details
- Others
- Nestle SA
- Business Description
- Product Portfolio
- Collaborations & Alliances
- Recent Developments
- Financial Details
- Others
- Pepsi-Cola Products Philippines Inc
- Business Description
- Product Portfolio
- Collaborations & Alliances
- Recent Developments
- Financial Details
- Others
- Danone Universal Robina Beverages Inc
- Business Description
- Product Portfolio
- Collaborations & Alliances
- Recent Developments
- Financial Details
- Others
- Philippine Spring Water Resources Inc
- Company Profiles
- Disclaimer
| Segment | Sub-Segment |
|---|---|
| By Type of Water |
|
| By Sub Types |
|
| By Packaging Material |
|
| By Price Category |
|
| By Pack Size |
|
| By Sales Channel |
|
Research Methodology
This study followed a structured approach comprising four key phases to assess the size and scope of the electro-oxidation market. The process began with thorough secondary research to collect data on the target market, related markets, and broader industry context. These findings, along with preliminary assumptions and estimates, were then validated through extensive primary research involving industry experts from across the value chain. To calculate the overall market size, both top-down and bottom-up methodologies were employed. Finally, market segmentation and data triangulation techniques were applied to refine and validate segment-level estimations.
Secondary Research
The secondary research phase involved gathering data from a wide range of credible and published sources. This step helped in identifying industry trends, defining market segmentation, and understanding the market landscape and value chain.
Sources consulted during this phase included:
- Company annual reports, investor presentations, and press releases
- Industry white papers and certified publications
- Trade directories and market-recognized databases
- Articles from authoritative authors and reputable journals
- Gold and silver standard websites
Secondary research was critical in mapping out the industry's value chain and monetary flow, identifying key market segments, understanding regional variations, and tracking significant industry developments.
Other key sources:
- Financial disclosures
- Industry associations and trade bodies
- News outlets and business magazines
- Academic journals and research studies
- Paid industry databases
Primary Research
To validate secondary data and gain deeper market insights, primary research was conducted with key stakeholders across both the supply and demand sides of the market.
On the demand side, participants included decision-makers and influencers from end-user industries—such as CIOs, CTOs, and CSOs—who provided first-hand perspectives on market needs, product usage, and future expectations.
On the supply side, interviews were conducted with manufacturers, industry associations, and institutional participants to gather insights into current offerings, product pipelines, and market challenges.
Primary interviews provided critical inputs such as:
- Market size and revenue data
- Product and service breakdowns
- Market forecasts
- Regional and application-specific trends
Stakeholders consulted included:
- Leading OEM and solution providers
- Channel and distribution partners
- End users across various applications
- Independent consultants and industry specialists
Market Size Estimation and Data Triangulation
- Identifying Key Market Participants (Secondary Research)
- Goal: To identify the major players or companies in the target market. This typically involves using publicly available data sources such as industry reports, market research publications, and financial statements of companies.
- Tools: Reports from firms like Gartner, Forrester, Euromonitor, Statista, IBISWorld, and others. Public financial statements, news articles, and press releases from top market players.
- Extracting Earnings of Key Market Participants
- Goal: To estimate the earnings generated from the product or service being analyzed. This step helps in understanding the revenue potential of each market player in a specific geography.
- Methods: Earnings data can be gathered from:
- Publicly available financial reports (for listed companies).
- Interviews and primary data sources from professionals, such as Directors, VPs, SVPs, etc. This is especially useful for understanding more nuanced, internal data that isn't publicly disclosed.
- Annual reports and investor presentations of key players.
- Data Collation and Development of a Relevant Data Model
- Goal: To collate inputs from both primary and secondary sources into a structured, data-driven model for market estimation. This model will incorporate key market KPIs and any independent variables relevant to the market.
- Key KPIs: These could include:
- Market size, growth rate, and demand drivers.
- Industry-specific metrics like market share, average revenue per customer (ARPC), or average deal size.
- External variables, such as economic growth rates, inflation rates, or commodity prices, that could affect the market.
- Data Modeling: Based on this data, the market forecasts are developed for the next 5 years. A combination of trend analysis, scenario modeling, and statistical regression might be used to generate projections.
- Scenario Analysis
- Goal: To test different assumptions and validate how sensitive the market is to changes in key variables (e.g., market demand, regulatory changes, technological disruptions).
- Types of Scenarios:
- Base Case: Based on current assumptions and historical data.
- Best-Case Scenario: Assuming favorable market conditions, regulatory environments, and technological advancements.
- Worst-Case Scenario: Accounting for adverse factors, such as economic downturns, stricter regulations, or unexpected disruptions.


