Peru Bottled Water Market Report: Trends, Growth and Forecast (2026-2032)
By Type of Water (Carbonated Bottled Water, Flavoured Bottled Water, Functional Bottled Water, Still Bottled Water), By Sub Types (Purified (Desalinated, Atmospheric Generated, Others), Mineral, Other (Spring, Alkaline, Other)), By Packaging Material (Flexible Packaging (Aluminium, Pouches), Glass, Rigid Plastic (PET Bottles, Thin Wall Plastic Containers, Others)), By Price Category (Budget, Economy, Premium), By Pack Size (100 ml, 125 ml, 200 ml, 250 ml, 330 ml, 370 ml, 450 ml, 500 ml, 591 ml, 750 ml, 1,000 ml, 1,500 ml, 4,000 ml, 5,000 ml, Others), By Sales Channel (On Trade (Restaurants, Hotels, Cafes, Others), Off Trade (Grocery Retailers (Convenience Retail, Supermarkets, Hypermarkets, Small Local Grocer), Non-Grocery Retailers (General Merchandise Stores), Vending, E-commerce)) ... Read more
|
Major Players
|
Peru Bottled Water Market Statistics and Insights, 2026
- Market Size Statistics
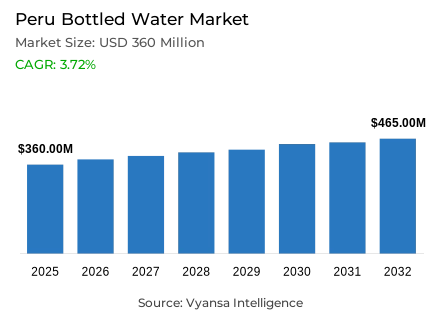
- Bottled water in Peru is estimated at USD 360 million in 2025.
- The market size is expected to grow to USD 465 million by 2032.
- Market to register a cagr of around 3.72% during 2026-32.
- Type of Water Shares
- Still bottled water grabbed market share of 80%.
- Competition
- Bottled water in Peru is currently being catered to by more than 5 companies.
- Top 5 companies acquired around 55% of the market share.
- Life International SAC; Gloria SA Grupo; Ajeper SA; Arca Continental Lindley SA; Unión de Cervecerías Peruanas Backus & Johnston SAA etc., are few of the top companies.
- Sales Channel
- Off trade grabbed 85% of the market.
Peru Bottled Water Market Outlook
Peru bottled water market is estimated at USD 360 million in 2025 and is expected to increase at a CAGR of about 3.72% in 2026-32 to about USD 465 million in 2032. This consistent perspective is indicative of the fact that bottled water is a need and not a luxury item. The chronic infrastructure deficits still influence the consumption patterns; 49% of the population has access to safely managed drinking water. As a result, bottled water is the most reliable and convenient source of hydration among urban and semi-urban families at home and in transit.
Long-term demand is also enhanced by health awareness. The end users are becoming less sugar-consuming and abandoning carbonated soft drinks in favour of low-calorie, additive-free drinks. The association with purity, safety, and preventive health behaviour is advantageous to bottled water. These variables provide a stable baseline consumption and stable volume growth, despite economic uncertainty. Combined, infrastructure constraints and health-based decisions offer long-term structural support to the market perspective up to 2032.
Still Bottled Water dominates the type of water segment with around 80% market share. Its leadership is affordable, familiar, and suitable to all age groups, making it the default option when it comes to everyday hydration. Although flavoured and functional versions are on the rise, they are still complementary; still water continues to anchor total volumes and daily household consumption across income groups.
The dynamics of the sales channels also contribute to stability, and off-trade takes approximately 85% of the market sales. Bottled water is a popular product bought in neighbourhood stores for regular replenishment and is also promoted online in cities as a bulk and repeat purchase. This high off-trade orientation guarantees stable supply and high market penetration, which forms the basis of the optimistic outlook for 2026-32.

Peru Bottled Water Market Growth Driver
Public Health Awareness and Water Safety Reinforce Daily Consumption
The increasing awareness of the population about health, as well as the long-term worries about the safety of tap water, remains the foundation of bottled water as a daily need in the Peru bottled water market. The lack of structural drinking water infrastructure is a determining factor i.e. 49% of the population has access to safely managed drinking water, as reported by WHO/UNICEF JMP (2024). This fact strengthens the habitual reliance on packaged water in urban and semi-urban households, making bottled water a necessity and not a luxury. To most end users, bottled water is the surest way of safe hydration, both at home and away.
At the same time, the increasing awareness of the health risks associated with diets is changing the preferences in drinks. End users are actively reducing their sugar intake and moving out of carbonated soft drinks to low-calorie, additive-free hydration products. Bottled water has the advantage of being closely related to preventive health behaviour because of its high association with purity, safety, and long-term well-being. These infrastructure constraints and health-based consumption priorities combined create a strong base demand and structural support of the category in the long term.
Peru Bottled Water Market Challenge
Regulatory Developments in Foodservice May Reshape On-Trade Dynamics
The uncertainty of policy regarding foodservice regulations is a significant limitation to future growth. In 2025, the Health and Population Commission of Peru passed a proposal to modify Law 28553, requiring foodservice establishments to serve up to one litre of free drinking water on request. Even though the proposal is still awaiting final Congressional approval, its possible enactment poses a structural threat to the sale of bottled water in regulated on-trade settings like restaurants, cafes, and casual dining establishments.
In case the regulation is adopted, it might decrease the purchase of impulse and additional bottled water by normalising the free access to drinking water with meals. Although bottled water still has a high trust advantage in terms of safety and consistency, especially when not at home, such a policy intervention can moderate the growth in volume in on-trade channels. The effect will be behavioural, not instantaneous, and will slowly change the consumption norms and put pressure on the value growth fuelled by foodservice demand.
Unlock Market Intelligence
Explore the market potential with our data-driven report
Peru Bottled Water Market Trend
Sugar Reduction Accelerates Shift Toward Flavoured and Functional Formats
Innovation in products in terms of flavour and functionality is transforming the consumption trends in bottled water. With the growing national health issues, end users are demanding beverages that provide taste and perceived wellness without the addition of sugar. According to the World Health Organization (2024), over 60% of adults in Peru are overweight or obese, and sugar reduction is the focus of dietary decision-making. This background enhances the adoption of flavoured bottled water as a substitute of light carbonates and other sweetened beverages.
There is also a growing popularity of functional bottled water, especially among urban end users who are more health conscious. Bottled water can compete with basic hydration by providing incremental value through variants that provide minerals, alkalinity, or digestive benefits. These formats facilitate premiumisation and retain a robust health halo, allowing brands to increase relevance in a variety of consumption moments. The growing variety of bottled water products is indicative of a larger trend of wellness-based beverage consumption in daily habits.
Peru Bottled Water Market Opportunity
Functional Differentiation and Tiered Portfolios Unlock Value Potential
Functional differentiation to increase portfolio depth is an obvious value creation opportunity. With bottled water deeply entrenched in everyday life, brands have more room to differentiate products on value, mainstream, and premium levels without compromising mass-market penetration. This opportunity is facilitated by enhancing consumption stability; the World Bank (2024) reports that the growth of private consumption in Peru has stabilised at over 3% and this allows selective trading-up in the key categories like bottled water.
Functional bottled water remains underpenetrated relative to its long-term potential, especially in terms of minerals, alkalinity, and specific wellness advantages. Multi-serve packs, family-size packs, and functional extensions give the company more room to grow incrementally and strengthen everyday usage. With a balance between affordability and innovation, bottled water players can defend volume leadership and incrementally increase value per litre. This two-pronged approach places the category in a position to address the changing health needs without losing its position as a fundamental household need.
Unlock Market Intelligence
Explore the market potential with our data-driven report
Peru Bottled Water Market Segmentation Analysis
By Type of Water
- Carbonated Bottled Water
- Flavoured Bottled Water
- Functional Bottled Water
- Still Bottled Water
Still bottled water holds the highest share within the Type of Water segmentation, accounting for around 80% of the market. Its dominance reflects its role as the primary solution for everyday hydration, particularly in a context where tap water safety remains inconsistent. Affordability, familiarity, and suitability for all age groups make still water the default choice for households and workplaces, reinforcing its central position in routine consumption. For end users, still bottled water represents a practical and trusted response to structural water quality concerns.
While flavoured and functional variants are gaining visibility, they continue to play a complementary role rather than displacing still water’s core function. Still bottled water anchors total category volumes, supporting stable demand across income segments and geographies. Its versatility across home, work, and on-the-go occasions ensures sustained relevance, even as innovation expands elsewhere in the category. As a result, still water remains the backbone of the Peru bottled water market.

By Sales Channel
- On Trade
- Restaurants
- Hotels
- Cafes
- Others
- Off Trade
- Grocery Retailers
- Convenience Retail
- Supermarkets
- Hypermarkets
- Small Local Grocer
- Non-Grocery Retailers
- General Merchandise Stores
- Vending
- E-commerce
- Grocery Retailers
Off-trade channels account for approximately 85% of bottled water sales, reflecting the category’s deep integration into household purchasing routines. Bottled water is widely treated as a daily essential rather than an occasional purchase, driving frequent replenishment through neighbourhood-based retail. Small local grocers play a central role within off-trade, benefiting from proximity, high purchase frequency, and the ability to meet immediate household needs. Their widespread presence across residential areas positions them as the primary last-mile outlet for bottled water.
At the same time, digital platforms are strengthening off-trade dynamics by enhancing convenience, particularly in urban centres. E-commerce and rapid delivery services are increasingly used for bulk and repeat purchases, complementing traditional retail rather than replacing it. The combination of physical proximity and digital accessibility reinforces off-trade dominance, ensuring bottled water remains readily available across consumption occasions. This channel structure continues to support high volume throughput and consistent market penetration.
List of Companies Covered in Peru Bottled Water Market
The companies listed below are highly influential in the Peru bottled water market, with a significant market share and a strong impact on industry developments.
- Life International SAC
- Gloria SA Grupo
- Ajeper SA
- Arca Continental Lindley SA
- Unión de Cervecerías Peruanas Backus & Johnston SAA
- CBC Peruana SAC
- Industrias San Miguel
Competitive Landscape
Peru’s bottled water market in 2025 is characterised by clear segmentation between volume-led affordability players and value-led premium brands. AJE and Industrias San Miguel rank among the leading companies in volume terms, driven by the strong performance of Cielo, which benefits from accessible pricing and deep penetration of the traditional retail channel nationwide. In contrast, Coca-Cola leads in value terms, leveraging the premium positioning of San Luis and its strong presence in modern retail, particularly within flavoured and carbonated bottled water. Competitive dynamics further evolved with Gloria’s acquisition of San Mateo from AB InBev, signalling increased strategic interest in the category. Meanwhile, Life International SAC emerged as one of the most dynamic players, successfully differentiating through its Life SOS functional water line, which is gaining traction among health-oriented consumers across both offline and online channels.
Frequently Asked Questions
Related Report
1. Market Segmentation
1.1. Research Scope
1.2. Research Methodology
1.3. Definitions and Assumptions
2. Executive Summary
3. Peru Bottled Water Market Policies, Regulations, and Standards
4. Peru Bottled Water Market Dynamics
4.1. Growth Factors
4.2. Challenges
4.3. Trends
4.4. Opportunities
5. Peru Bottled Water Market Statistics, 2022-2032F
5.1. Market Size & Growth Outlook
5.1.1.By Revenues in USD Million
5.1.2.By Volume (Million Litres)
5.2. Market Segmentation & Growth Outlook
5.2.1.By Type of Water
5.2.1.1. Carbonated Bottled Water- Market Insights and Forecast 2022-2032, USD Million
5.2.1.2. Flavoured Bottled Water- Market Insights and Forecast 2022-2032, USD Million
5.2.1.3. Functional Bottled Water- Market Insights and Forecast 2022-2032, USD Million
5.2.1.4. Still Bottled Water- Market Insights and Forecast 2022-2032, USD Million
5.2.2.By Sub Types
5.2.2.1. Purified- Market Insights and Forecast 2022-2032, USD Million
5.2.2.1.1. Desalinated- Market Insights and Forecast 2022-2032, USD Million
5.2.2.1.2. Atmospheric Generated- Market Insights and Forecast 2022-2032, USD Million
5.2.2.1.3. Others- Market Insights and Forecast 2022-2032, USD Million
5.2.2.2. Mineral- Market Insights and Forecast 2022-2032, USD Million
5.2.2.3. Other (Spring, Alkaline, Other) - Market Insights and Forecast 2022-2032, USD Million
5.2.3.By Packaging Material
5.2.3.1. Flexible Packaging- Market Insights and Forecast 2022-2032, USD Million
5.2.3.1.1. Aluminium- Market Insights and Forecast 2022-2032, USD Million
5.2.3.1.2. Pouches- Market Insights and Forecast 2022-2032, USD Million
5.2.3.2. Glass- Market Insights and Forecast 2022-2032, USD Million
5.2.3.3. Rigid Plastic- Market Insights and Forecast 2022-2032, USD Million
5.2.3.3.1. PET Bottles- Market Insights and Forecast 2022-2032, USD Million
5.2.3.3.2. Thin Wall Plastic Containers- Market Insights and Forecast 2022-2032, USD Million
5.2.3.3.3. Others- Market Insights and Forecast 2022-2032, USD Million
5.2.4.By Price Category
5.2.4.1. Budget- Market Insights and Forecast 2022-2032, USD Million
5.2.4.2. Economy- Market Insights and Forecast 2022-2032, USD Million
5.2.4.3. Premium- Market Insights and Forecast 2022-2032, USD Million
5.2.5.By Pack Size
5.2.5.1. 100 ml- Market Insights and Forecast 2022-2032, USD Million
5.2.5.2. 125 ml- Market Insights and Forecast 2022-2032, USD Million
5.2.5.3. 200 ml- Market Insights and Forecast 2022-2032, USD Million
5.2.5.4. 250 ml- Market Insights and Forecast 2022-2032, USD Million
5.2.5.5. 330 ml- Market Insights and Forecast 2022-2032, USD Million
5.2.5.6. 370 ml- Market Insights and Forecast 2022-2032, USD Million
5.2.5.7. 450 ml- Market Insights and Forecast 2022-2032, USD Million
5.2.5.8. 500 ml- Market Insights and Forecast 2022-2032, USD Million
5.2.5.9. 591 ml- Market Insights and Forecast 2022-2032, USD Million
5.2.5.10. 750 ml- Market Insights and Forecast 2022-2032, USD Million
5.2.5.11. 1,000 ml- Market Insights and Forecast 2022-2032, USD Million
5.2.5.12. 1,500 ml- Market Insights and Forecast 2022-2032, USD Million
5.2.5.13. 4,000 ml- Market Insights and Forecast 2022-2032, USD Million
5.2.5.14. 5,000 ml- Market Insights and Forecast 2022-2032, USD Million
5.2.5.15. Others- Market Insights and Forecast 2022-2032, USD Million
5.2.6.By Sales Channel
5.2.6.1. On Trade- Market Insights and Forecast 2022-2032, USD Million
5.2.6.1.1. Restaurants- Market Insights and Forecast 2022-2032, USD Million
5.2.6.1.2. Hotels- Market Insights and Forecast 2022-2032, USD Million
5.2.6.1.3. Cafes- Market Insights and Forecast 2022-2032, USD Million
5.2.6.1.4. Others- Market Insights and Forecast 2022-2032, USD Million
5.2.6.2. Off Trade- Market Insights and Forecast 2022-2032, USD Million
5.2.6.2.1. Grocery Retailers- Market Insights and Forecast 2022-2032, USD Million
5.2.6.2.1.1. Convenience Retail- Market Insights and Forecast 2022-2032, USD Million
5.2.6.2.1.2. Supermarkets- Market Insights and Forecast 2022-2032, USD Million
5.2.6.2.1.3. Hypermarkets- Market Insights and Forecast 2022-2032, USD Million
5.2.6.2.1.4. Small Local Grocer- Market Insights and Forecast 2022-2032, USD Million
5.2.6.2.2. Non-Grocery Retailers- Market Insights and Forecast 2022-2032, USD Million
5.2.6.2.2.1. General Merchandise Stores- Market Insights and Forecast 2022-2032, USD Million
5.2.6.2.3. Vending- Market Insights and Forecast 2022-2032, USD Million
5.2.6.2.4. E-commerce- Market Insights and Forecast 2022-2032, USD Million
5.2.7.By Competitors
5.2.7.1. Competition Characteristics
5.2.7.2. Market Share & Analysis
6. Peru Carbonated Bottled Water Market Statistics, 2022-2032
6.1. Market Size & Growth Outlook
6.1.1.By Revenues in USD Million
6.1.2.By Volume (Million Litres)
6.2. Market Segmentation & Growth Outlook
6.2.1.By Sub Types- Market Insights and Forecast 2022-2032, USD Million
6.2.2.By Packaging Material- Market Insights and Forecast 2022-2032, USD Million
6.2.3.By Pack Size- Market Insights and Forecast 2022-2032, USD Million
6.2.4.By Price Category- Market Insights and Forecast 2022-2032, USD Million
6.2.5.By Sales Channel- Market Insights and Forecast 2022-2032, USD Million
7. Peru Flavoured Bottled Water Market Statistics, 2022-2032
7.1. Market Size & Growth Outlook
7.1.1.By Revenues in USD Million
7.1.2.By Volume (Million Litres)
7.2. Market Segmentation & Growth Outlook
7.2.1.By Sub Types- Market Insights and Forecast 2022-2032, USD Million
7.2.2.By Packaging Material- Market Insights and Forecast 2022-2032, USD Million
7.2.3.By Pack Size- Market Insights and Forecast 2022-2032, USD Million
7.2.4.By Price Category- Market Insights and Forecast 2022-2032, USD Million
7.2.5.By Sales Channel- Market Insights and Forecast 2022-2032, USD Million
8. Peru Functional Bottled Water Market Statistics, 2022-2032
8.1. Market Size & Growth Outlook
8.1.1.By Revenues in USD Million
8.1.2.By Volume (Million Litres)
8.2. Market Segmentation & Growth Outlook
8.2.1.By Sub Types- Market Insights and Forecast 2022-2032, USD Million
8.2.2.By Packaging Material- Market Insights and Forecast 2022-2032, USD Million
8.2.3.By Pack Size- Market Insights and Forecast 2022-2032, USD Million
8.2.4.By Price Category- Market Insights and Forecast 2022-2032, USD Million
8.2.5.By Sales Channel- Market Insights and Forecast 2022-2032, USD Million
9. Peru Still Bottled Water Market Statistics, 2022-2032
9.1. Market Size & Growth Outlook
9.1.1.By Revenues in USD Million
9.1.2.By Volume (Million Litres)
9.2. Market Segmentation & Growth Outlook
9.2.1.By Sub Types- Market Insights and Forecast 2022-2032, USD Million
9.2.2.By Packaging Material- Market Insights and Forecast 2022-2032, USD Million
9.2.3.By Pack Size- Market Insights and Forecast 2022-2032, USD Million
9.2.4.By Price Category- Market Insights and Forecast 2022-2032, USD Million
9.2.5.By Sales Channel- Market Insights and Forecast 2022-2032, USD Million
10. Competitive Outlook
10.1. Company Profiles
10.1.1. Arca Continental Lindley SA
10.1.1.1. Business Description
10.1.1.2. Product Portfolio
10.1.1.3. Collaborations & Alliances
10.1.1.4. Recent Developments
10.1.1.5. Financial Details
10.1.1.6. Others
10.1.2. Unión de Cervecerías Peruanas Backus & Johnston SAA
10.1.2.1. Business Description
10.1.2.2. Product Portfolio
10.1.2.3. Collaborations & Alliances
10.1.2.4. Recent Developments
10.1.2.5. Financial Details
10.1.2.6. Others
10.1.3. CBC Peruana SAC
10.1.3.1. Business Description
10.1.3.2. Product Portfolio
10.1.3.3. Collaborations & Alliances
10.1.3.4. Recent Developments
10.1.3.5. Financial Details
10.1.3.6. Others
10.1.4. Industrias San Miguel
10.1.4.1. Business Description
10.1.4.2. Product Portfolio
10.1.4.3. Collaborations & Alliances
10.1.4.4. Recent Developments
10.1.4.5. Financial Details
10.1.4.6. Others
10.1.5. Ajeper SA
10.1.5.1. Business Description
10.1.5.2. Product Portfolio
10.1.5.3. Collaborations & Alliances
10.1.5.4. Recent Developments
10.1.5.5. Financial Details
10.1.5.6. Others
10.1.6. Life International SAC
10.1.6.1. Business Description
10.1.6.2. Product Portfolio
10.1.6.3. Collaborations & Alliances
10.1.6.4. Recent Developments
10.1.6.5. Financial Details
10.1.6.6. Others
10.1.7. Gloria SA Grupo
10.1.7.1. Business Description
10.1.7.2. Product Portfolio
10.1.7.3. Collaborations & Alliances
10.1.7.4. Recent Developments
10.1.7.5. Financial Details
10.1.7.6. Others
11. Disclaimer
| Segment | Sub-Segment |
|---|---|
| By Type of Water |
|
| By Sub Types |
|
| By Packaging Material |
|
| By Price Category |
|
| By Pack Size |
|
| By Sales Channel |
|
Research Methodology
This study followed a structured approach comprising four key phases to assess the size and scope of the electro-oxidation market. The process began with thorough secondary research to collect data on the target market, related markets, and broader industry context. These findings, along with preliminary assumptions and estimates, were then validated through extensive primary research involving industry experts from across the value chain. To calculate the overall market size, both top-down and bottom-up methodologies were employed. Finally, market segmentation and data triangulation techniques were applied to refine and validate segment-level estimations.
Secondary Research
The secondary research phase involved gathering data from a wide range of credible and published sources. This step helped in identifying industry trends, defining market segmentation, and understanding the market landscape and value chain.
Sources consulted during this phase included:
- Company annual reports, investor presentations, and press releases
- Industry white papers and certified publications
- Trade directories and market-recognized databases
- Articles from authoritative authors and reputable journals
- Gold and silver standard websites
Secondary research was critical in mapping out the industry's value chain and monetary flow, identifying key market segments, understanding regional variations, and tracking significant industry developments.
Other key sources:
- Financial disclosures
- Industry associations and trade bodies
- News outlets and business magazines
- Academic journals and research studies
- Paid industry databases
Primary Research
To validate secondary data and gain deeper market insights, primary research was conducted with key stakeholders across both the supply and demand sides of the market.
On the demand side, participants included decision-makers and influencers from end-user industries—such as CIOs, CTOs, and CSOs—who provided first-hand perspectives on market needs, product usage, and future expectations.
On the supply side, interviews were conducted with manufacturers, industry associations, and institutional participants to gather insights into current offerings, product pipelines, and market challenges.
Primary interviews provided critical inputs such as:
- Market size and revenue data
- Product and service breakdowns
- Market forecasts
- Regional and application-specific trends
Stakeholders consulted included:
- Leading OEM and solution providers
- Channel and distribution partners
- End users across various applications
- Independent consultants and industry specialists
Market Size Estimation and Data Triangulation
- Identifying Key Market Participants (Secondary Research)
- Goal: To identify the major players or companies in the target market. This typically involves using publicly available data sources such as industry reports, market research publications, and financial statements of companies.
- Tools: Reports from firms like Gartner, Forrester, Euromonitor, Statista, IBISWorld, and others. Public financial statements, news articles, and press releases from top market players.
- Extracting Earnings of Key Market Participants
- Goal: To estimate the earnings generated from the product or service being analyzed. This step helps in understanding the revenue potential of each market player in a specific geography.
- Methods: Earnings data can be gathered from:
- Publicly available financial reports (for listed companies).
- Interviews and primary data sources from professionals, such as Directors, VPs, SVPs, etc. This is especially useful for understanding more nuanced, internal data that isn't publicly disclosed.
- Annual reports and investor presentations of key players.
- Data Collation and Development of a Relevant Data Model
- Goal: To collate inputs from both primary and secondary sources into a structured, data-driven model for market estimation. This model will incorporate key market KPIs and any independent variables relevant to the market.
- Key KPIs: These could include:
- Market size, growth rate, and demand drivers.
- Industry-specific metrics like market share, average revenue per customer (ARPC), or average deal size.
- External variables, such as economic growth rates, inflation rates, or commodity prices, that could affect the market.
- Data Modeling: Based on this data, the market forecasts are developed for the next 5 years. A combination of trend analysis, scenario modeling, and statistical regression might be used to generate projections.
- Scenario Analysis
- Goal: To test different assumptions and validate how sensitive the market is to changes in key variables (e.g., market demand, regulatory changes, technological disruptions).
- Types of Scenarios:
- Base Case: Based on current assumptions and historical data.
- Best-Case Scenario: Assuming favorable market conditions, regulatory environments, and technological advancements.
- Worst-Case Scenario: Accounting for adverse factors, such as economic downturns, stricter regulations, or unexpected disruptions.


