Peru Beer Market Report: Trends, Growth and Forecast (2026-2032)
By Product Type (Dark Beer (Ale, Sorghum Beer, Weissbier/Weizen/Wheat Beer), Lager (Flavoured/Mixed Lager, Standard Lager (Premium Lager (Domestic Premium Lager, Imported Premium Lager), Mid-Priced Lager (Domestic Mid-Priced Lager, Imported Mid-Priced Lager), Economy Lager (Domestic Economy Lager, Imported Economy Lager))), Non/Low Alcohol Beer (Low Alcohol Beer, Non Alcoholic Beer), Stout, Others (Porter, Malt etc.)), By Production (Macro Brewery, Micro Brewery, Craft Brewery), By Packaging Type (Bottles, Cans, Others), By Sales Channel (On-Trade, Off-Trade) ... Read more
|
Major Players
|
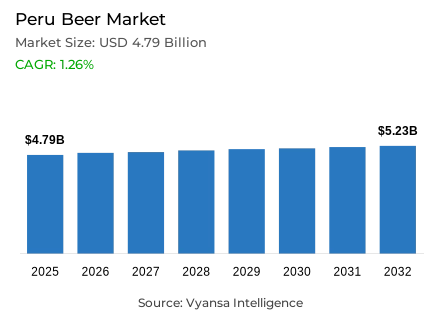
Peru Beer Market Statistics and Insights, 2026
- Market Size Statistics
- Beer in Peru is estimated at USD 4.79 billion in 2025.
- The market size is expected to grow to USD 5.23 billion by 2032.
- Market to register a cagr of around 1.26% during 2026-32.
- Product Type Shares
- Lager grabbed market share of 85%.
- Lager to witness a volume cagr of around 0.41%.
- Competition
- More than 5 companies are actively engaged in producing beer in Peru.
- Top 5 companies acquired around 95% of the market share.
- Cia Cervecera Ambev Perú SAC; Supermercados Peruanos SA; GW Yichang & Cía SA; Unión de Cervecerías Peruanas Backus & Johnston SAA; Heineken Perú SAC etc., are few of the top companies.
- Sales Channel
- Off-trade grabbed 85% of the market.
Peru Beer Market Outlook
The Peru beer market is around $4.79 billion in 2025 and is forecast to grow at the rate of $5.23 billion during 2032, with a CAGR of around 1.26% from 2026–2032. Beer consumption in total will be growing moderately, driven by continued improvements in the macroeconomic environment within the nation. Off-trade channels, accounting for 85%, will remain the dominant distribution channel, headed by supermarkets, discount stores, and convenience stores based on convenience, promotion campaigns, and price competitiveness. On-trade consumption will grow at a slow rate with beer sales in restaurants and bars recovering incrementally as end user confidence grows.
Lager, with 85% market share, will continue to be the undisputed seller of beer. Mid-range local lager brands Pilsen, Cristal, and Tres Cruces will have strong availability and end user loyalty and are expected to maintain these, while premium and craft lagers Cusqueña variants and imports have premiumisation as well as innovation potential. Lager volume growth is forecast at some 0.41%, which suggests stable but conservative trends in consumption.
Low-alcoholic and alcoholic-free beer is predicted to remain the quickest-growing segment during the forecast period. Growing end user demand for moderation, well-being, and healthy choices will underpin demand. High-profile product releases such as Corona Cero and Heineken 0.0 have helped raise awareness, while craft brewers will seek to expand flavour-led and seasonal offerings, including fruit-infused or specialty beers, further segmenting the market.
Flavor innovation, aroma innovation, and packaging innovation will drive the market direction. Market leaders will invest in portfolio extension expansion of existing portfolios, streamlining distribution, and reaching key end user groups with value-added propositions. Craft breweries will be required to continue depending on the on-trade channel to generate margins and loyalty. Together, these trends are likely to underpin steady, tempered growth for the Peru beer market

Peru Beer Market Growth DriverPortfolio Diversification Fuels Growth
Market leaders fuel growth in the Peru beer market through the diversification of their portfolios among flavoured, non-alcoholic, and seasonal beers. Corona Cero, Heineken 0.0, and Cusqueña Quinoa are some of the brands that appeal to end users who are looking for moderation, health-conscious options, and novelty. This portfolio diversification enables companies to reach a larger end users base and respond to evolving end users trends.
Craft breweries also fuel market expansion by providing high-end and craft beers with distinctive flavors and new brewing methods. New packaging and special-issue releases entice younger end users seeking out-of-the-ordinary experiences. By having a diversified portfolio, brands build equity, promote repeat buys, and maintain market growth even as end users are cautious of their expenditures.
Peru Beer Market TrendIncreasing Trend for Flavoured and Non-Alcoholic Beers
Flavored and non-alcoholic beers are also on the rise in Peru as end users increasingly demand wellness-focused and moderation-led alternatives. Brands such as Corona Cero, Heineken 0.0, and fruit-flavored craft beers appeal to young end userss that are looking for variety and new drinking experiences.
Craft breweries capitalize on this change by innovating with various profiles and seasonal productions. This evolution takes the beer market beyond mass categories and represents a transparent trend towards experience- and health-led consumption. Consequently, breweries emphasize innovation to address changing end user needs and maximize overall interaction.
Unlock Market Intelligence
Explore the market potential with our data-driven report
Peru Beer Market OpportunityPremium and Craft Beers Provide Future Growth
During the forecast period, premium and craft beers will generate substantial opportunities in the Peru beer market. Final end userss increasingly want artisanal flavor, better ingredients, and creative recipes, which will fuel demand for premium and seasonal products.
Flavoured and low-alcohol beer will retain their appeal to niche segments, allowing brewer portfolios to be differentiated and market coverage to be increased. Craft and premium innovation will lead the way in defining the future of the market, allowing continued growth through increased end users involvement, brand loyalty, and greater acceptance of specialized varieties of beer.
Unlock Market Intelligence
Explore the market potential with our data-driven report
Peru Beer Market Segmentation Analysis
By Product Type
- Dark Beer
- Lager
- Non/Low Alcohol Beer
- Stout
The segment with highest market share under Product Type is Lager with around 80% of the market. Lager remains the darling of Norway end users due to popularity, widespread availability, and consistent taste. Domestic producers' mid-priced lager tops volume sales, supported by Ringnes, Frydenlund, and Hansa favorites. Premium and economy lagers have smaller bases, but lager continues to be a popular choice with different end user groups for daily use and social use.
Throughout the forecast period, lager will remain in the leading position even as there are small overall declines in beer volumes. It will be supported by innovation in flavoured and mixed lagers, e.g. Radler, and growing interest in non/low alcohol variants. Lager's established reputation, recognition, and versatility make it the cornerstone of the Norway market for beers.

By Sales Channel
- On-Trade
- Off-Trade
The segment with highest market share under Sales Channel is Off-Trade segment at around 55% of the market. It is made up of supermarkets, discounters, and Vinmonopolet, the state-owned alcohol shop. Off-trade remains significant due to its convenience, competitiveness, and ability to provide a wide range of products, including mid-range lagers and non/low alcohol beers.
Discounters dominate off-trade volume since they cater to price-sensitive end users, whereas Vinmonopolet gains more upscale shoppers seeking premium or specialty beers. During the forecast period, off-trade will remain in a superior position, backing both traditional and emerging beer categories as well, with persistent sales derived from convenience, diversity, and price.
List of Companies Covered in Peru Beer Market
The companies listed below are highly influential in the Peru beer market, with a significant market share and a strong impact on industry developments.
- Cia Cervecera Ambev Perú SAC
- Supermercados Peruanos SA
- GW Yichang & Cía SA
- Unión de Cervecerías Peruanas Backus & Johnston SAA
- Heineken Perú SAC
Frequently Asked Questions
Related Report
1. Market Segmentation
1.1. Research Scope
1.2. Research Methodology
1.3. Definitions and Assumptions
2. Executive Summary
3. Peru Beer Market Policies, Regulations, and Standards
4. Peru Beer Market Dynamics
4.1. Growth Factors
4.2. Challenges
4.3. Trends
4.4. Opportunities
5. Peru Beer Market Statistics, 2022-2032F
5.1. Market Size & Growth Outlook
5.1.1.By Revenues in US$ Million
5.1.2.By Quantity Sold in Million Litres
5.2. Market Segmentation & Growth Outlook
5.2.1.By Product Type
5.2.1.1. Dark Beer- Market Insights and Forecast 2022-2032, USD Million
5.2.1.1.1. Ale- Market Insights and Forecast 2022-2032, USD Million
5.2.1.1.2. Sorghum Beer- Market Insights and Forecast 2022-2032, USD Million
5.2.1.1.3. Weissbier/Weizen/Wheat Beer- Market Insights and Forecast 2022-2032, USD Million
5.2.1.2. Lager- Market Insights and Forecast 2022-2032, USD Million
5.2.1.2.1. Flavoured/Mixed Lager- Market Insights and Forecast 2022-2032, USD Million
5.2.1.2.2. Standard Lager- Market Insights and Forecast 2022-2032, USD Million
5.2.1.2.2.1. Premium Lager- Market Insights and Forecast 2022-2032, USD Million
5.2.1.2.2.1.1. Domestic Premium Lager- Market Insights and Forecast 2022-2032, USD Million
5.2.1.2.2.1.2. Imported Premium Lager- Market Insights and Forecast 2022-2032, USD Million
5.2.1.2.2.2. Mid-Priced Lager- Market Insights and Forecast 2022-2032, USD Million
5.2.1.2.2.2.1. Domestic Mid-Priced Lager- Market Insights and Forecast 2022-2032, USD Million
5.2.1.2.2.2.2. Imported Mid-Priced Lager- Market Insights and Forecast 2022-2032, USD Million
5.2.1.2.2.3. Economy Lager- Market Insights and Forecast 2022-2032, USD Million
5.2.1.2.2.3.1. Domestic Economy Lager- Market Insights and Forecast 2022-2032, USD Million
5.2.1.2.2.3.2. Imported Economy Lager- Market Insights and Forecast 2022-2032, USD Million
5.2.1.3. Non/Low Alcohol Beer- Market Insights and Forecast 2022-2032, USD Million
5.2.1.3.1. Low Alcohol Beer- Market Insights and Forecast 2022-2032, USD Million
5.2.1.3.2. Non Alcoholic Beer- Market Insights and Forecast 2022-2032, USD Million
5.2.1.4. Stout- Market Insights and Forecast 2022-2032, USD Million
5.2.1.5. Others (Porter, Malt etc.) - Market Insights and Forecast 2022-2032, USD Million
5.2.2.By Production
5.2.2.1. Macro Brewery- Market Insights and Forecast 2022-2032, USD Million
5.2.2.2. Micro Brewery- Market Insights and Forecast 2022-2032, USD Million
5.2.2.3. Craft Brewery- Market Insights and Forecast 2022-2032, USD Million
5.2.3.By Packaging Type
5.2.3.1. Bottles- Market Insights and Forecast 2022-2032, USD Million
5.2.3.2. Cans- Market Insights and Forecast 2022-2032, USD Million
5.2.3.3. Others- Market Insights and Forecast 2022-2032, USD Million
5.2.4.By Sales Channel
5.2.4.1. On-Trade- Market Insights and Forecast 2022-2032, USD Million
5.2.4.2. Off-Trade- Market Insights and Forecast 2022-2032, USD Million
5.2.5.By Competitors
5.2.5.1. Competition Characteristics
5.2.5.2. Market Share & Analysis
6. Peru Dark Beer Market Statistics, 2022-2032F
6.1. Market Size & Growth Outlook
6.1.1.By Revenues in US$ Million
6.1.2.By Quantity Sold in Million Litres
6.2. Market Segmentation & Growth Outlook
6.2.1.By Product Type- Market Insights and Forecast 2022-2032, USD Million
6.2.2.By Production- Market Insights and Forecast 2022-2032, USD Million
6.2.3.By Packaging Type- Market Insights and Forecast 2022-2032, USD Million
6.2.4.By Sales Channel- Market Insights and Forecast 2022-2032, USD Million
7. Peru Lager Beer Market Statistics, 2022-2032F
7.1. Market Size & Growth Outlook
7.1.1.By Revenues in US$ Million
7.1.2.By Quantity Sold in Million Litres
7.2. Market Segmentation & Growth Outlook
7.2.1.By Product Type- Market Insights and Forecast 2022-2032, USD Million
7.2.2.By Production- Market Insights and Forecast 2022-2032, USD Million
7.2.3.By Packaging Type- Market Insights and Forecast 2022-2032, USD Million
7.2.4.By Sales Channel- Market Insights and Forecast 2022-2032, USD Million
8. Peru Non/Low Alcohol Beer Market Statistics, 2022-2032F
8.1. Market Size & Growth Outlook
8.1.1.By Revenues in US$ Million
8.1.2.By Quantity Sold in Million Litres
8.2. Market Segmentation & Growth Outlook
8.2.1.By Production- Market Insights and Forecast 2022-2032, USD Million
8.2.2.By Packaging Type- Market Insights and Forecast 2022-2032, USD Million
8.2.3.By Sales Channel- Market Insights and Forecast 2022-2032, USD Million
9. Peru Stout Beer Market Statistics, 2022-2032F
9.1. Market Size & Growth Outlook
9.1.1.By Revenues in US$ Million
9.1.2.By Quantity Sold in Million Litres
9.2. Market Segmentation & Growth Outlook
9.2.1.By Production- Market Insights and Forecast 2022-2032, USD Million
9.2.2.By Packaging Type- Market Insights and Forecast 2022-2032, USD Million
9.2.3.By Sales Channel- Market Insights and Forecast 2022-2032, USD Million
10. Competitive Outlook
10.1. Company Profiles
10.1.1. Unión de Cervecerías Peruanas Backus & Johnston SAA
10.1.1.1. Business Description
10.1.1.2. Product Portfolio
10.1.1.3. Collaborations & Alliances
10.1.1.4. Recent Developments
10.1.1.5. Financial Details
10.1.1.6. Others
10.1.2. Heineken Perú SAC
10.1.2.1. Business Description
10.1.2.2. Product Portfolio
10.1.2.3. Collaborations & Alliances
10.1.2.4. Recent Developments
10.1.2.5. Financial Details
10.1.2.6. Others
10.1.3. Cia Cervecera Ambev Perú SAC
10.1.3.1. Business Description
10.1.3.2. Product Portfolio
10.1.3.3. Collaborations & Alliances
10.1.3.4. Recent Developments
10.1.3.5. Financial Details
10.1.3.6. Others
10.1.4. Supermercados Peruanos SA
10.1.4.1. Business Description
10.1.4.2. Product Portfolio
10.1.4.3. Collaborations & Alliances
10.1.4.4. Recent Developments
10.1.4.5. Financial Details
10.1.4.6. Others
10.1.5. GW Yichang & Cía SA
10.1.5.1. Business Description
10.1.5.2. Product Portfolio
10.1.5.3. Collaborations & Alliances
10.1.5.4. Recent Developments
10.1.5.5. Financial Details
10.1.5.6. Others
11. Disclaimer
| Segment | Sub-Segment |
|---|---|
| By Product Type |
|
| By Production |
|
| By Packaging Type |
|
| By Sales Channel |
|
Research Methodology
This study followed a structured approach comprising four key phases to assess the size and scope of the electro-oxidation market. The process began with thorough secondary research to collect data on the target market, related markets, and broader industry context. These findings, along with preliminary assumptions and estimates, were then validated through extensive primary research involving industry experts from across the value chain. To calculate the overall market size, both top-down and bottom-up methodologies were employed. Finally, market segmentation and data triangulation techniques were applied to refine and validate segment-level estimations.
Secondary Research
The secondary research phase involved gathering data from a wide range of credible and published sources. This step helped in identifying industry trends, defining market segmentation, and understanding the market landscape and value chain.
Sources consulted during this phase included:
- Company annual reports, investor presentations, and press releases
- Industry white papers and certified publications
- Trade directories and market-recognized databases
- Articles from authoritative authors and reputable journals
- Gold and silver standard websites
Secondary research was critical in mapping out the industry's value chain and monetary flow, identifying key market segments, understanding regional variations, and tracking significant industry developments.
Other key sources:
- Financial disclosures
- Industry associations and trade bodies
- News outlets and business magazines
- Academic journals and research studies
- Paid industry databases
Primary Research
To validate secondary data and gain deeper market insights, primary research was conducted with key stakeholders across both the supply and demand sides of the market.
On the demand side, participants included decision-makers and influencers from end-user industries—such as CIOs, CTOs, and CSOs—who provided first-hand perspectives on market needs, product usage, and future expectations.
On the supply side, interviews were conducted with manufacturers, industry associations, and institutional participants to gather insights into current offerings, product pipelines, and market challenges.
Primary interviews provided critical inputs such as:
- Market size and revenue data
- Product and service breakdowns
- Market forecasts
- Regional and application-specific trends
Stakeholders consulted included:
- Leading OEM and solution providers
- Channel and distribution partners
- End users across various applications
- Independent consultants and industry specialists
Market Size Estimation and Data Triangulation
- Identifying Key Market Participants (Secondary Research)
- Goal: To identify the major players or companies in the target market. This typically involves using publicly available data sources such as industry reports, market research publications, and financial statements of companies.
- Tools: Reports from firms like Gartner, Forrester, Euromonitor, Statista, IBISWorld, and others. Public financial statements, news articles, and press releases from top market players.
- Extracting Earnings of Key Market Participants
- Goal: To estimate the earnings generated from the product or service being analyzed. This step helps in understanding the revenue potential of each market player in a specific geography.
- Methods: Earnings data can be gathered from:
- Publicly available financial reports (for listed companies).
- Interviews and primary data sources from professionals, such as Directors, VPs, SVPs, etc. This is especially useful for understanding more nuanced, internal data that isn't publicly disclosed.
- Annual reports and investor presentations of key players.
- Data Collation and Development of a Relevant Data Model
- Goal: To collate inputs from both primary and secondary sources into a structured, data-driven model for market estimation. This model will incorporate key market KPIs and any independent variables relevant to the market.
- Key KPIs: These could include:
- Market size, growth rate, and demand drivers.
- Industry-specific metrics like market share, average revenue per customer (ARPC), or average deal size.
- External variables, such as economic growth rates, inflation rates, or commodity prices, that could affect the market.
- Data Modeling: Based on this data, the market forecasts are developed for the next 5 years. A combination of trend analysis, scenario modeling, and statistical regression might be used to generate projections.
- Scenario Analysis
- Goal: To test different assumptions and validate how sensitive the market is to changes in key variables (e.g., market demand, regulatory changes, technological disruptions).
- Types of Scenarios:
- Base Case: Based on current assumptions and historical data.
- Best-Case Scenario: Assuming favorable market conditions, regulatory environments, and technological advancements.
- Worst-Case Scenario: Accounting for adverse factors, such as economic downturns, stricter regulations, or unexpected disruptions.


