North America Ethane Market Report: Trends, Growth and Forecast (2026-2032)
By Source (Natural Gas Processing, Refinery Off-Gases, Associated Gas, Shale Gas), By Product Type (Purity Ethane, Ethane Mixtures), By Transportation Mode (Pipeline, Rail, Marine, Road Tankers), By Storage Type (Cryogenic Storage, Pressurized Storage), By Application (Ethylene Production, Chemical Feedstocks, Refrigerants, Fuel & Power Generation, Others), By Country (The US, Canada, Mexico, Rest of North America) ... Read more
|
Major Players
|
North America Ethane Market Statistics and Insights, 2026
- Market Size Statistics
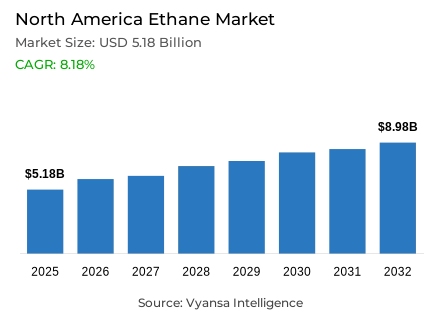
- Ethane market size in North America was valued at USD 5.18 billion in 2025 and is estimated at USD 6.26 billion in 2026.
- The market size is expected to grow to USD 8.98 billion by 2032.
- Market to register a CAGR of around 8.18% during 2026-32.
- Source Shares
- Shale gas grabbed market share of 60%.
- Competition
- More than 10 companies are actively engaged in producing ethane in North America.
- Top 5 companies acquired around 50% of the market share in 2026.
- Williams Companies Inc., Pembina Pipeline Corporation, Keyera Corp., Enterprise Products Partners L.P., Energy Transfer LP etc., are few of the top companies.
- Product Type
- Purity Ethane grabbed 80% of the market.
- Country
- The US leads with a 75% share of the North America market.
North America Ethane Market Outlook
The North America ethane market size was valued at USD 5.18 billion in 2025 and is projected to grow from USD 6.26 billion in 2026 to USD 8.98 billion by 2032, exhibiting a CAGR of 8.18% during the forecast period. The market is driven by abundant shale gas resources, expanding natural gas liquids production, and strong demand from petrochemical manufacturers that use ethane as a primary feedstock for ethylene production. The region benefits from a well-developed natural gas processing network and extensive petrochemical infrastructure that supports large-scale ethane utilization.
According to the US Energy Information Administration (EIA), US ethane production reached a record average of 2.8 million barrels per day in 2024, increasing by nearly 8% compared with 2023. The increase was supported by higher natural gas liquids output from major shale-producing regions, particularly the Permian Basin, strengthening feedstock availability across the region and reinforcing the supply foundation of the ethane market.
Shale Gas accounts for 60% of the source segment, while Purity Ethane represents 80% of the product type segment. The ethane market remains closely tied to unconventional gas development because most ethane volumes are recovered during natural gas processing and subsequently supplied to petrochemical facilities. Growth in shale production continues to support ethane availability for both domestic consumption and export activities.
The ethane market plays a critical role in the regional petrochemical value chain. Ethane is primarily used for ethylene production, which serves as a building block for plastics, packaging materials, synthetic products, and industrial chemicals. Ongoing investments in petrochemical capacity and downstream manufacturing continue to support long-term market growth.

North America Ethane Market Growth Driver
Rising Demand from Petrochemical Manufacturing
A major driver for the ethane market is increasing demand from petrochemical manufacturers. According to the US Energy Information Administration (EIA), domestic ethane consumption increased by 8% in 2024, reaching a record 2.3 million barrels per day. Ethane is consumed almost exclusively as a feedstock for steam crackers that produce ethylene and downstream chemical products.
Strong operating rates across petrochemical facilities continue to support consumption growth. The EIA also reported that ethane consumption along the US Gulf Coast increased by 5% to 2.1 million barrels per day in 2024. This sustained demand from ethylene producers reinforces the importance of the ethane market within the broader petrochemical industry.
North America Ethane Market Challenge
Infrastructure Expansion Remains Critical
A major challenge for the ethane market is ensuring that transportation, storage, fractionation, and export infrastructure expands in line with rising production volumes. According to the US Energy Information Administration (EIA), US ethane production increased by nearly 8% in 2024, reaching a record average of 2.8 million barrels per day.
As shale development continues across North America, additional pipelines, storage facilities, processing assets, and export terminals are required to efficiently manage increasing volumes. Infrastructure constraints can create bottlenecks that affect supply movement, operational flexibility, and market efficiency, making infrastructure development a key challenge for the ethane market.
Unlock Market Intelligence
Explore the market potential with our data-driven report
North America Ethane Market Trend
Higher Utilization of Existing Ethylene Assets
A key trend in the ethane market is the increasing utilization of existing ethylene production facilities. According to the US Energy Information Administration (EIA), no new steam crackers entered operation in the United States during 2024, yet domestic ethane consumption still increased by 8% because of higher operating rates at existing facilities.
The EIA also noted that ethane consumption on the US East Coast nearly tripled to 103,000 barrels per day in 2024 as Shell's Monaca petrochemical complex continued ramping up production. This trend highlights how producers are optimizing existing assets to absorb growing ethane supplies and meet downstream chemical demand, supporting continued expansion of the ethane market.
North America Ethane Market Opportunity
Continued Investment in Petrochemical Capacity
A major opportunity for the ethane market lies in ongoing investment across petrochemical manufacturing and downstream chemical production. According to the International Energy Agency (IEA), petrochemicals account for approximately 14% of global oil demand and 8% of global natural gas demand, making them one of the largest industrial consumers of hydrocarbon feedstocks.
As chemical manufacturers expand ethylene production and increase downstream processing capacity, demand for reliable ethane supplies is expected to remain strong. This creates growth opportunities for producers, processors, transportation providers, and infrastructure operators participating in the ethane market.
North America Ethane Market Country Analysis
By Country
- The US
- Canada
- Mexico
- Rest of North America
The U.S. holds the largest share of the North America Ethane Market, accounting for 75% of the regional industry. The country leads due to its abundant natural gas resources, extensive shale gas production, and well-established petrochemical infrastructure. These advantages support large-scale ethane recovery, processing, transportation, and utilization across the petrochemical value chain.
According to the US. Energy Information Administration (EIA), US ethane production averaged approximately 3.1 million barrels per day in 2024, while domestic ethane consumption reached a record 2.3 million barrels per day, driven by strong demand from ethylene producers. The country also maintains significant export capabilities and a large network of steam crackers that use ethane as a primary feedstock for ethylene production. This combination of abundant supply, strong domestic demand, and advanced petrochemical infrastructure continues to reinforce the US leadership position within the North America Ethane Market.
Unlock Market Intelligence
Explore the market potential with our data-driven report
North America Ethane Market Segmentation Analysis
By Source
- Natural Gas Processing
- Refinery Off-Gases
- Associated Gas
- Shale Gas
The segment with the highest share around the source category is shale gas, accounting for 60% of the market. The segment leads because shale formations contain significant volumes of natural gas liquids, including ethane, which are extracted during gas processing activities.
Within the ethane market, shale gas remains the dominant source due to extensive resource development across major producing regions such as the Permian, Marcellus, and Montney basins. The combination of abundant reserves and established infrastructure continues to support segment leadership.

By Product Type
- Purity Ethane
- Ethane Mixtures
The segment with the highest share around the product type category is purity ethane, accounting for 80% of the market. The segment leads because petrochemical manufacturers require high-quality feedstocks to maximize ethylene production efficiency and maintain consistent operational performance.
The ethane market continues to witness strong demand for purity ethane due to its suitability for steam cracking operations and large-scale petrochemical manufacturing. Its importance as a preferred feedstock supports its dominant position within the product type segment.
Various Market Players in North America Ethane Market
The companies mentioned below are highly active in the North America ethane market, occupying a considerable portion of the market and shaping industry progress.
- Williams Companies Inc.
- Pembina Pipeline Corporation
- Keyera Corp.
- Enterprise Products Partners L.P.
- Energy Transfer LP
- Targa Resources Corp.
- ONEOK Inc.
- Kinder Morgan Inc.
- Enbridge Inc.
- AltaGas Ltd.
- Chevron Phillips Chemical Company LLC
- ExxonMobil Corporation
Market News & Updates
- Pembina Pipeline Corporation, 2026:
Pembina Pipeline sanctioned the Heartland Extraction Plant in Alberta during 2026, strengthening its natural gas liquids (NGL) franchise across Western Canada. The project is intended to increase NGL extraction capacity from natural gas streams and support growing demand for NGL products, including ethane feedstock used by Canada's petrochemical sector. The development reinforces North America's integrated ethane and NGL value chain by enhancing upstream extraction and processing infrastructure.
- Enterprise Products Partners L.P., 2026:
Enterprise Products Partners announced progress on the Phase 2 expansion of its Neches River Terminal in Texas, which is scheduled to enter service during 2026. The expansion adds a flexible refrigeration train capable of loading up to 180,000 barrels per day of ethane or 360,000 barrels per day of propane, increasing North America's ethane export capacity. The project is designed to support growing international demand for North American natural gas liquids and strengthen the region's position as a major ethane export hub.
Frequently Asked Questions
Related Report
- Market Segmentation
- Research Scope
- Research Methodology
- Definitions and Assumptions
- Executive Summary
- North America Ethane Market Policies, Regulations, and Standards
- North America Ethane Production (Thousand Tons) Trend 2022-2032
- North America Ethane Production (Thousand Tons) Trend By Source
- Natural Gas Processing
- Refinery Off-Gases
- Associated Gas
- Shale Gas
- Company Wise Production Plants and Statistics
- Installed Production Capacity
- Actual Production
- Planned Production Target
- North America Ethane Production (Thousand Tons) Trend By Source
- North America Ethane Pricing Analysis 2022-2032
- North America Ethane Pricing Trend (USD/Thousand Tons) 2022-2032
- North America Ethane Pricing Trend (USD/Thousand Tons) By Country 2022-2032
- The US
- Canada
- Mexico
- North America Ethane Pricing Trend (USD/Thousand Tons) By Source 2022-2032
- Natural Gas Processing
- Refinery Off-Gases
- Associated Gas
- Shale Gas
- North America Ethane Market Dynamics
- Growth Factors
- Challenges
- Trends
- Opportunities
- North America Ethane Market Statistics, 2022-2032F
- Market Size & Growth Outlook
- By Revenues in USD Million
- Market Segmentation & Growth Outlook
- By Source
- Natural Gas Processing- Market Insights and Forecast 2022-2032, USD Million
- Refinery Off-Gases- Market Insights and Forecast 2022-2032, USD Million
- Associated Gas- Market Insights and Forecast 2022-2032, USD Million
- Shale Gas- Market Insights and Forecast 2022-2032, USD Million
- By Product Type
- Purity Ethane- Market Insights and Forecast 2022-2032, USD Million
- Ethane Mixtures- Market Insights and Forecast 2022-2032, USD Million
- By Transportation Mode
- Pipeline- Market Insights and Forecast 2022-2032, USD Million
- Rail- Market Insights and Forecast 2022-2032, USD Million
- Marine- Market Insights and Forecast 2022-2032, USD Million
- Road Tankers- Market Insights and Forecast 2022-2032, USD Million
- By Storage Type
- Cryogenic Storage- Market Insights and Forecast 2022-2032, USD Million
- Pressurized Storage- Market Insights and Forecast 2022-2032, USD Million
- By Application
- Ethylene Production- Market Insights and Forecast 2022-2032, USD Million
- Chemical Feedstocks- Market Insights and Forecast 2022-2032, USD Million
- Refrigerants- Market Insights and Forecast 2022-2032, USD Million
- Fuel & Power Generation- Market Insights and Forecast 2022-2032, USD Million
- Others- Market Insights and Forecast 2022-2032, USD Million
- By Country
- The US
- Canada
- Mexico
- Rest of North America
- By Competitors
- Competition Characteristics
- Market Share & Analysis
- By Source
- Market Size & Growth Outlook
- The US Ethane Market Statistics, 2022-2032F
- Market Size & Growth Outlook
- By Revenues in USD Million
- Market Segmentation & Growth Outlook
- By Source- Market Insights and Forecast 2022-2032, USD Million
- By Product Type- Market Insights and Forecast 2022-2032, USD Million
- By Transportation Mode- Market Insights and Forecast 2022-2032, USD Million
- By Storage Type- Market Insights and Forecast 2022-2032, USD Million
- By Application- Market Insights and Forecast 2022-2032, USD Million
- Market Size & Growth Outlook
- Canada Ethane Market Statistics, 2022-2032F
- Market Size & Growth Outlook
- By Revenues in USD Million
- Market Segmentation & Growth Outlook
- By Source- Market Insights and Forecast 2022-2032, USD Million
- By Product Type- Market Insights and Forecast 2022-2032, USD Million
- By Transportation Mode- Market Insights and Forecast 2022-2032, USD Million
- By Storage Type- Market Insights and Forecast 2022-2032, USD Million
- By Application- Market Insights and Forecast 2022-2032, USD Million
- Market Size & Growth Outlook
- Mexico Ethane Market Statistics, 2022-2032F
- Market Size & Growth Outlook
- By Revenues in USD Million
- Market Segmentation & Growth Outlook
- By Source- Market Insights and Forecast 2022-2032, USD Million
- By Product Type- Market Insights and Forecast 2022-2032, USD Million
- By Transportation Mode- Market Insights and Forecast 2022-2032, USD Million
- By Storage Type- Market Insights and Forecast 2022-2032, USD Million
- By Application- Market Insights and Forecast 2022-2032, USD Million
- Market Size & Growth Outlook
- Competitive Outlook
- Company Profiles
- Enterprise Products Partners L.P.
- Business Description
- Product Portfolio
- Collaborations & Alliances
- Recent Developments
- Financial Details
- Others
- Energy Transfer LP
- Business Description
- Product Portfolio
- Collaborations & Alliances
- Recent Developments
- Financial Details
- Others
- Targa Resources Corp.
- Business Description
- Product Portfolio
- Collaborations & Alliances
- Recent Developments
- Financial Details
- Others
- ONEOK Inc.
- Business Description
- Product Portfolio
- Collaborations & Alliances
- Recent Developments
- Financial Details
- Others
- Kinder Morgan Inc.
- Business Description
- Product Portfolio
- Collaborations & Alliances
- Recent Developments
- Financial Details
- Others
- Williams Companies Inc.
- Business Description
- Product Portfolio
- Collaborations & Alliances
- Recent Developments
- Financial Details
- Others
- Pembina Pipeline Corporation
- Business Description
- Product Portfolio
- Collaborations & Alliances
- Recent Developments
- Financial Details
- Others
- Keyera Corp.
- Business Description
- Product Portfolio
- Collaborations & Alliances
- Recent Developments
- Financial Details
- Others
- Enbridge Inc.
- Business Description
- Product Portfolio
- Collaborations & Alliances
- Recent Developments
- Financial Details
- Others
- AltaGas Ltd.
- Business Description
- Product Portfolio
- Collaborations & Alliances
- Recent Developments
- Financial Details
- Others
- Chevron Phillips Chemical Company LLC
- Business Description
- Product Portfolio
- Collaborations & Alliances
- Recent Developments
- Financial Details
- Others
- ExxonMobil Corporation
- Business Description
- Product Portfolio
- Collaborations & Alliances
- Recent Developments
- Financial Details
- Others
- Enterprise Products Partners L.P.
- Company Profiles
- Disclaimer
| Segment | Sub-Segment |
|---|---|
| By Source |
|
| By Product Type |
|
| By Transportation Mode |
|
| By Storage Type |
|
| By Application |
|
| By Country |
|
Research Methodology
This study followed a structured approach comprising four key phases to assess the size and scope of the electro-oxidation market. The process began with thorough secondary research to collect data on the target market, related markets, and broader industry context. These findings, along with preliminary assumptions and estimates, were then validated through extensive primary research involving industry experts from across the value chain. To calculate the overall market size, both top-down and bottom-up methodologies were employed. Finally, market segmentation and data triangulation techniques were applied to refine and validate segment-level estimations.
Secondary Research
The secondary research phase involved gathering data from a wide range of credible and published sources. This step helped in identifying industry trends, defining market segmentation, and understanding the market landscape and value chain.
Sources consulted during this phase included:
- Company annual reports, investor presentations, and press releases
- Industry white papers and certified publications
- Trade directories and market-recognized databases
- Articles from authoritative authors and reputable journals
- Gold and silver standard websites
Secondary research was critical in mapping out the industry's value chain and monetary flow, identifying key market segments, understanding regional variations, and tracking significant industry developments.
Other key sources:
- Financial disclosures
- Industry associations and trade bodies
- News outlets and business magazines
- Academic journals and research studies
- Paid industry databases
Primary Research
To validate secondary data and gain deeper market insights, primary research was conducted with key stakeholders across both the supply and demand sides of the market.
On the demand side, participants included decision-makers and influencers from end-user industries—such as CIOs, CTOs, and CSOs—who provided first-hand perspectives on market needs, product usage, and future expectations.
On the supply side, interviews were conducted with manufacturers, industry associations, and institutional participants to gather insights into current offerings, product pipelines, and market challenges.
Primary interviews provided critical inputs such as:
- Market size and revenue data
- Product and service breakdowns
- Market forecasts
- Regional and application-specific trends
Stakeholders consulted included:
- Leading OEM and solution providers
- Channel and distribution partners
- End users across various applications
- Independent consultants and industry specialists
Market Size Estimation and Data Triangulation
- Identifying Key Market Participants (Secondary Research)
- Goal: To identify the major players or companies in the target market. This typically involves using publicly available data sources such as industry reports, market research publications, and financial statements of companies.
- Tools: Reports from firms like Gartner, Forrester, Euromonitor, Statista, IBISWorld, and others. Public financial statements, news articles, and press releases from top market players.
- Extracting Earnings of Key Market Participants
- Goal: To estimate the earnings generated from the product or service being analyzed. This step helps in understanding the revenue potential of each market player in a specific geography.
- Methods: Earnings data can be gathered from:
- Publicly available financial reports (for listed companies).
- Interviews and primary data sources from professionals, such as Directors, VPs, SVPs, etc. This is especially useful for understanding more nuanced, internal data that isn't publicly disclosed.
- Annual reports and investor presentations of key players.
- Data Collation and Development of a Relevant Data Model
- Goal: To collate inputs from both primary and secondary sources into a structured, data-driven model for market estimation. This model will incorporate key market KPIs and any independent variables relevant to the market.
- Key KPIs: These could include:
- Market size, growth rate, and demand drivers.
- Industry-specific metrics like market share, average revenue per customer (ARPC), or average deal size.
- External variables, such as economic growth rates, inflation rates, or commodity prices, that could affect the market.
- Data Modeling: Based on this data, the market forecasts are developed for the next 5 years. A combination of trend analysis, scenario modeling, and statistical regression might be used to generate projections.
- Scenario Analysis
- Goal: To test different assumptions and validate how sensitive the market is to changes in key variables (e.g., market demand, regulatory changes, technological disruptions).
- Types of Scenarios:
- Base Case: Based on current assumptions and historical data.
- Best-Case Scenario: Assuming favorable market conditions, regulatory environments, and technological advancements.
- Worst-Case Scenario: Accounting for adverse factors, such as economic downturns, stricter regulations, or unexpected disruptions.


