Mexico Agricultural Tire Market Report: Trends, Growth and Forecast (2026-2032)
By Equipment Type (Tractors, Combine Harvesters, Others), By Demand Type (OEM, Replacement), By Sales Channel (Direct Sales, Multi Brand Stores & Exclusive Outlets, Online), By Tire Type (Radial, Bias), By Tire Size (Tire Size 1, Tire Size 2, Tire Size 3, Tire Size 4, Tire Size 5), By Price Category (Budget, Economy, Premium) ... Read more
|
Major Players
|
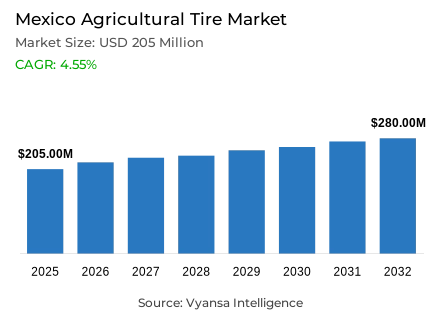
Mexico Agricultural Tire Market Statistics and Insights, 2026
- Market Size Statistics
- Mexico agricultural tire market is estimated at USD 205 million in 2025.
- The market size is expected to grow to USD 280 million by 2032.
- Market to register a cagr of around 4.55% during 2026-32.
- Equipment Type Shares
- Tractors grabbed market share of 80% in terms of units sold.
- Competition
- Mexico agricultural tire market is currently being catered to by more than 25 companies.
- Top 5 companies acquired around 45% of the market share.
- Michelin; Triangle; BKT; Continental; Pirelli etc., are few of the top companies.
- Demand Type
- Replacement grabbed 80% of the market in terms of units sold.
- Faster Growing Tire Size Segment
- 7.50-16 segment to register 3.12% CAGR during 2026-32.
Mexico Agricultural Tire Market Outlook
The Mexico agricultural tire market was valued at USD 0.25 billion in 2025 and is forecast to reach USD 0.28 billion by 2032, equivalent to a CAGR of 4.55%. In 2025 Mexico had an established agricultural machinery base that supports sustained demand for tires, with government and private financing programs aimed at mechanization and equipment renewal. According to Mexico’s machinery statistics, official data and programs relevant to agricultural machinery and equipment are tracked by INEGI, which underpins estimates of mechanization trends.
Public and private investment flows into manufacturing and agriculture-related equipment have been strong, supporting imports of tractors and components and raising demand for replacement tires; the Ministry of Economy reports significant foreign direct investment and private project announcements in recent years.
Mexico relies substantially on imported machinery and parts, which keeps domestic tire demand tied to trade and logistics patterns. For instance, U.S. exports of agricultural equipment to Mexico are a material source of supply.
Agricultural credit and financing lines from institutions such as FIRA support farmer purchases of new equipment and spare parts, which sustains replacement tire volumes and the uptake of higher specification tires.

Mexico Agricultural Tire Market Growth Driver
Infrastructure and Mechanization Lift Replacement Cycles
Investment in rural infrastructure and accelerating mechanization remain the most significant drivers of agricultural tire demand in Mexico. Government credit schemes and modernization incentives have boosted tractor acquisitions and fleet renewals, increasing replacement cycles for popular sizes such as 7.50-16. As tractors and mid-power equipment operate more hours annually, replacement frequency rises, strengthening the aftermarket and creating steady volume growth. International OEM and distributor initiatives that reinforce parts availability and dealer service coverage further amplify this trend.
Expanding infrastructure and agricultural value chain projects stimulate downstream demand for heavy-duty machinery. Support from agricultural development banks and mechanization programs enables farmers to purchase or lease modern equipment fitted with high-specification radial and low-compaction tires. This transition enhances tire utilization efficiency and stabilizes replacement cycles.
Additionally, consolidation among large-scale farms and contracting services promotes structured fleet management and preventive maintenance. Professional operators prioritize uptime and lifecycle cost, driving demand for premium and retreadable tires. Dealers increasingly offer bundled packages covering fitting, maintenance, and retreading, ensuring sustained, structural growth in Mexico’s agricultural replacement tire market.
Mexico Agricultural Tire Market Challenge
Import Dependence and Raw Material Volatility
Mexico’s agricultural tire market remains vulnerable due to its dependence on imported rubber and tire components, exposing supply chains to global price volatility and shipping delays. Minimal domestic rubber production amplifies cost fluctuations, while seasonal peaks in planting and harvest intensify the impact of any supply disruption. Currency depreciation further raises landed costs for importers and distributors.
Limited local retreading and recycling capacity worsens the problem, forcing frequent full replacements and raising system costs for operators. Expanding domestic retread facilities and structured collection networks could help offset import dependence and stabilize pricing. However, until such infrastructure matures, industry players must rely on hedging, inventory management, and flexible sourcing strategies.
Fragmented rural service networks and technician shortages add to operational inefficiencies, extending downtime during tire failures. Strengthening mobile service coverage, dealer density, and technician training will be critical for improving response times, increasing premium tire adoption, and addressing this core structural challenge in Mexico’s agricultural tire ecosystem.
Unlock Market Intelligence
Explore the market potential with our data-driven report
Mexico Agricultural Tire Market Trend
Connected Tires and Predictive Maintenance Adoption
Connected tire systems and telematics are rapidly becoming standard for professional agricultural fleets in Mexico, transforming how tires are monitored and maintained. Sensors embedded in tires track pressure, temperature, and wear in real time, enabling predictive maintenance that reduces downtime and extends service life. Large agricultural operators such as Grupo Trimex and regional contractors in Sinaloa and Jalisco report significant cost savings and fewer emergency replacements after integrating telematics-based monitoring systems. This shift drives demand for premium tires and sensor-equipped retrofit kits supplied by manufacturers like Michelin and Bridgestone’s Fleetcare platform.
Data aggregation from multiple fleets is unlocking new service models including subscription-based monitoring, proactive replacement alerts, and extended warranty programs. Vendors offering analytics dashboards such as Continental’s ContiConnect Live and Trelleborg’s TPMS Smart Wheel System are capturing recurring revenue through digital maintenance services. Integrators that combine telematics with retread programs or financing packages gain an advantage in securing multi-fleet agricultural contracts.
As precision agriculture expands across Mexico, tire performance data is being linked with farm management systems like John Deere Operations Center and AGCO Fuse. This integration reinforces the role of connected tires as both a productivity and sustainability solution, enhancing yields and minimizing soil compaction.
Mexico Agricultural Tire Market Opportunity
Sustainable Compounds and Retread Services for Cost Savings
Sustainable tire compounds and formalized retread and recycling programs present a strong growth opportunity for Mexico’s agricultural tire market. Global transitions toward bio-based rubber and recycled content align well with Mexico’s environmental and circular economy initiatives. Manufacturers such as Michelin and BKT that can validate equivalent field performance with lower life-cycle costs are best positioned to attract large fleet operators seeking both economic and sustainability advantages. Retread programs backed by guaranteed lifecycle savings also create steady recurring revenue for dealers and service centers.
Digital sales and remote support networks are broadening access beyond traditional dealer coverage. E-commerce platforms and regional logistics hubs allow smaller farms to procure premium tire models and schedule maintenance more efficiently. Bundled offerings that integrate monitoring sensors, preventive maintenance, and retread credits strengthen customer loyalty and lower ownership costs.
Collaborations with equipment OEMs and financial institutions further drive adoption. Tire-as-a-service and crop-season financing schemes align payment cycles with farm revenues, easing investment decisions and promoting wider adoption of sustainable tire solutions.
Unlock Market Intelligence
Explore the market potential with our data-driven report
Mexico Agricultural Tire Market Segmentation Analysis
By Equipment Type
- Tractors
- Combine Harvesters
- Others
Tractors account for 80% of agricultural tire demand and remain the structural core of Mexico’s market. It has been estimated that by 2027, more than 110,000 tractors will be replaced underscoring the high replacement frequency that supports a steady aftermarket for common sizes such as 7.50-16. This recurring demand benefits both OEM and independent retread suppliers, shaping dealer stocking and logistics strategies for fast-moving SKUs.
The dominance of tractors is reinforced by crop and mechanization patterns in states such as Sinaloa, Veracruz, and Guanajuato, where medium and high-horsepower tractors are used in row crops, sugarcane, and horticulture. These regions require durable tread designs that resist soil compaction and abrasion. Distributors prioritize radial and specialty tires for these submarkets and maintain regional safety stock to minimize downtime. Large commercial operators favor premium tires and lifecycle-based programs including retreading, monitoring, and service bundles, while small producers opt for bias tires and opportunistic purchases. The segment’s combination of fleet age, workload, and crop seasonality ensures consistent replacement volumes year after year.

By Demand Type
- OEM
- Replacement
The replacement channel constitutes 80% of market demand and is the main source of recurring revenue for manufacturers and distributors. The country operates around 473,000 tractors serving 1.8 million business avenues including agriculture, according to INEGI and the Colegio de Postgraduados (2024).
The requirement for agricultural equipment tires by OEMs in Mexico is driven by the notable presence of OEM manufacturers such as AGCO, John Deere, and others. Owing to the rising agricultural activities, these OEMs are expanding their operations in the country to boost their vehicle production to cater to the demand for agricultural equipment. As a result, the need for tires directly from the OEMs is consistently rising in the country.
In 2024, John Deere’s USD 55 million investment in a new manufacturing facility in Mexico reflects accelerating mechanization and a growing domestic production base for agricultural machinery. This expansion strengthens the country’s agricultural tire demand outlook by boosting OEM supply, equipment localization, and long-term replacement needs.
List of Companies Covered in Mexico Agricultural Tire Market
The companies listed below are highly influential in the Mexico agricultural tire market, with a significant market share and a strong impact on industry developments.
- Michelin
- Triangle
- BKT
- Continental
- Pirelli
- Yokohama
- Bridgestone
- Yokohama
- Double Coin Tires
- Zhongce Rubber Group
Recent Developments
- Bridgestone, 2025:
New designs aim to improve traction and reduce soil compaction for intensive crop operations.
- Michelin, 2025:
Compounds optimized for warm climates and clay soils are targeted at the Mexican market.
- BKT, 2024:
The center speeds deliveries and technical support for agricultural tires bound for Mexico.
- Continental, 2024:
Telematics integration targets improved fleet uptime and fewer unplanned replacements.
Frequently Asked Questions
Related Report
- Market Segmentation
- Research Scope
- Research Methodology
- Definitions and Assumptions
- Executive Summary
- Mexico Agricultural Tire Import & Export Statistics
- Mexico Agricultural Tire Market Supply Chain Analysis
- Mexico Agricultural Tire Hotspot and Opportunities
- Mexico Agricultural Tire Market Policies, Regulations, and Standards
- Mexico Agricultural Tire Market Dynamics
- Growth Factors
- Challenges
- Trends
- Opportunities
- Mexico Agricultural Tire Market Statistics, 2022-2032F
- Market Size & Growth Outlook
- By Revenues in USD Million
- By Units Sold (Thousand Units)
- Market Segmentation & Growth Outlook
- By Equipment Type
- Tractors- Tire Sales & Forecast 2022-2032, USD Million in Thousand Units
- Combine Harvesters- Tire Sales & Forecast 2022-2032, USD Million in Thousand Units
- Others- Tire Sales & Forecast 2022-2032, USD Million in Thousand Units
- By Demand Type
- OEM- Tire Sales & Forecast 2022-2032, USD Million in Thousand Units
- Aftermarket- Tire Sales & Forecast 2022-2032, USD Million in Thousand Units
- By Sales Channel
- Direct Sales- Tire Sales & Forecast 2022-2032, USD Million in Thousand Units
- Multi Brand Stores & Exclusive Outlets- Tire Sales & Forecast 2022-2032, USD Million in Thousand Units
- Online- Tire Sales & Forecast 2022-2032, USD Million in Thousand Units
- By Tire Type
- Radial- Tire Sales & Forecast 2022-2032, USD Million in Thousand Units
- Bias- Tire Sales & Forecast 2022-2032, USD Million in Thousand Units
- By Tire Size
- Tire Size 1- Tire Sales & Forecast 2022-2032, USD Million in Thousand Units
- Tire Size 2- Tire Sales & Forecast 2022-2032, USD Million in Thousand Units
- Tire Size 3- Tire Sales & Forecast 2022-2032, USD Million in Thousand Units
- Tire Size 4- Tire Sales & Forecast 2022-2032, USD Million in Thousand Units
- Tire Size 5- Tire Sales & Forecast 2022-2032, USD Million in Thousand Units
- By Price Category
- Budget- Tire Sales & Forecast 2022-2032, USD Million in Thousand Units
- Economy- Tire Sales & Forecast 2022-2032, USD Million in Thousand Units
- Premium- Tire Sales & Forecast 2022-2032, USD Million in Thousand Units
- By Competitors
- Competition Characteristics
- Market Share & Analysis
- By Equipment Type
- Market Size & Growth Outlook
- Mexico Tractors Tire Market Statistics, 2022-2032
- Market Size & Growth Outlook
- By Revenues in USD Million
- By Units Sold (Thousand Units)
- Market Segmentation & Growth Outlook
- By Demand Type- Tire Sales & Forecast 2022-2032, USD Million in Thousand Units
- By Sales Channel- Tire Sales & Forecast 2022-2032, USD Million in Thousand Units
- By Tire Type- Tire Sales & Forecast 2022-2032, USD Million in Thousand Units
- By Tire Size- Tire Sales & Forecast 2022-2032, USD Million in Thousand Units
- By Price Category- Tire Sales & Forecast 2022-2032, USD Million in Thousand Units
- Market Size & Growth Outlook
- Mexico Combine Harvesters Tire Market Statistics, 2022-2032
- Market Size & Growth Outlook
- By Revenues in USD Million
- By Units Sold (Thousand Units)
- Market Segmentation & Growth Outlook
- By Demand Type- Tire Sales & Forecast 2022-2032, USD Million in Thousand Units
- By Sales Channel- Tire Sales & Forecast 2022-2032, USD Million in Thousand Units
- By Tire Type- Tire Sales & Forecast 2022-2032, USD Million in Thousand Units
- By Tire Size- Tire Sales & Forecast 2022-2032, USD Million in Thousand Units
- By Price Category- Tire Sales & Forecast 2022-2032, USD Million in Thousand Units
- Market Size & Growth Outlook
- Competitive Outlook
- Company Profiles
- Michelin
- Business Description
- Product Portfolio
- Collaborations & Alliances
- Recent Developments
- Financial Details
- Others
- Pirelli
- Business Description
- Product Portfolio
- Collaborations & Alliances
- Recent Developments
- Financial Details
- Others
- Triangle
- Business Description
- Product Portfolio
- Collaborations & Alliances
- Recent Developments
- Financial Details
- Others
- Bridgestone
- Business Description
- Product Portfolio
- Collaborations & Alliances
- Recent Developments
- Financial Details
- Others
- BKT
- Business Description
- Product Portfolio
- Collaborations & Alliances
- Recent Developments
- Financial Details
- Others
- Yokohama
- Business Description
- Product Portfolio
- Collaborations & Alliances
- Recent Developments
- Financial Details
- Others
- Continental
- Business Description
- Product Portfolio
- Collaborations & Alliances
- Recent Developments
- Financial Details
- Others
- Double Coin Tires
- Business Description
- Product Portfolio
- Collaborations & Alliances
- Recent Developments
- Financial Details
- Others
- Zhongce Rubber Group
- Business Description
- Product Portfolio
- Collaborations & Alliances
- Recent Developments
- Financial Details
- Others
- Company 10
- Business Description
- Product Portfolio
- Collaborations & Alliances
- Recent Developments
- Financial Details
- Others
- Michelin
- Company Profiles
- Disclaimer
| Segment | Sub-Segment |
|---|---|
| By Equipment Type |
|
| By Demand Type |
|
| By Sales Channel |
|
| By Tire Type |
|
| By Tire Size |
|
| By Price Category |
|
Research Methodology
This study followed a structured approach comprising four key phases to assess the size and scope of the electro-oxidation market. The process began with thorough secondary research to collect data on the target market, related markets, and broader industry context. These findings, along with preliminary assumptions and estimates, were then validated through extensive primary research involving industry experts from across the value chain. To calculate the overall market size, both top-down and bottom-up methodologies were employed. Finally, market segmentation and data triangulation techniques were applied to refine and validate segment-level estimations.
Secondary Research
The secondary research phase involved gathering data from a wide range of credible and published sources. This step helped in identifying industry trends, defining market segmentation, and understanding the market landscape and value chain.
Sources consulted during this phase included:
- Company annual reports, investor presentations, and press releases
- Industry white papers and certified publications
- Trade directories and market-recognized databases
- Articles from authoritative authors and reputable journals
- Gold and silver standard websites
Secondary research was critical in mapping out the industry's value chain and monetary flow, identifying key market segments, understanding regional variations, and tracking significant industry developments.
Other key sources:
- Financial disclosures
- Industry associations and trade bodies
- News outlets and business magazines
- Academic journals and research studies
- Paid industry databases
Primary Research
To validate secondary data and gain deeper market insights, primary research was conducted with key stakeholders across both the supply and demand sides of the market.
On the demand side, participants included decision-makers and influencers from end-user industries—such as CIOs, CTOs, and CSOs—who provided first-hand perspectives on market needs, product usage, and future expectations.
On the supply side, interviews were conducted with manufacturers, industry associations, and institutional participants to gather insights into current offerings, product pipelines, and market challenges.
Primary interviews provided critical inputs such as:
- Market size and revenue data
- Product and service breakdowns
- Market forecasts
- Regional and application-specific trends
Stakeholders consulted included:
- Leading OEM and solution providers
- Channel and distribution partners
- End users across various applications
- Independent consultants and industry specialists
Market Size Estimation and Data Triangulation
- Identifying Key Market Participants (Secondary Research)
- Goal: To identify the major players or companies in the target market. This typically involves using publicly available data sources such as industry reports, market research publications, and financial statements of companies.
- Tools: Reports from firms like Gartner, Forrester, Euromonitor, Statista, IBISWorld, and others. Public financial statements, news articles, and press releases from top market players.
- Extracting Earnings of Key Market Participants
- Goal: To estimate the earnings generated from the product or service being analyzed. This step helps in understanding the revenue potential of each market player in a specific geography.
- Methods: Earnings data can be gathered from:
- Publicly available financial reports (for listed companies).
- Interviews and primary data sources from professionals, such as Directors, VPs, SVPs, etc. This is especially useful for understanding more nuanced, internal data that isn't publicly disclosed.
- Annual reports and investor presentations of key players.
- Data Collation and Development of a Relevant Data Model
- Goal: To collate inputs from both primary and secondary sources into a structured, data-driven model for market estimation. This model will incorporate key market KPIs and any independent variables relevant to the market.
- Key KPIs: These could include:
- Market size, growth rate, and demand drivers.
- Industry-specific metrics like market share, average revenue per customer (ARPC), or average deal size.
- External variables, such as economic growth rates, inflation rates, or commodity prices, that could affect the market.
- Data Modeling: Based on this data, the market forecasts are developed for the next 5 years. A combination of trend analysis, scenario modeling, and statistical regression might be used to generate projections.
- Scenario Analysis
- Goal: To test different assumptions and validate how sensitive the market is to changes in key variables (e.g., market demand, regulatory changes, technological disruptions).
- Types of Scenarios:
- Base Case: Based on current assumptions and historical data.
- Best-Case Scenario: Assuming favorable market conditions, regulatory environments, and technological advancements.
- Worst-Case Scenario: Accounting for adverse factors, such as economic downturns, stricter regulations, or unexpected disruptions.


