Brazil Off the Road (OTR) Tire Market Report: Trends, Growth and Forecast (2026-2032)
By Equipment Type (Earthmoving Equipment (Excavator, Grader, Loader, Bulldozer, Road Roller, Others), Material Handling Equipment (Forklifts, Cranes), Agriculture Equipment (Tractor, Grain Harvester, Others)), By Demand Type (OEM, Aftermarket), By Sales Channel (Direct Sales, Multi Brand Stores & Exclusive Outlets, Online), By Tire Type (Radial, Bias), By Tire Size (Tire Size 1, Tire Size 2, Tire Size 3, Tire Size 4, Tire Size 5), By Price Category (Budget, Economy, Premium), By Region (North (Pará, Amazonas, Rondônia, Others), Northeast (Ceará, Pernambuco, Bahia, Maranhão, Others), Southeast (São Paulo, Minas Gerais, Others), South (Paraná, Rio Grande do Sul, Others), Center-West (Mato Grosso, Goiás, Others)) ... Read more
|
Major Players
|
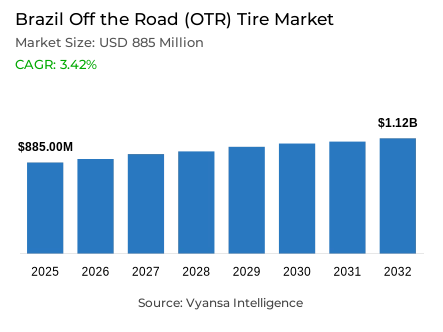
Brazil Off the Road (OTR) Tire Market Statistics and Insights, 2026
- Market Size Statistics
- Brazil off the road (OTR) tire market is estimated at USD 885 million in 2025.
- The market size is expected to grow to USD 1.12 billion by 2032.
- Market to register a cagr of around 3.42% during 2026-32.
- Equipment Type Shares
- Agricultural Tire grabbed market share of 80% in terms of units sold.
- Competition
- Brazil off the road (OTR) tire market is currently being catered to by more than 25 companies.
- Top 5 companies acquired around 75% of the market share.
- Triangle; Bridgestone; BKT; Titan; Continental etc., are few of the top companies.
- Demand Type
- Aftermarket grabbed 60% of the market in terms of units sold.
- Faster Growing End User Segment
- Tractor segment to register 5.11% CAGR during 2026-32.
Brazil Off the Road (OTR) Tire Market Outlook
The expansion of mechanization in agriculture and construction sectors, besides domestic and international demand for high-performance machinery, drives the Brazil Off the Road Tire Market. Domestic sales of construction machinery were estimated at 23,846 units in 2025, with hydraulic excavators at 7,528 units, backhoe loaders at 7,194 units, and wheel loaders at 3,903 units. Sales of agricultural machinery reached 35,882 units, of which wheel tractors accounted for 33,911 units and grain harvesters made up 1,971 units. Exports, according to Associação Brasileira da Indústria de Máquinas e Equipamentos, will further contribute to 11,133 units of construction machines and 3,935 units of agricultural machines projected for 2025.
The increasing adoption of radial tires for agriculture and construction equipment underpins market growth. Radial designs offer many advantages over the other types, such as higher load-carrying capacities, durability, reduced soil compaction, and increased tire life. OEM partnerships with key manufacturers such as John Deere, Massey Ferguson, New Holland, and Case reinforce the value of optimized tire solutions integrated into new equipment.
Government support in the form of rural credit programs, BNDES financing, and World Bank initiatives is aiding the purchase of modern machinery, thereby supplementing OEM demand as well as aftermarket tire sales. Modernization of fleets, including high-capacity tractors, harvesters, and hydraulic excavators, continues to raise the on-field intensity, which in turn is driving replacement cycles. Retreading programs that extend tire life by 25‑40% further support market growth.
The export-oriented approach to the Brazil OTR tire market makes for good business, where radial and bias tires are also shipped out with agricultural and construction machinery. International demand is further reinforced as such. Investments also are going toward localized production, R&D, and service networks to help strengthen aftermarket presence and optimize supply chains.
 tire market competitive analysis")
Brazil Off the Road (OTR) Tire Market Growth Driver
Mechanization of Agriculture Drives Tire Demand
Growth in agricultural mechanization in Brazil is the major driving force in the OTR tires market. The large farming operations in central-west, southern, and southeastern parts of the country are extensively using wheel tractors and grain harvesters. In 2025, overall wholesale sales of agricultural machines in Brazil are expected to be 35,882 units, comprising 33,911 wheel tractors and 1,971 grain harvesters. Moreover, agricultural machines around 3,935 units are expected to be exported in 2025. The financial aid provided through BNDES, World Bank initiatives, and agricultural credit facilities allows agricultural producers access to modern high-capacity agricultural machines that require high-quality tires in huge numbers.
Radial and bias tires with high performance features have recently gained popularity for their longer life, increased carrying capability, and lower soil compaction. Radial tires also help farmers extend the service life by 25-40%, which helps in improving the efficiency of farming. Specialists in manufacturing these tires include Titan, BKT, and Michelin, who have invested in their production in Brazil.
Construction mechanization is another requirement driving tire sales, and the projected home market for construction machinery in 2025 is 23,846 units, comprising excavators, backhoe, and wheel loaders. Construction machinery exports will be projected at 11,133 units. The use of larger, more modern equipment, as well as financing policies, all combined ensure that the market for OTR tires grows in the Brazil market through 2032.
Brazil Off the Road (OTR) Tire Market Challenge
Volatility in Raw Material Prices of OTR Tires
Raw‑material volatility presents a major challenge for the OTR tire sector in Brazil in 2025, affecting key inputs like natural rubber and synthetic elastomers. Global natural rubber production is projected to rise by only 0.3% in 2025 (to 14.9 million tons) while demand is estimated to grow by 1.8% (to 15.6 million tons), resulting in a supply shortfall that keeps prices elevated.
In Brazil, natural‑rubber import prices stood at US$1,889 per ton in April 2025, up 7.8% from the previous month, and well above the historic average of about US$1,667/MT. Synthetic rubber prices in Brazil also reflect this instability: in Q1 2025 synthetic rubber was around US$2,690/MT, reflecting pressures from feedstock cost spikes, currency movements and import dependence.
These price swings ripple into tire‑manufacturing cost structures, raw materials often account for ~60‑70% of production cost in tires, and a high proportion is natural or synthetic rubber. For OTR tire manufacturers servicing Brazil’s agricultural and construction machinery fleets, this means elevated and unpredictable input costs, compression of margins if repositioning prices is difficult, and risk of supply disruptions from weather‑ or trade‑driven raw‑material shortfalls.
Unlock Market Intelligence
Explore the market potential with our data-driven report
Brazil Off the Road (OTR) Tire Market Opportunity
Expansion of Aftermarket Services
The aftermarket segment presents a key growth opportunity in Brazil’s OTR tire market. Frequent replacement cycles for high-use agricultural and construction machinery drive steady tire demand. In 2025, domestic sales of wheel tractors and hydraulic excavators alone surpass 41,000 units, underscoring ongoing need for durable tires. Expanding tire replacement, retreading, and maintenance services can help companies capture this recurring business. Retreading extends tire life by up to 40%, offering cost savings for operators and additional revenue for manufacturers.
Leading tire brands such as Pirelli, Michelin, Titan, and BKT are developing mobile maintenance units and service networks in Brazil’s central-west and southern agricultural regions. These initiatives provide timely replacements in remote areas, reducing downtime and improving customer satisfaction. OEM collaborations with equipment makers like John Deere, Massey Ferguson, and New Holland further embed tires into equipment lifecycle management, boosting aftermarket demand.
The growing adoption of radial tires, favored for durability and load capacity, expands aftermarket potential domestically and for exported machinery. With 3,935 agricultural machines expected for export in 2025, aftermarket services also support international customers. Government incentives and financing programs enable operators to invest in premium tires and maintenance, ensuring steady aftermarket growth through 2032. Strengthening service networks and retreading programs will enhance revenues and customer loyalty in this vital segment.
Unlock Market Intelligence
Explore the market potential with our data-driven report
Brazil Off the Road (OTR) Tire Market Segmentation Analysis
By Equipment Type
- Earthmoving Equipment
- Excavator
- Grader
- Loader
- Bulldozer
- Road Roller
- Others
- Material Handling Equipment
- Forklifts
- Cranes
- Agriculture Equipment
- Tractor
- Grain Harvester
- Others
Agriculture equipment tires dominate Brazil’s off-the-road (OTR) tire market with an 80% share, driven by the country’s vast farming sector and increasing mechanization. In 2025, Brazil’s domestic wholesale sales include 33,911 wheel tractors and 1,971 grain harvesters, alongside exports of 3,935 units (SECEX). These machines require high-capacity radial and bias tires designed to handle heavy loads and long operational hours.
Leading manufacturers like Titan, BKT, and Michelin produce tires tailored to different soil types, crops, and regional needs. Radial tires are favored for their durability, enhanced traction, and reduced soil compaction, key factors for efficiency and sustainability. Retreading programs boost tire lifespan by 25–40%, supporting strong aftermarket sales.
Government financing through programs like BNDES and World Bank rural credit helps farmers modernize machinery fleets, sustaining demand for OTR tires. Partnerships with OEMs such as John Deere, Massey Ferguson, and New Holland embed tire solutions within equipment lifecycles, promoting both OEM and aftermarket sales. Emphasis on precision agriculture and mechanization keeps tire replacement frequent. Advanced radial designs cut downtime, improve fuel efficiency, and meet performance demands, solidifying agriculture equipment tires as Brazil’s leading OTR segment through 2032.
 tire market segmentation overview")
By Demand Type
- OEM
- Aftermarket
The aftermarket segment is dominant with 60% share of the total OTR tire units sold in Brazil, it is due to the recurring replacement cycle brought on by high utilisations of crop machinery and building machinery. Domestic sales of tractors, harvesters, and construction machinery achieve more than 59,700 units in 2025, driving decent demand for replacement tires. Market leaders include Pirelli, Michelin, Titan, and BKT, large companies which have considerable investments in a service network and mobile maintenance units to reach the remotest sites to manage efficient replacements and minimize losses related to unproductive assets.
Radial tires maintain the largest share in the aftermarket, considering their reliability, high load-carrying capacity, and acceptance of retreading programs that can increase the life of a tire by as much as 40%. Such programs bring major cost savings to operators and continued revenue for the manufacturer. OEM partnerships integrate tire maintenance into equipment lifecycle management, further bolstering aftermarket growth.
Exports of farm and construction machinery, reaching 15,068 units in 2025, create further international aftermarket opportunities. Radial tires become imperative for better machinery performance across diverse work sites both at home and abroad. The provision of maintenance contracts, retreading, and logistical support by manufacturers further helps ensure customer loyalty. Incentives from the government for fleet modernization and easy financing improve the pace of aftermarket demand. With fleet size increasing and the intensity of its use, aftermarket services are becoming crucial to operational efficiency. This combination of expanding services, adoption of retreading, and mechanization will continue to ensure that the aftermarket is the largest and fastest-growing OTR tire subsegment in Brazil through 2032.
List of Companies Covered in Brazil Off the Road (OTR) Tire Market
The companies listed below are highly influential in the Brazil off the road (OTR) tire market, with a significant market share and a strong impact on industry developments.
- Triangle
- Bridgestone
- BKT
- Titan
- Continental
- Michelin
- Yokohama
- Pirelli
Recent Developments
- Titan, 2025:
Titan announced an agreement to acquire a 20% stake in Rodaros Industria De Rodas Ltda for USD 4 million. Rodaros is Brazil's second-largest agricultural wheel manufacturer. The acquisition supports Titan's "one-stop-shop" strategy of providing both tires and wheels to its customers.
- Michelin, 2025:
Michelin introduced reinforced radial tires for tractors and harvesters, optimized for Brazil’s central-west soil conditions, enhancing durability and reducing replacement frequency.
- BKT, 2025:
BKT established mobile tire maintenance units across southern Brazil to support agricultural machinery operators in remote regions, ensuring timely replacements and reducing operational downtime.
- Pirelli, 2025:
Pirelli formed partnerships with John Deere and New Holland to integrate specialized radial tires into new equipment shipments, enhancing performance and after-sales support.
- Yokohama, 2025:
Yokohama invested USD 15 Million in R&D for advanced OTR tires in Brazil, focusing on optimizing load-bearing capacity, durability, and suitability for both domestic and exported agricultural and construction machinery.
Frequently Asked Questions
Related Report
- Market Segmentation
- Research Scope
- Research Methodology
- Definitions and Assumptions
- Executive Summary
- Brazil Off the Road (OTR) Tire Import & Export Statistics
- Brazil Off the Road (OTR) Tire Market Supply Chain Analysis
- Brazil Off the Road (OTR) Tire Hotspot and Opportunities
- Brazil Off the Road (OTR) Tire Market Policies, Regulations, and Standards
- Brazil Off the Road (OTR) Tire Market Dynamics
- Growth Factors
- Challenges
- Trends
- Opportunities
- Brazil Off the Road (OTR) Tire Market Statistics, 2022-2032F
- Market Size & Growth Outlook
- By Revenues in USD Million
- By Units Sold (Thousand Units)
- Market Segmentation & Growth Outlook
- By Equipment Type
- Earthmoving Equipment- Tire Sales & Forecast 2022-2032, USD Million in Thousand Units
- Excavator- Tire Sales & Forecast 2022-2032, USD Million in Thousand Units
- Grader- Tire Sales & Forecast 2022-2032, USD Million in Thousand Units
- Loader- Tire Sales & Forecast 2022-2032, USD Million in Thousand Units
- Bulldozer- Tire Sales & Forecast 2022-2032, USD Million in Thousand Units
- Road Roller- Tire Sales & Forecast 2022-2032, USD Million in Thousand Units
- Others- Tire Sales & Forecast 2022-2032, USD Million in Thousand Units
- Material Handling Equipment- Tire Sales & Forecast 2022-2032, USD Million in Thousand Units
- Forklifts- Tire Sales & Forecast 2022-2032, USD Million in Thousand Units
- Cranes- Tire Sales & Forecast 2022-2032, USD Million in Thousand Units
- Agriculture Equipment- Tire Sales & Forecast 2022-2032, USD Million in Thousand Units
- Tractor- Tire Sales & Forecast 2022-2032, USD Million in Thousand Units
- Grain Harvester- Tire Sales & Forecast 2022-2032, USD Million in Thousand Units
- Others- Tire Sales & Forecast 2022-2032, USD Million in Thousand Units
- Earthmoving Equipment- Tire Sales & Forecast 2022-2032, USD Million in Thousand Units
- By Demand Type
- OEM- Tire Sales & Forecast 2022-2032, USD Million in Thousand Units
- Aftermarket- Tire Sales & Forecast 2022-2032, USD Million in Thousand Units
- By Sales Channel
- Direct Sales- Tire Sales & Forecast 2022-2032, USD Million in Thousand Units
- Multi Brand Stores & Exclusive Outlets- Tire Sales & Forecast 2022-2032, USD Million in Thousand Units
- Online- Tire Sales & Forecast 2022-2032, USD Million in Thousand Units
- By Tire Type
- Radial- Tire Sales & Forecast 2022-2032, USD Million in Thousand Units
- Bias- Tire Sales & Forecast 2022-2032, USD Million in Thousand Units
- By Tire Size
- Tire Size 1- Tire Sales & Forecast 2022-2032, USD Million in Thousand Units
- Tire Size 2- Tire Sales & Forecast 2022-2032, USD Million in Thousand Units
- Tire Size 3- Tire Sales & Forecast 2022-2032, USD Million in Thousand Units
- Tire Size 4- Tire Sales & Forecast 2022-2032, USD Million in Thousand Units
- Tire Size 5- Tire Sales & Forecast 2022-2032, USD Million in Thousand Units
- By Price Category
- Budget- Tire Sales & Forecast 2022-2032, USD Million in Thousand Units
- Economy- Tire Sales & Forecast 2022-2032, USD Million in Thousand Units
- Premium- Tire Sales & Forecast 2022-2032, USD Million in Thousand Units
- By Region
- North
- Pará
- Amazonas
- Rondônia
- Others
- Northeast
- Ceará
- Pernambuco
- Bahia
- Maranhão
- Others
- Southeast
- São Paulo
- Minas Gerais
- Others
- South
- Paraná
- Rio Grande do Sul
- Others
- Center-West
- Mato Grosso
- Goiás
- Others
- North
- By Competitors
- Competition Characteristics
- Market Share & Analysis
- By Equipment Type
- Market Size & Growth Outlook
- Brazil Earthmoving Equipment Tire Market Statistics, 2022-2032
- Market Size & Growth Outlook
- By Revenues in USD Million
- By Units Sold (Thousand Units)
- Market Segmentation & Growth Outlook
- By Equipment Type- Tire Sales & Forecast 2022-2032, USD Million in Thousand Units
- By Demand Type- Tire Sales & Forecast 2022-2032, USD Million in Thousand Units
- By Sales Channel- Tire Sales & Forecast 2022-2032, USD Million in Thousand Units
- By Tire Type- Tire Sales & Forecast 2022-2032, USD Million in Thousand Units
- By Tire Size- Tire Sales & Forecast 2022-2032, USD Million in Thousand Units
- By Price Category- Tire Sales & Forecast 2022-2032, USD Million in Thousand Units
- By Region- Tire Sales & Forecast 2022-2032, USD Million in Thousand Units
- Market Size & Growth Outlook
- Brazil Material Handling Equipment Tire Market Statistics, 2022-2032
- Market Size & Growth Outlook
- By Revenues in USD Million
- By Units Sold (Thousand Units)
- Market Segmentation & Growth Outlook
- By Equipment Type- Tire Sales & Forecast 2022-2032, USD Million in Thousand Units
- By Demand Type- Tire Sales & Forecast 2022-2032, USD Million in Thousand Units
- By Sales Channel- Tire Sales & Forecast 2022-2032, USD Million in Thousand Units
- By Tire Type- Tire Sales & Forecast 2022-2032, USD Million in Thousand Units
- By Tire Size- Tire Sales & Forecast 2022-2032, USD Million in Thousand Units
- By Price Category- Tire Sales & Forecast 2022-2032, USD Million in Thousand Units
- By Region- Tire Sales & Forecast 2022-2032, USD Million in Thousand Units
- Market Size & Growth Outlook
- Brazil Agriculture Equipment Tire Market Statistics, 2022-2032
- Market Size & Growth Outlook
- By Revenues in USD Million
- By Units Sold (Thousand Units)
- Market Segmentation & Growth Outlook
- By Equipment Type- Tire Sales & Forecast 2022-2032, USD Million in Thousand Units
- By Demand Type- Tire Sales & Forecast 2022-2032, USD Million in Thousand Units
- By Sales Channel- Tire Sales & Forecast 2022-2032, USD Million in Thousand Units
- By Tire Type- Tire Sales & Forecast 2022-2032, USD Million in Thousand Units
- By Tire Size- Tire Sales & Forecast 2022-2032, USD Million in Thousand Units
- By Price Category- Tire Sales & Forecast 2022-2032, USD Million in Thousand Units
- By Region- Tire Sales & Forecast 2022-2032, USD Million in Thousand Units
- Market Size & Growth Outlook
- Competitive Outlook
- Company Profiles
- Yokohama
- Business Description
- Product Portfolio
- Collaborations & Alliances
- Recent Developments
- Financial Details
- Others
- Pirelli
- Business Description
- Product Portfolio
- Collaborations & Alliances
- Recent Developments
- Financial Details
- Others
- Titan
- Business Description
- Product Portfolio
- Collaborations & Alliances
- Recent Developments
- Financial Details
- Others
- Continental
- Business Description
- Product Portfolio
- Collaborations & Alliances
- Recent Developments
- Financial Details
- Others
- Michelin
- Business Description
- Product Portfolio
- Collaborations & Alliances
- Recent Developments
- Financial Details
- Others
- Triangle
- Business Description
- Product Portfolio
- Collaborations & Alliances
- Recent Developments
- Financial Details
- Others
- Bridgestone
- Business Description
- Product Portfolio
- Collaborations & Alliances
- Recent Developments
- Financial Details
- Others
- BKT
- Business Description
- Product Portfolio
- Collaborations & Alliances
- Recent Developments
- Financial Details
- Others
- Company 9
- Business Description
- Product Portfolio
- Collaborations & Alliances
- Recent Developments
- Financial Details
- Others
- Company 10
- Business Description
- Product Portfolio
- Collaborations & Alliances
- Recent Developments
- Financial Details
- Others
- Yokohama
- Company Profiles
- Disclaimer
| Segment | Sub-Segment |
|---|---|
| By Equipment Type |
|
| By Demand Type |
|
| By Sales Channel |
|
| By Tire Type |
|
| By Tire Size |
|
| By Price Category |
|
| By Region |
|
Research Methodology
This study followed a structured approach comprising four key phases to assess the size and scope of the electro-oxidation market. The process began with thorough secondary research to collect data on the target market, related markets, and broader industry context. These findings, along with preliminary assumptions and estimates, were then validated through extensive primary research involving industry experts from across the value chain. To calculate the overall market size, both top-down and bottom-up methodologies were employed. Finally, market segmentation and data triangulation techniques were applied to refine and validate segment-level estimations.
Secondary Research
The secondary research phase involved gathering data from a wide range of credible and published sources. This step helped in identifying industry trends, defining market segmentation, and understanding the market landscape and value chain.
Sources consulted during this phase included:
- Company annual reports, investor presentations, and press releases
- Industry white papers and certified publications
- Trade directories and market-recognized databases
- Articles from authoritative authors and reputable journals
- Gold and silver standard websites
Secondary research was critical in mapping out the industry's value chain and monetary flow, identifying key market segments, understanding regional variations, and tracking significant industry developments.
Other key sources:
- Financial disclosures
- Industry associations and trade bodies
- News outlets and business magazines
- Academic journals and research studies
- Paid industry databases
Primary Research
To validate secondary data and gain deeper market insights, primary research was conducted with key stakeholders across both the supply and demand sides of the market.
On the demand side, participants included decision-makers and influencers from end-user industries—such as CIOs, CTOs, and CSOs—who provided first-hand perspectives on market needs, product usage, and future expectations.
On the supply side, interviews were conducted with manufacturers, industry associations, and institutional participants to gather insights into current offerings, product pipelines, and market challenges.
Primary interviews provided critical inputs such as:
- Market size and revenue data
- Product and service breakdowns
- Market forecasts
- Regional and application-specific trends
Stakeholders consulted included:
- Leading OEM and solution providers
- Channel and distribution partners
- End users across various applications
- Independent consultants and industry specialists
Market Size Estimation and Data Triangulation
- Identifying Key Market Participants (Secondary Research)
- Goal: To identify the major players or companies in the target market. This typically involves using publicly available data sources such as industry reports, market research publications, and financial statements of companies.
- Tools: Reports from firms like Gartner, Forrester, Euromonitor, Statista, IBISWorld, and others. Public financial statements, news articles, and press releases from top market players.
- Extracting Earnings of Key Market Participants
- Goal: To estimate the earnings generated from the product or service being analyzed. This step helps in understanding the revenue potential of each market player in a specific geography.
- Methods: Earnings data can be gathered from:
- Publicly available financial reports (for listed companies).
- Interviews and primary data sources from professionals, such as Directors, VPs, SVPs, etc. This is especially useful for understanding more nuanced, internal data that isn't publicly disclosed.
- Annual reports and investor presentations of key players.
- Data Collation and Development of a Relevant Data Model
- Goal: To collate inputs from both primary and secondary sources into a structured, data-driven model for market estimation. This model will incorporate key market KPIs and any independent variables relevant to the market.
- Key KPIs: These could include:
- Market size, growth rate, and demand drivers.
- Industry-specific metrics like market share, average revenue per customer (ARPC), or average deal size.
- External variables, such as economic growth rates, inflation rates, or commodity prices, that could affect the market.
- Data Modeling: Based on this data, the market forecasts are developed for the next 5 years. A combination of trend analysis, scenario modeling, and statistical regression might be used to generate projections.
- Scenario Analysis
- Goal: To test different assumptions and validate how sensitive the market is to changes in key variables (e.g., market demand, regulatory changes, technological disruptions).
- Types of Scenarios:
- Base Case: Based on current assumptions and historical data.
- Best-Case Scenario: Assuming favorable market conditions, regulatory environments, and technological advancements.
- Worst-Case Scenario: Accounting for adverse factors, such as economic downturns, stricter regulations, or unexpected disruptions.


