Global Lithium Hydroxide Market Report: Trends, Growth and Forecast (2026-2032)
By Purity (55%, 99%, 99.3%), By Form (Monohydrate, Anhydrous), By Packaging (Bottles, Bags), By Application (Li-ion Batteries (Electric Vehicles (EVs), Portable Electronics, Grid Energy Storage Systems (ESS)), Greases & Lubricants, Glass & Ceramics, CO2 Scrubbers, Others), By End-Use Industry (Automotive, Electronics, Energy Storage, Industrial (Aerospace, Pharma, etc.)), By Region (North America, Latin America, Europe, Asia-Pacific) ... Read more
|
Major Players
|
Global Lithium Hydroxide Market Statistics and Insights, 2026
- Market Size Statistics
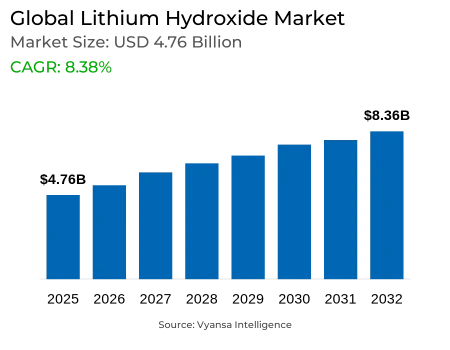
- Global Lithium Hydroxide Market is estimated at $ 4.76 Billion.
- The market size is expected to grow to $ 8.36 Billion by 2032.
- Market to register a CAGR of around 8.38% during 2026-32.
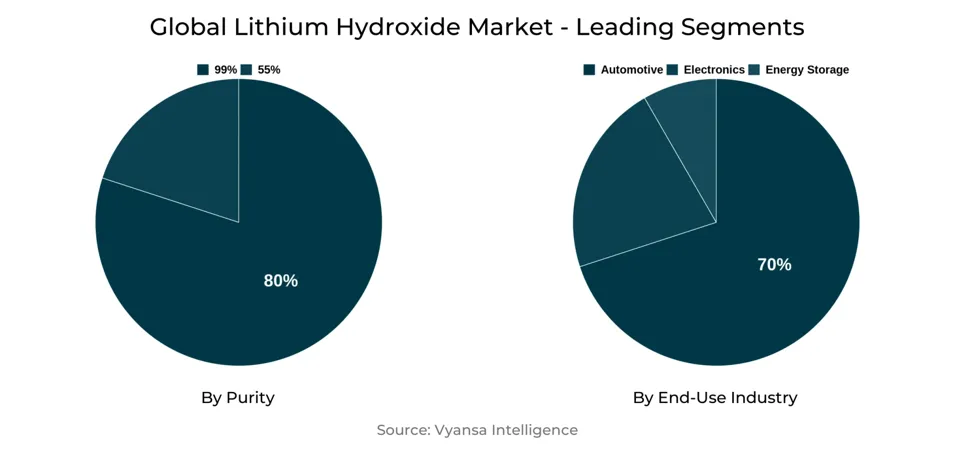
- Purity Shares
- 99% grabbed market share of 80%.
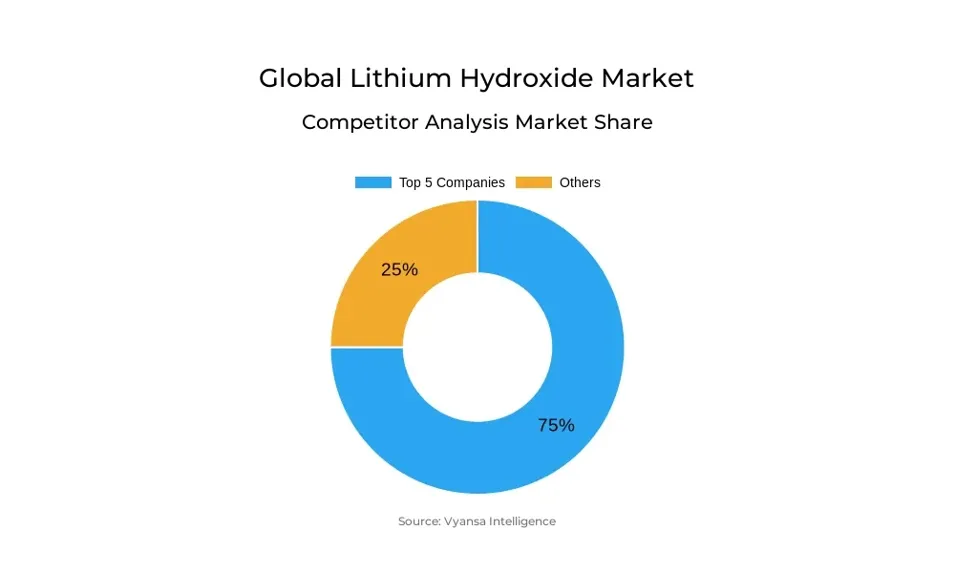
- Competition
- More than 30 companies are actively engaged in producing Lithium Hydroxide.
- Top 5 companies acquired 75% of the market share.
- Lithium Americas, Mineral Resources, Pilbara Minerals, Albemarle Corporation, Ganfeng Lithium etc., are few of the top companies.
- End‑Use Industry
- Automotive grabbed 70% of the market.
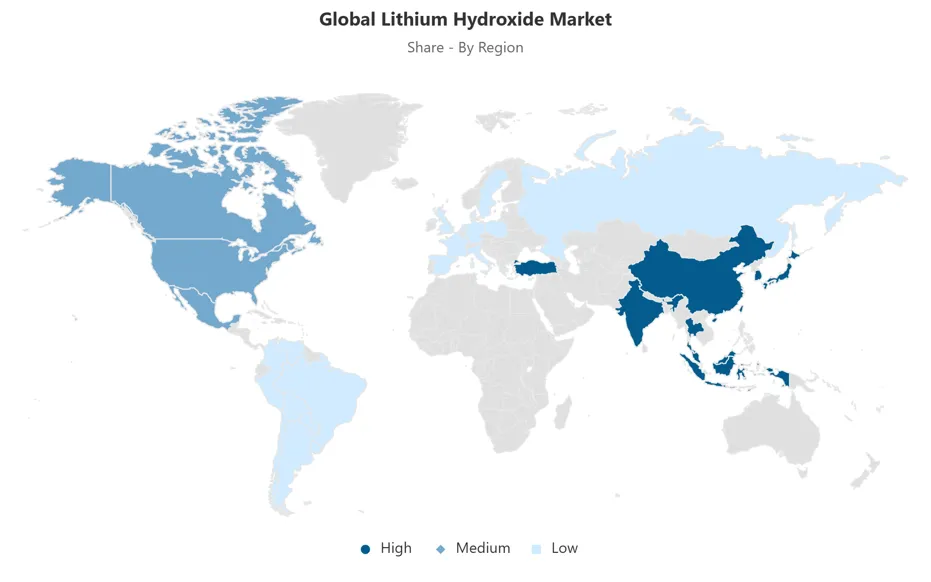
- Region
- Asia-Pacific leads with a 60% share of the Global Market.
Global Lithium Hydroxide Market Outlook
The Global Lithium Hydroxide Market is estimated at $4.76 billion in 2025 and is estimated to grow to $8.36 billion by 2032, spurred by intensifying electric vehicle (EV) uptake and rising demand for high-purity battery materials. With OEMs increasingly deploying high-nickel cathode chemistries, lithium hydroxide has become a necessity to enable greater energy densities, efficiency, and safety in EV batteries. In 2024, more than 68% of lithium hydroxide output worldwide was dedicated to battery-grade use, indicating the indispensable role of high-purity materials in energizing the future of electric mobility solutions.
Environmental and regulatory pressures are dictating market forces, especially where lithium mining puts a burden on water supplies. It takes about 2.2 million liters of water to produce a ton of lithium hydroxide, creating sustainability issues in locations such as Chile's Salar de Atacama. Furthermore, project approvals and permitting procedures are taking longer, with some projects postponed or terminated because of litigation or civic opposition. Such restrictions could limit supply growth even as end-user demand keeps accelerating.
Recycling of spent EV batteries is becoming an important growth driver with the existing global capacity standing at 1.6 million tons and expected to surpass 3 million tons soon. Technological innovation is increasing efficiencies of recovery of lithium, cobalt, and nickel, supporting sustainability objectives and decreasing dependence on virgin materials. Direct recycling technologies also maintain cathode structures, assisting in reducing processing costs and aiding circular economy programs.
Asia-Pacific leads the market with a 60% share due to China's integrated supply chain, solid manufacturing ecosystem, and excellent export performance. The automobile industry is still the largest end-use application, at about 70% of global consumption, followed by energy storage and electronics. With governments pouring significant investments into domestic lithium processing and producers gaining long-term procurement deals, the Global Lithium Hydroxide Market is on track for consistent growth up to 2032.
Global Lithium Hydroxide Market Growth Driver
Driving electric vehicle adoption is transforming worldwide demand for lithium hydroxide, with battery makers needing high-purity material to accommodate advanced cathode chemistries. Lithium-ion battery manufacturing in the first half of 2024 reached more than 480 GWh, a 20% year-over-year increase, according to China's Ministry of Industry and Information Technology. Total EV sales are expected to reach more than 20 million units in 2025 and over one-quarter of new car sales globally. This quick growth has fueled the demand for stable, high-quality lithium hydroxide supply chains.
Battery manufacturers are increasingly using high-nickel cathode chemistries like NMC and NCA, which use lithium hydroxide to ensure improved performance and thermal stability. More than 68% of the world's lithium hydroxide production went to battery-grade uses, specifically for EVs, in 2024. This shift underscores lithium hydroxide’s critical role in enabling higher energy densities, improved efficiency, and greater safety in electric mobility solutions across leading automotive industry.
Global Lithium Hydroxide Market Challenge
Extraction of lithium also remains under major environmental oversight, especially in areas with limited water supplies. It takes about 2.2 million liters of water to produce a ton of lithium hydroxide, stressing up ecosystems in places like Chile's Salar de Atacama. The operations there use about 21 million liters of water every day, accounting for 65% of the country's available water supply. This heavy usage has intensified pushback from communities and further raised concerns over long-term environmental sustainability.
Regulatory systems are also becoming more stringent, leading to project delays and higher development expenses. In 2023, over 22 lithium projects globally encountered legal opposition or community demonstrations, while Serbia canceled a large project that would have contributed 40,000 metric tons per year. In the US, the permitting process for lithium plants now takes an average of 3.7 years, mirroring increased complexity in approval processes. These forces together threaten to slow supply growth, even as demand from ultimate consumers increases rapidly.
Unlock Market Intelligence
Explore the market potential with our data-driven report
Global Lithium Hydroxide Market Trend
Recycling incorporation is becoming a central component of the worldwide lithium hydroxide market, propelled by the exponential growth of retired EV batteries. Recycling capacity sits at 1.6 million tons per year, with the intention of surpassing 3 million tons in the next few years. China leads the way here, estimated to account for nearly 70% of global capacity owing to its robust EV manufacturing base and sophisticated recycling infrastructure. This increasing infrastructure is providing the opportunity to recover important materials effectively and sustainably.
Technological advances are driving recovery yields to record highs, with state-of-the-art facilities reporting over 95% efficiency for cobalt, copper, and nickel, and over 70% for lithium. Direct recycling techniques, which maintain cathode structures, lower processing expenses and meet circular economy objectives. Recycling a kilogram of lithium batteries cancels 2.7 to 4.6 kg of CO₂ equivalent emissions, directly benefitting automotive OEM decarbonization targets and supporting the long-term sustainability of lithium supply chains.
Global Lithium Hydroxide Market Opportunity
Governments globally are speeding up investment in local lithium processing to minimize dependence on imports and maintain supply chain strength. In the United States, the Department of Energy has pledged $2.8 billion across 20 projects, such as Standard Lithium's $225 million plant in Arkansas and Lithium Americas' Thacker Pass project, which raised $2.26 billion in funding. These projects have the objective of creating the nation's largest lithium operations and increase localized production capacity.
In Europe, both public and private stakeholders are focusing on major breakthroughs in sustainable lithium refining. Germany invested €104 million in Vulcan Energy to assist with green production, while the European Battery Alliance has helped develop at least six refining initiatives in Germany, Finland, and Spain. India also announced a Rs9,000-crore incentive scheme to bolster local processing. Together, these initiatives can provide over 120,000 metric tons of lithium hydroxide capacity by 2028, bolstering global supply strength
Global Lithium Hydroxide Market Regional Analysis
By Region
- North America
- Latin America
- Europe
- Asia-Pacific
Asia-Pacific holds a commanding 60% share of the global lithium hydroxide market, supported by China’s comprehensive supply chain and strong manufacturing ecosystem. China produced approximately 360,000 tons of battery-grade lithium hydroxide in 2024, up 26% from the previous year. Its capacity to integrate raw material extraction, refining, cathode production, and EV assembly cements its position as the global leader. South Korea and Japan supplement this strength with expertise in premium high-nickel cathode chemistries.
China's export performance also serves to underscore regional supremacy. China exported 120,000 tons of lithium hydroxide in 2024, with South Korea importing 70% of the amount and Japan taking 27%. Australia, on the other hand, is pivotal in supplying spodumene concentrate, which feeds regional processing streams. Supportive policies favoring EV adoption, renewable energy integration, and scale battery investments guarantee Asia-Pacific to be in the lead among global market growth through 2032.
Unlock Market Intelligence
Explore the market potential with our data-driven report
Global Lithium Hydroxide Market Segmentation Analysis
By Purity
- 55%
- 99%
In the Global Lithium Hydroxide Market, the 99% purity segment leads with around 80% of battery-grade utilization. This segment is critical for the production of advanced high-nickel cathodes utilized in EVs and energy storage devices, where purity will have a direct influence on performance, thermal stability, and energy density. With its criticality, battery-grade lithium hydroxide carries an important price premium compared to industrial-grade material.
Lower-purity grades, on the other hand, are reserved for matured industrial applications like ceramics, lubricating greases, and chemical processing of specialty chemicals. Although their demand is stable, expansion is comparatively slower than that of battery-related needs. End users in the automotive industry are nudging steady investments in purification technologies since top-of-the-line OEMs and battery firms require consistently high-quality material to support changing performance requirements and mass deployment targets.
By End-Use Industry
- Automotive
- Electronics
- Energy Storage
- Industrial
The automotive industry consumes about 70% of the Global lithium hydroxide market, representing the largest end-use industry segment. Li-ion battery manufacturers of electric vehicles use high-purity lithium hydroxide to support innovative battery chemistries, entering into long-term deals to maintain reliable supply. Tesla, GM, and major Chinese manufacturers have all bolstered procurement relationships, highlighting this material's strategic value to ongoing EV development.
Energy storage solutions are the second-largest application area, where grid-scale deployments totaled over 90 GWh in 2024. Demand within this segment is being driven by integration of renewable energy and grid stabilization efforts. In contrast, the electronics market has consistent needs for smaller-scale applications in smartphones, laptops, and portable devices. Niche markets, such as aerospace and pharmaceuticals, employ specialty formulations, delivering value through performance properties designed to meet specific requirements but contributing smaller overall volumes.
Top Companies in Global Lithium Hydroxide Market
The top companies operating in the market include Lithium Americas, Mineral Resources, Pilbara Minerals, Albemarle Corporation, Ganfeng Lithium, Tianqi Lithium, SQM S.A., Livent, Yahua Industrial Group, Sichuan Energy Investment, Allkem, AMG Lithium, Nemaska Lithium, Arcadium Lithium, Piedmont Lithium, etc., are the top players operating in the Global Lithium Hydroxide Market.
Frequently Asked Questions
Related Report
1. Market Segmentation
1.1. Research Scope
1.2. Research Methodology
1.3. Definitions and Assumptions
2. Executive Summary
3. Global Lithium Hydroxide Market Policies, Regulations, and Standards
4. Global Lithium Hydroxide Market Dynamics
4.1. Growth Factors
4.2. Challenges
4.3. Trends
4.4. Opportunities
5. Global Lithium Hydroxide Market Statistics, 2022-2032F
5.1. Market Size & Growth Outlook
5.1.1.By Revenues in US$ Million
5.2. Market Segmentation & Growth Outlook
5.2.1.By Purity
5.2.1.1. 55%- Market Insights and Forecast 2022-2032, USD Million
5.2.1.2. 99%- Market Insights and Forecast 2022-2032, USD Million
5.2.1.3. 99.3%- Market Insights and Forecast 2022-2032, USD Million
5.2.2.By Form
5.2.2.1. Monohydrate- Market Insights and Forecast 2022-2032, USD Million
5.2.2.2. Anhydrous- Market Insights and Forecast 2022-2032, USD Million
5.2.3.By Packaging
5.2.3.1. Bottles- Market Insights and Forecast 2022-2032, USD Million
5.2.3.2. Bags- Market Insights and Forecast 2022-2032, USD Million
5.2.4.By Application
5.2.4.1. Li-ion Batteries- Market Insights and Forecast 2022-2032, USD Million
5.2.4.1.1. Electric Vehicles (EVs)- Market Insights and Forecast 2022-2032, USD Million
5.2.4.1.2. Portable Electronics- Market Insights and Forecast 2022-2032, USD Million
5.2.4.1.3. Grid Energy Storage Systems (ESS)- Market Insights and Forecast 2022-2032, USD Million
5.2.4.2. Greases & Lubricants- Market Insights and Forecast 2022-2032, USD Million
5.2.4.3. Glass & Ceramics- Market Insights and Forecast 2022-2032, USD Million
5.2.4.4. CO2 Scrubbers- Market Insights and Forecast 2022-2032, USD Million
5.2.4.5. Others- Market Insights and Forecast 2022-2032, USD Million
5.2.5.By End-Use Industry
5.2.5.1. Automotive- Market Insights and Forecast 2022-2032, USD Million
5.2.5.2. Electronics- Market Insights and Forecast 2022-2032, USD Million
5.2.5.3. Energy Storage- Market Insights and Forecast 2022-2032, USD Million
5.2.5.4. Industrial (Aerospace, Pharma, etc.)- Market Insights and Forecast 2022-2032, USD Million
5.2.6.By Region
5.2.6.1. North America
5.2.6.2. Latin America
5.2.6.3. Europe
5.2.6.4. Asia-Pacific
5.2.7.By Competitors
5.2.7.1. Competition Characteristics
5.2.7.2. Market Share & Analysis
6. North America Lithium Hydroxide Market Statistics, 2022-2032F
6.1. Market Size & Growth Outlook
6.1.1.By Revenues in US$ Million
6.2. Market Segmentation & Growth Outlook
6.2.1.By Purity- Market Insights and Forecast 2022-2032, USD Million
6.2.2.By Form- Market Insights and Forecast 2022-2032, USD Million
6.2.3.By Packaging- Market Insights and Forecast 2022-2032, USD Million
6.2.4.By Application- Market Insights and Forecast 2022-2032, USD Million
6.2.5.By End-Use Industry- Market Insights and Forecast 2022-2032, USD Million
6.2.6.By Country
6.2.6.1. USA
6.2.6.2. Canada
6.2.6.3. Mexico
6.2.6.4. Rest of North America
6.3. USA Lithium Hydroxide Market Statistics, 2022-2032F
6.3.1.Market Size & Growth Outlook
6.3.1.1. By Revenues in US$ Million
6.3.2.Market Segmentation & Growth Outlook
6.3.2.1. By Purity- Market Insights and Forecast 2022-2032, USD Million
6.3.2.2. By Application- Market Insights and Forecast 2022-2032, USD Million
6.4. Canada Lithium Hydroxide Market Statistics, 2022-2032F
6.4.1.Market Size & Growth Outlook
6.4.1.1. By Revenues in US$ Million
6.4.2.Market Segmentation & Growth Outlook
6.4.2.1. By Purity- Market Insights and Forecast 2022-2032, USD Million
6.4.2.2. By Application- Market Insights and Forecast 2022-2032, USD Million
6.5. Mexico Lithium Hydroxide Market Statistics, 2022-2032F
6.5.1.Market Size & Growth Outlook
6.5.1.1. By Revenues in US$ Million
6.5.2.Market Segmentation & Growth Outlook
6.5.2.1. By Purity- Market Insights and Forecast 2022-2032, USD Million
6.5.2.2. By Application- Market Insights and Forecast 2022-2032, USD Million
7. Latin America Lithium Hydroxide Market Statistics, 2022-2032F
7.1. Market Size & Growth Outlook
7.1.1.By Revenues in US$ Million
7.2. Market Segmentation & Growth Outlook
7.2.1.By Purity- Market Insights and Forecast 2022-2032, USD Million
7.2.2.By Form- Market Insights and Forecast 2022-2032, USD Million
7.2.3.By Packaging- Market Insights and Forecast 2022-2032, USD Million
7.2.4.By Application- Market Insights and Forecast 2022-2032, USD Million
7.2.5.By End-Use Industry- Market Insights and Forecast 2022-2032, USD Million
7.2.6.By Country
7.2.6.1. Brazil
7.2.6.2. Mexico
7.2.6.3. Rest of Latin America
7.3. Brazil Lithium Hydroxide Market Statistics, 2022-2032F
7.3.1.Market Size & Growth Outlook
7.3.1.1. By Revenues in US$ Million
7.3.2.Market Segmentation & Growth Outlook
7.3.2.1. By Purity- Market Insights and Forecast 2022-2032, USD Million
7.3.2.2. By Application- Market Insights and Forecast 2022-2032, USD Million
7.4. Mexico Lithium Hydroxide Market Statistics, 2022-2032F
7.4.1.Market Size & Growth Outlook
7.4.1.1. By Revenues in US$ Million
7.4.2.Market Segmentation & Growth Outlook
7.4.2.1. By Purity- Market Insights and Forecast 2022-2032, USD Million
7.4.2.2. By Application- Market Insights and Forecast 2022-2032, USD Million
8. Europe Lithium Hydroxide Market Statistics, 2022-2032F
8.1. Market Size & Growth Outlook
8.1.1.By Revenues in US$ Million
8.2. Market Segmentation & Growth Outlook
8.2.1.By Purity- Market Insights and Forecast 2022-2032, USD Million
8.2.2.By Form- Market Insights and Forecast 2022-2032, USD Million
8.2.3.By Packaging- Market Insights and Forecast 2022-2032, USD Million
8.2.4.By Application- Market Insights and Forecast 2022-2032, USD Million
8.2.5.By End-Use Industry- Market Insights and Forecast 2022-2032, USD Million
8.2.6.By Country
8.2.6.1. Germany
8.2.6.2. France
8.2.6.3. UK
8.2.6.4. Spain
8.2.6.5. Italy
8.2.6.6. Russia
8.2.6.7. Netherlands
8.2.6.8. Belgium
8.2.6.9. Poland
8.2.6.10. Turkey
8.2.6.11. Rest of Europe
8.3. Germany Lithium Hydroxide Market Statistics, 2022-2032F
8.3.1.Market Size & Growth Outlook
8.3.1.1. By Revenues in US$ Million
8.3.2.Market Segmentation & Growth Outlook
8.3.2.1. By Purity- Market Insights and Forecast 2022-2032, USD Million
8.3.2.2. By Application- Market Insights and Forecast 2022-2032, USD Million
8.4. France Lithium Hydroxide Market Statistics, 2022-2032F
8.4.1.Market Size & Growth Outlook
8.4.1.1. By Revenues in US$ Million
8.4.2.Market Segmentation & Growth Outlook
8.4.2.1. By Purity- Market Insights and Forecast 2022-2032, USD Million
8.4.2.2. By Application- Market Insights and Forecast 2022-2032, USD Million
8.5. UK Lithium Hydroxide Market Statistics, 2022-2032F
8.5.1.Market Size & Growth Outlook
8.5.1.1. By Revenues in US$ Million
8.5.2.Market Segmentation & Growth Outlook
8.5.2.1. By Purity- Market Insights and Forecast 2022-2032, USD Million
8.5.2.2. By Application- Market Insights and Forecast 2022-2032, USD Million
8.6. Spain Lithium Hydroxide Market Statistics, 2022-2032F
8.6.1.Market Size & Growth Outlook
8.6.1.1. By Revenues in US$ Million
8.6.2.Market Segmentation & Growth Outlook
8.6.2.1. By Purity- Market Insights and Forecast 2022-2032, USD Million
8.6.2.2. By Application- Market Insights and Forecast 2022-2032, USD Million
8.7. Italy Lithium Hydroxide Market Statistics, 2022-2032F
8.7.1.Market Size & Growth Outlook
8.7.1.1. By Revenues in US$ Million
8.7.2.Market Segmentation & Growth Outlook
8.7.2.1. By Purity- Market Insights and Forecast 2022-2032, USD Million
8.7.2.2. By Application- Market Insights and Forecast 2022-2032, USD Million
8.8. Russia Lithium Hydroxide Market Statistics, 2022-2032F
8.8.1.Market Size & Growth Outlook
8.8.1.1. By Revenues in US$ Million
8.8.2.Market Segmentation & Growth Outlook
8.8.2.1. By Purity- Market Insights and Forecast 2022-2032, USD Million
8.8.2.2. By Application- Market Insights and Forecast 2022-2032, USD Million
8.9. Netherlands Lithium Hydroxide Market Statistics, 2022-2032F
8.9.1.Market Size & Growth Outlook
8.9.1.1. By Revenues in US$ Million
8.9.2.Market Segmentation & Growth Outlook
8.9.2.1. By Purity- Market Insights and Forecast 2022-2032, USD Million
8.9.2.2. By Application- Market Insights and Forecast 2022-2032, USD Million
8.10. Belgium Lithium Hydroxide Market Statistics, 2022-2032F
8.10.1. Market Size & Growth Outlook
8.10.1.1. By Revenues in US$ Million
8.10.2. Market Segmentation & Growth Outlook
8.10.2.1. By Purity- Market Insights and Forecast 2022-2032, USD Million
8.10.2.2. By Application- Market Insights and Forecast 2022-2032, USD Million
8.11. Poland Lithium Hydroxide Market Statistics, 2022-2032F
8.11.1. Market Size & Growth Outlook
8.11.1.1. By Revenues in US$ Million
8.11.2. Market Segmentation & Growth Outlook
8.11.2.1. By Purity- Market Insights and Forecast 2022-2032, USD Million
8.11.2.2. By Application- Market Insights and Forecast 2022-2032, USD Million
8.12. Turkey Lithium Hydroxide Market Statistics, 2022-2032F
8.12.1. Market Size & Growth Outlook
8.12.1.1. By Revenues in US$ Million
8.12.2. Market Segmentation & Growth Outlook
8.12.2.1. By Purity- Market Insights and Forecast 2022-2032, USD Million
8.12.2.2. By Application- Market Insights and Forecast 2022-2032, USD Million
9. Asia-Pacific Lithium Hydroxide Market Statistics, 2022-2032F
9.1. Market Size & Growth Outlook
9.1.1.By Revenues in US$ Million
9.2. Market Segmentation & Growth Outlook
9.2.1.By Purity- Market Insights and Forecast 2022-2032, USD Million
9.2.2.By Form- Market Insights and Forecast 2022-2032, USD Million
9.2.3.By Packaging- Market Insights and Forecast 2022-2032, USD Million
9.2.4.By Application- Market Insights and Forecast 2022-2032, USD Million
9.2.5.By End-Use Industry- Market Insights and Forecast 2022-2032, USD Million
9.2.6.By Country
9.2.6.1. China
9.2.6.2. Japan
9.2.6.3. South Korea
9.2.6.4. India
9.2.6.5. Australia
9.2.6.6. Thailand
9.2.6.7. Rest of Asia-Pacific
9.3. China Lithium Hydroxide Market Statistics, 2022-2032F
9.3.1.Market Size & Growth Outlook
9.3.1.1. By Revenues in US$ Million
9.3.2.Market Segmentation & Growth Outlook
9.3.2.1. By Purity- Market Insights and Forecast 2022-2032, USD Million
9.3.2.2. By Application- Market Insights and Forecast 2022-2032, USD Million
9.4. Japan Lithium Hydroxide Market Statistics, 2022-2032F
9.4.1.Market Size & Growth Outlook
9.4.1.1. By Revenues in US$ Million
9.4.2.Market Segmentation & Growth Outlook
9.4.2.1. By Purity- Market Insights and Forecast 2022-2032, USD Million
9.4.2.2. By Application- Market Insights and Forecast 2022-2032, USD Million
9.5. South Korea Lithium Hydroxide Market Statistics, 2022-2032F
9.5.1.Market Size & Growth Outlook
9.5.1.1. By Revenues in US$ Million
9.5.2.Market Segmentation & Growth Outlook
9.5.2.1. By Purity- Market Insights and Forecast 2022-2032, USD Million
9.5.2.2. By Application- Market Insights and Forecast 2022-2032, USD Million
9.6. India Lithium Hydroxide Market Statistics, 2022-2032F
9.6.1.Market Size & Growth Outlook
9.6.1.1. By Revenues in US$ Million
9.6.2.Market Segmentation & Growth Outlook
9.6.2.1. By Purity- Market Insights and Forecast 2022-2032, USD Million
9.6.2.2. By Application- Market Insights and Forecast 2022-2032, USD Million
9.7. Australia Lithium Hydroxide Market Statistics, 2022-2032F
9.7.1.Market Size & Growth Outlook
9.7.1.1. By Revenues in US$ Million
9.7.2.Market Segmentation & Growth Outlook
9.7.2.1. By Purity- Market Insights and Forecast 2022-2032, USD Million
9.7.2.2. By Application- Market Insights and Forecast 2022-2032, USD Million
9.8. Thailand Lithium Hydroxide Market Statistics, 2022-2032F
9.8.1.Market Size & Growth Outlook
9.8.1.1. By Revenues in US$ Million
9.8.2.Market Segmentation & Growth Outlook
9.8.2.1. By Purity- Market Insights and Forecast 2022-2032, USD Million
9.8.2.2. By Application- Market Insights and Forecast 2022-2032, USD Million
10. Competitive Outlook
10.1. Company Profiles
10.1.1. Albemarle Corporation
10.1.1.1. Business Description
10.1.1.2. Product Portfolio
10.1.1.3. Collaborations & Alliances
10.1.1.4. Recent Developments
10.1.1.5. Financial Details
10.1.1.6. Others
10.1.2. Ganfeng Lithium
10.1.2.1. Business Description
10.1.2.2. Product Portfolio
10.1.2.3. Collaborations & Alliances
10.1.2.4. Recent Developments
10.1.2.5. Financial Details
10.1.2.6. Others
10.1.3. Tianqi Lithium
10.1.3.1. Business Description
10.1.3.2. Product Portfolio
10.1.3.3. Collaborations & Alliances
10.1.3.4. Recent Developments
10.1.3.5. Financial Details
10.1.3.6. Others
10.1.4. SQM S.A.
10.1.4.1. Business Description
10.1.4.2. Product Portfolio
10.1.4.3. Collaborations & Alliances
10.1.4.4. Recent Developments
10.1.4.5. Financial Details
10.1.4.6. Others
10.1.5. Livent
10.1.5.1. Business Description
10.1.5.2. Product Portfolio
10.1.5.3. Collaborations & Alliances
10.1.5.4. Recent Developments
10.1.5.5. Financial Details
10.1.5.6. Others
10.1.6. Lithium Americas
10.1.6.1. Business Description
10.1.6.2. Product Portfolio
10.1.6.3. Collaborations & Alliances
10.1.6.4. Recent Developments
10.1.6.5. Financial Details
10.1.6.6. Others
10.1.7. Mineral Resources
10.1.7.1. Business Description
10.1.7.2. Product Portfolio
10.1.7.3. Collaborations & Alliances
10.1.7.4. Recent Developments
10.1.7.5. Financial Details
10.1.7.6. Others
10.1.8. Pilbara Minerals
10.1.8.1. Business Description
10.1.8.2. Product Portfolio
10.1.8.3. Collaborations & Alliances
10.1.8.4. Recent Developments
10.1.8.5. Financial Details
10.1.8.6. Others
10.1.9. Yahua Industrial Group
10.1.9.1. Business Description
10.1.9.2. Product Portfolio
10.1.9.3. Collaborations & Alliances
10.1.9.4. Recent Developments
10.1.9.5. Financial Details
10.1.9.6. Others
10.1.10. Sichuan Energy Investment
10.1.10.1.Business Description
10.1.10.2.Product Portfolio
10.1.10.3.Collaborations & Alliances
10.1.10.4.Recent Developments
10.1.10.5.Financial Details
10.1.10.6.Others
10.1.11. Allkem
10.1.11.1.Business Description
10.1.11.2.Product Portfolio
10.1.11.3.Collaborations & Alliances
10.1.11.4.Recent Developments
10.1.11.5.Financial Details
10.1.11.6.Others
10.1.12. AMG Lithium
10.1.12.1.Business Description
10.1.12.2.Product Portfolio
10.1.12.3.Collaborations & Alliances
10.1.12.4.Recent Developments
10.1.12.5.Financial Details
10.1.12.6.Others
10.1.13. Nemaska Lithium
10.1.13.1.Business Description
10.1.13.2.Product Portfolio
10.1.13.3.Collaborations & Alliances
10.1.13.4.Recent Developments
10.1.13.5.Financial Details
10.1.13.6.Others
10.1.14. Arcadium Lithium
10.1.14.1.Business Description
10.1.14.2.Product Portfolio
10.1.14.3.Collaborations & Alliances
10.1.14.4.Recent Developments
10.1.14.5.Financial Details
10.1.14.6.Others
10.1.15. Piedmont Lithium
10.1.15.1.Business Description
10.1.15.2.Product Portfolio
10.1.15.3.Collaborations & Alliances
10.1.15.4.Recent Developments
10.1.15.5.Financial Details
10.1.15.6.Others
11. Disclaimer
| Segment | Sub-Segment |
|---|---|
| By Purity |
|
| By Form |
|
| By Packaging |
|
| By Application |
|
| By End-Use Industry |
|
| By Region |
|
Research Methodology
This study followed a structured approach comprising four key phases to assess the size and scope of the electro-oxidation market. The process began with thorough secondary research to collect data on the target market, related markets, and broader industry context. These findings, along with preliminary assumptions and estimates, were then validated through extensive primary research involving industry experts from across the value chain. To calculate the overall market size, both top-down and bottom-up methodologies were employed. Finally, market segmentation and data triangulation techniques were applied to refine and validate segment-level estimations.
Secondary Research
The secondary research phase involved gathering data from a wide range of credible and published sources. This step helped in identifying industry trends, defining market segmentation, and understanding the market landscape and value chain.
Sources consulted during this phase included:
- Company annual reports, investor presentations, and press releases
- Industry white papers and certified publications
- Trade directories and market-recognized databases
- Articles from authoritative authors and reputable journals
- Gold and silver standard websites
Secondary research was critical in mapping out the industry's value chain and monetary flow, identifying key market segments, understanding regional variations, and tracking significant industry developments.
Other key sources:
- Financial disclosures
- Industry associations and trade bodies
- News outlets and business magazines
- Academic journals and research studies
- Paid industry databases
Primary Research
To validate secondary data and gain deeper market insights, primary research was conducted with key stakeholders across both the supply and demand sides of the market.
On the demand side, participants included decision-makers and influencers from end-user industries—such as CIOs, CTOs, and CSOs—who provided first-hand perspectives on market needs, product usage, and future expectations.
On the supply side, interviews were conducted with manufacturers, industry associations, and institutional participants to gather insights into current offerings, product pipelines, and market challenges.
Primary interviews provided critical inputs such as:
- Market size and revenue data
- Product and service breakdowns
- Market forecasts
- Regional and application-specific trends
Stakeholders consulted included:
- Leading OEM and solution providers
- Channel and distribution partners
- End users across various applications
- Independent consultants and industry specialists
Market Size Estimation and Data Triangulation
- Identifying Key Market Participants (Secondary Research)
- Goal: To identify the major players or companies in the target market. This typically involves using publicly available data sources such as industry reports, market research publications, and financial statements of companies.
- Tools: Reports from firms like Gartner, Forrester, Euromonitor, Statista, IBISWorld, and others. Public financial statements, news articles, and press releases from top market players.
- Extracting Earnings of Key Market Participants
- Goal: To estimate the earnings generated from the product or service being analyzed. This step helps in understanding the revenue potential of each market player in a specific geography.
- Methods: Earnings data can be gathered from:
- Publicly available financial reports (for listed companies).
- Interviews and primary data sources from professionals, such as Directors, VPs, SVPs, etc. This is especially useful for understanding more nuanced, internal data that isn't publicly disclosed.
- Annual reports and investor presentations of key players.
- Data Collation and Development of a Relevant Data Model
- Goal: To collate inputs from both primary and secondary sources into a structured, data-driven model for market estimation. This model will incorporate key market KPIs and any independent variables relevant to the market.
- Key KPIs: These could include:
- Market size, growth rate, and demand drivers.
- Industry-specific metrics like market share, average revenue per customer (ARPC), or average deal size.
- External variables, such as economic growth rates, inflation rates, or commodity prices, that could affect the market.
- Data Modeling: Based on this data, the market forecasts are developed for the next 5 years. A combination of trend analysis, scenario modeling, and statistical regression might be used to generate projections.
- Scenario Analysis
- Goal: To test different assumptions and validate how sensitive the market is to changes in key variables (e.g., market demand, regulatory changes, technological disruptions).
- Types of Scenarios:
- Base Case: Based on current assumptions and historical data.
- Best-Case Scenario: Assuming favorable market conditions, regulatory environments, and technological advancements.
- Worst-Case Scenario: Accounting for adverse factors, such as economic downturns, stricter regulations, or unexpected disruptions.


