Global Cobalt Sulfate Market Report: Trends, Growth and Forecast (2026-2032)
By Grade (Battery Grade, Hydrometallurgical Grade, Chemical Grade, Industrial Grade, Pharmaceutical Grade), By Application (Lithium-Ion Batteries, Electroplating, Pigments & Dyes, Catalysts, Pharmaceuticals), By Raw Material Source (Cobalt Ore, Nickel Ore, Hydroxide Precursors, Sulfuric Acid), By End-Use Industry (Consumer Electronics, Automotive (EV), Aerospace, Industrial, Healthcare), By Region (North America, Latin America, Europe, Asia-Pacific) ... Read more
|
Major Players
|
Global Cobalt Sulfate Market Statistics and Insights, 2026
- Market Size Statistics
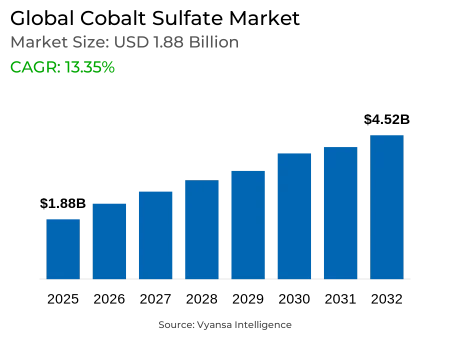
- Global Cobalt Sulfate Market is estimated at $ 1.88 Billion.
- The market size is expected to grow to $ 4.52 Billion by 2032.
- Market to register a CAGR of around 13.35% during 2026-32.
- Grade Shares
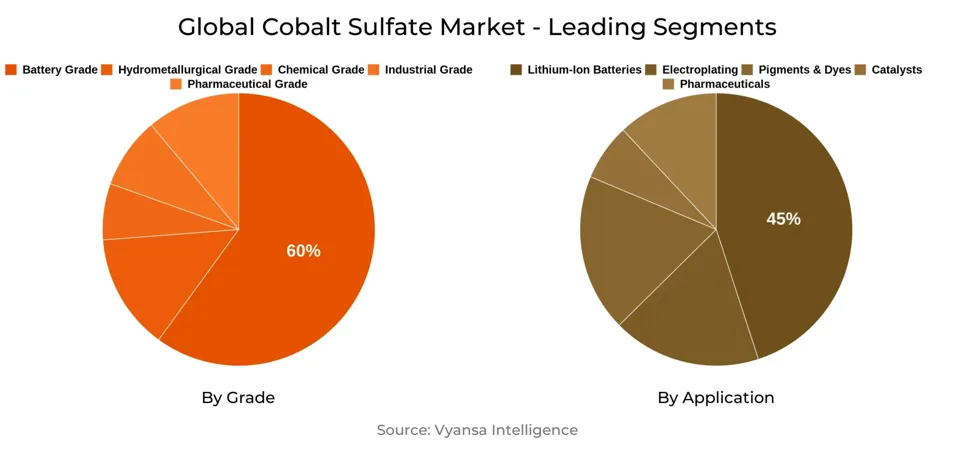
- Battery Grade grabbed market share of 60%.
- Competition
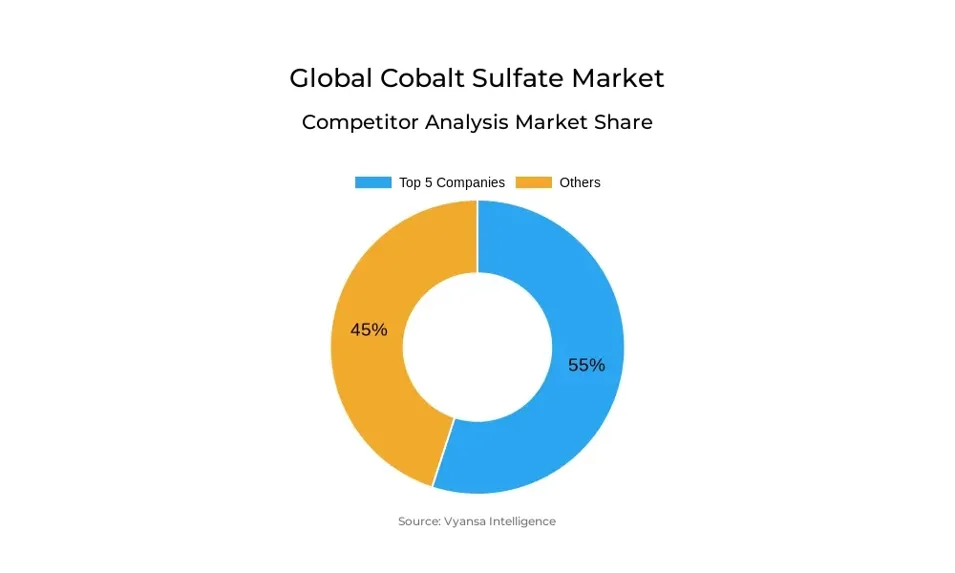
- More than 30 companies are actively engaged in producing Cobalt Sulfate.
- Top 5 companies acquired 55% of the market share.
- Sumitomo Metal Mining, Norilsk Nickel, Huayou Cobalt, China Molybdenum Co., Eurasian Resources Group (ERG) etc., are few of the top companies.
- Application
- Lithium-Ion Batteries grabbed 45% of the market.
- Region
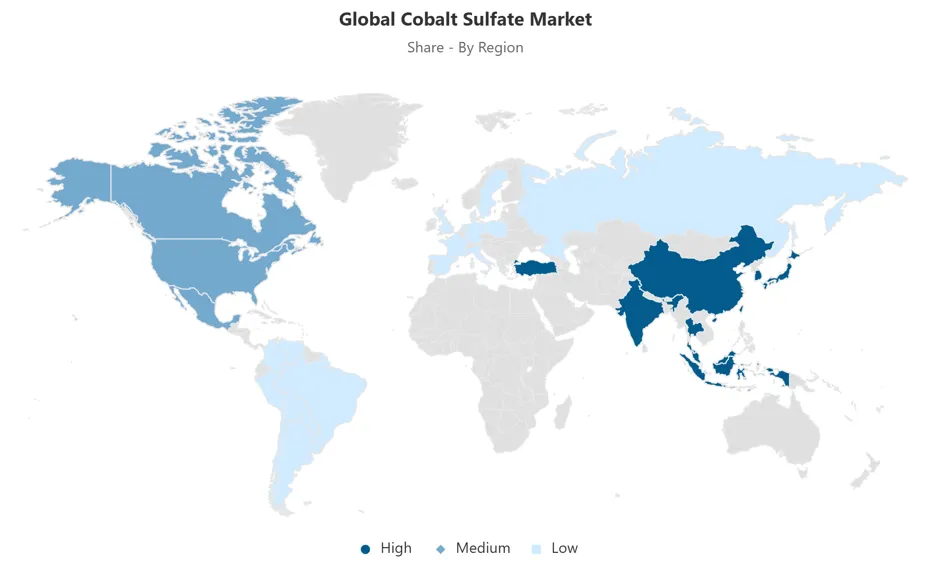
- Asia-Pacific leads with a 60% share of the Global Market.
Global Cobalt Sulfate Market Outlook
The Global Cobalt Sulfate Market has been estimated at USD 1.88 billion in the year 2025 and is anticipated to reach USD 4.52 billion by 2032, with high growth rates being spurred by the ramp-up in the use of electric vehicles. As much as 45% of total cobalt consumption is already fed into lithium-ion batteries, placing it at the core of providing high energy density, stability, and increased cycle life. As governments impose stricter emission standards and promote the adoption of EVs, cobalt sulfate continues to be an essential material that allows manufacturers to achieve both performance requirements and sustainability objectives.
Though crucial, the sector is under supply stress because cobalt production is still concentrated in a handful of mining hubs. Global output increased to nearly 140,000 metric tons in 2023, but refining capacity for battery-grade sulfate is lagging behind. Ethical and environmental issues, including child labor and ecological impact in mining districts, provide additional challenges. This is compelling companies to invest in responsible sourcing, transparent supply chains, and cleaner refining so that supply is ensured in the long term.
Market dynamics are also influenced by technological changes in battery chemistries. Producers are gravitating toward high-nickel composition to decrease cobalt intensity per cell, but aggregate cobalt sulfate demand still grows with increasing EV and energy storage deployment. Beyond transportation, it is being utilized in stabilizer additives for lithium iron phosphate batteries, further expanding its function in grid-scale storage and integration of renewable energies.
Recycling is coming to the forefront as the main solution, with end-of-life batteries providing as much as 90% purity in recovered cobalt sulfate. Policy initiatives mandating EV battery recycled content further add to this trend, making urban mining a critical supply contributor. Coupled with robust demand in Asia-Pacific, which represents almost 60% of global consumption, these trends make cobalt sulfate a critical enabler of global electrification and clean energy transformation.
Global Cobalt Sulfate Market Growth Driver
The increasing popularity of electric vehicles is a key driver of cobalt sulfate consumption globally. About 45% of total cobalt usage globally today is channeled into lithium-ion batteries, highlighting its vital function to provide high energy density and stability in EV powertrains. Cobalt sulfate of battery grade provides improved cycle life and safety, enabling producers to achieve high performance standards in alignment with expanding mobility requirements. These properties make cobalt sulfate an indispensable ingredient in future electrification plans.
Simultaneously, environmental regulations and incentives for low-emission vehicles reinforce cobalt sulfate’s prominence. Governments are setting ambitious EV adoption targets and mandating battery recycling, further fueling demand for high-purity cobalt sulfate.
Global Cobalt Sulfate Market Challenge
The growth EV market puts unparalleled pressure on cobalt sulfate supply chains, which are still geographically concentrated in a handful of mining areas. Global cobalt production hit about 140,000 metric tons in 2023, but capacity for refining to battery-grade sulfate is still too low to keep pace with increasing demand. Such a gap highlights the difficulty of ensuring stable raw material supply for mass applications.
Concurrently, producers are also subjected to increasing ethical and environmental pressure. Issues regarding child labor operations and environmental destruction in cobalt-producing areas put stakeholders on the spot to ensure responsible sourcing practices. Firms are becoming more and more inclined to invest in traceability, cleaner refining processes, and transparency programs. These steps are taken to ensure supply continuity while addressing regulators', manufacturers', and end-users' expectations for sustainably sourced materials.
Unlock Market Intelligence
Explore the market potential with our data-driven report
Global Cobalt Sulfate Market Trend
The sector is gradually shifting to high-nickel cathode chemistries to lower per-cell cobalt intensity. In 2023, half-nickel chemistries held 48% of cobalt demand in batteries as the producers tried to find a balance between performance and cost reduction. This lowers cobalt intensity per unit but overall cobalt sulfate demand continues to grow with the increasing adoption of EVs and energy storage.
In addition to its conventional cathode applications, cobalt sulfate is increasingly being used in grid-scale lithium iron phosphate battery stabilizer additives. These applications improve heat management and safety in large-format use, showcasing cobalt sulfate's new applications in the larger energy storage environment. Such applications broaden its applicability beyond electric mobility, integrating it into various energy technologies that are expected to grow long-term.
Global Cobalt Sulfate Market Opportunity
Increasing environmental concerns are paving the way for cobalt recycling through recycling efforts. End-of-life batteries offer a rich source, with recycling technologies being able to recover cobalt sulfate with up to 90% purity. Such urban mining reduces reliance on primary mining and facilitates industries' sustainability commitments.
Furthermore, policy structures imposing recycled content on EV batteries are creating new market prospects. Recycled cobalt sulfate is set to take an increasing proportion of global supply, reducing supply risks and improving resource security. Such trends place recycling as a strategic keystone in the cobalt sulfate market in line with the needs of regulators, producers, and environmentally aware end consumers.
Global Cobalt Sulfate Market Regional Analysis
By Region
- North America
- Latin America
- Europe
- Asia-Pacific
Asia-Pacific hosts close to 60% of global demand for cobalt sulfate, cementing its position as the world's top demand center. The region is driven by mass EV manufacturing, high-tech electronics production, and ambitious renewable energy goals. China, South Korea, and Japan are the major markets, backed by integrated supply chains and local policies fostering electrification.
In 2025, EV battery, consumer electronics, and grid-scale storage applications propel regional demand. Asia-Pacific's large-scale recycling programs further boost cobalt sulfate supply, avoiding reliance on third-party sources. Government policies, robust industrial foundations, and international export competitiveness guarantee the region maintains its leadership position, creating a hotspot for cobalt sulfate development during the forecast period.
Unlock Market Intelligence
Explore the market potential with our data-driven report
Global Cobalt Sulfate Market Segmentation Analysis
By Grade
- Battery Grade
- Hydrometallurgical Grade
- Chemical Grade
- Industrial Grade
- Pharmaceutical Grade
Battery grade is the largest category within Grade, with 60% of world cobalt sulfate use. Its prevalence results from the elevated purity and performance demanded for cathodes in lithium-ion batteries, where reliability and energy density are critical. Such characteristics render battery-grade material imperative to achieving a uniform quality in EVs, electronics, and energy storage systems.
Industrial and technical grades, meanwhile, are still significant in specialized applications like electroplating and pigments. Yet, their contribution to market is limited relative to battery-grade demand, which remains a magnet for upstream investment. Refinery capacity expansion and intense quality controls further cement the dominance of battery-grade cobalt sulfate so that manufacturers will be able to respond to accelerating demands of electrification industries.
By Application
- Lithium-Ion Batteries
- Electroplating
- Pigments & Dyes
- Catalysts
- Pharmaceuticals
Lithium-ion batteries have the largest application share at 45%, which accounts for the largest use of cobalt sulfate globally. Its function in cathode formulations increases energy density, cycle life, and thermal stability, which makes it essential in EVs, portable electronics, and renewable energy storage systems. The performance consistency supplied by cobalt sulfate is appreciated by end users, ensuring that it is a pillar of contemporary power solutions.
Outside of EVs, lithium-ion batteries spread cobalt sulfate's influence into consumer electronics and grid storage, further consolidating its market dominance. With renewable energy installation and penetration of portable devices accelerating, demand for lithium-ion batteries will continue to be strong. This keeps cobalt sulfate dominant in application share even in the presence of new chemistries and recycling efforts within the energy storage arena.
Top Companies in Global Cobalt Sulfate Market
The top companies operating in the market include Sumitomo Metal Mining, Norilsk Nickel, Huayou Cobalt, China Molybdenum Co., Eurasian Resources Group (ERG), Freeport-McMoRan, Umicore, Glencore, Jinchuan Group, Nantong Xinwei Nickel & Cobalt HighTech, Ganzhou Tengyuan Cobalt New Material, Zhangjiagang Huayi Chemical, Vital Materials Co., Forbes Pharmaceutical, Freeport Cobalt Oy, etc., are the top players operating in the Global Cobalt Sulfate Market.
Frequently Asked Questions
Related Report
1. Market Segmentation
1.1. Research Scope
1.2. Research Methodology
1.3. Definitions and Assumptions
2. Executive Summary
3. Global Cobalt Sulfate Market Policies, Regulations, and Standards
4. Global Cobalt Sulfate Market Dynamics
4.1. Growth Factors
4.2. Challenges
4.3. Trends
4.4. Opportunities
5. Global Cobalt Sulfate Market Statistics, 2022-2032F
5.1. Market Size & Growth Outlook
5.1.1.By Revenues in US$ Million
5.2. Market Segmentation & Growth Outlook
5.2.1.By Grade
5.2.1.1. Battery Grade- Market Insights and Forecast 2022-2032, USD Million
5.2.1.2. Hydrometallurgical Grade- Market Insights and Forecast 2022-2032, USD Million
5.2.1.3. Chemical Grade- Market Insights and Forecast 2022-2032, USD Million
5.2.1.4. Industrial Grade- Market Insights and Forecast 2022-2032, USD Million
5.2.1.5. Pharmaceutical Grade- Market Insights and Forecast 2022-2032, USD Million
5.2.2.By Application
5.2.2.1. Lithium-Ion Batteries- Market Insights and Forecast 2022-2032, USD Million
5.2.2.2. Electroplating- Market Insights and Forecast 2022-2032, USD Million
5.2.2.3. Pigments & Dyes- Market Insights and Forecast 2022-2032, USD Million
5.2.2.4. Catalysts- Market Insights and Forecast 2022-2032, USD Million
5.2.2.5. Pharmaceuticals- Market Insights and Forecast 2022-2032, USD Million
5.2.3.By Raw Material Source
5.2.3.1. Cobalt Ore- Market Insights and Forecast 2022-2032, USD Million
5.2.3.2. Nickel Ore- Market Insights and Forecast 2022-2032, USD Million
5.2.3.3. Hydroxide Precursors- Market Insights and Forecast 2022-2032, USD Million
5.2.3.4. Sulfuric Acid- Market Insights and Forecast 2022-2032, USD Million
5.2.4.By End-Use Industry
5.2.4.1. Consumer Electronics- Market Insights and Forecast 2022-2032, USD Million
5.2.4.2. Automotive (EV)- Market Insights and Forecast 2022-2032, USD Million
5.2.4.3. Aerospace- Market Insights and Forecast 2022-2032, USD Million
5.2.4.4. Industrial- Market Insights and Forecast 2022-2032, USD Million
5.2.4.5. Healthcare- Market Insights and Forecast 2022-2032, USD Million
5.2.5.By Region
5.2.5.1. North America
5.2.5.2. Latin America
5.2.5.3. Europe
5.2.5.4. Asia-Pacific
5.2.6.By Competitors
5.2.6.1. Competition Characteristics
5.2.6.2. Market Share & Analysis
6. North America Cobalt Sulfate Market Statistics, 2022-2032F
6.1. Market Size & Growth Outlook
6.1.1.By Revenues in US$ Million
6.2. Market Segmentation & Growth Outlook
6.2.1.By Grade- Market Insights and Forecast 2022-2032, USD Million
6.2.2.By Application- Market Insights and Forecast 2022-2032, USD Million
6.2.3.By Raw Material Source- Market Insights and Forecast 2022-2032, USD Million
6.2.4.By End-Use Industry- Market Insights and Forecast 2022-2032, USD Million
6.2.5.By Country
6.2.5.1. USA
6.2.5.2. Canada
6.2.5.3. Mexico
6.2.5.4. Rest of North America
6.3. USA Cobalt Sulfate Market Statistics, 2022-2032F
6.3.1.Market Size & Growth Outlook
6.3.1.1. By Revenues in US$ Million
6.3.2.Market Segmentation & Growth Outlook
6.3.2.1. By Grade- Market Insights and Forecast 2022-2032, USD Million
6.3.2.2. By Application- Market Insights and Forecast 2022-2032, USD Million
6.4. Canada Cobalt Sulfate Market Statistics, 2022-2032F
6.4.1.Market Size & Growth Outlook
6.4.1.1. By Revenues in US$ Million
6.4.2.Market Segmentation & Growth Outlook
6.4.2.1. By Grade- Market Insights and Forecast 2022-2032, USD Million
6.4.2.2. By Application- Market Insights and Forecast 2022-2032, USD Million
6.5. Mexico Cobalt Sulfate Market Statistics, 2022-2032F
6.5.1.Market Size & Growth Outlook
6.5.1.1. By Revenues in US$ Million
6.5.2.Market Segmentation & Growth Outlook
6.5.2.1. By Grade- Market Insights and Forecast 2022-2032, USD Million
6.5.2.2. By Application- Market Insights and Forecast 2022-2032, USD Million
7. Latin America Cobalt Sulfate Market Statistics, 2022-2032F
7.1. Market Size & Growth Outlook
7.1.1.By Revenues in US$ Million
7.2. Market Segmentation & Growth Outlook
7.2.1.By Grade- Market Insights and Forecast 2022-2032, USD Million
7.2.2.By Application- Market Insights and Forecast 2022-2032, USD Million
7.2.3.By Raw Material Source- Market Insights and Forecast 2022-2032, USD Million
7.2.4.By End-Use Industry- Market Insights and Forecast 2022-2032, USD Million
7.2.5.By Country
7.2.5.1. Brazil
7.2.5.2. Mexico
7.2.5.3. Rest of Latin America
7.3. Brazil Cobalt Sulfate Market Statistics, 2022-2032F
7.3.1.Market Size & Growth Outlook
7.3.1.1. By Revenues in US$ Million
7.3.2.Market Segmentation & Growth Outlook
7.3.2.1. By Grade- Market Insights and Forecast 2022-2032, USD Million
7.3.2.2. By Application- Market Insights and Forecast 2022-2032, USD Million
7.4. Mexico Cobalt Sulfate Market Statistics, 2022-2032F
7.4.1.Market Size & Growth Outlook
7.4.1.1. By Revenues in US$ Million
7.4.2.Market Segmentation & Growth Outlook
7.4.2.1. By Grade- Market Insights and Forecast 2022-2032, USD Million
7.4.2.2. By Application- Market Insights and Forecast 2022-2032, USD Million
8. Europe Cobalt Sulfate Market Statistics, 2022-2032F
8.1. Market Size & Growth Outlook
8.1.1.By Revenues in US$ Million
8.2. Market Segmentation & Growth Outlook
8.2.1.By Grade- Market Insights and Forecast 2022-2032, USD Million
8.2.2.By Application- Market Insights and Forecast 2022-2032, USD Million
8.2.3.By Raw Material Source- Market Insights and Forecast 2022-2032, USD Million
8.2.4.By End-Use Industry- Market Insights and Forecast 2022-2032, USD Million
8.2.5.By Country
8.2.5.1. Germany
8.2.5.2. Russia
8.2.5.3. France
8.2.5.4. UK
8.2.5.5. Spain
8.2.5.6. Italy
8.2.5.7. Netherlands
8.2.5.8. Belgium
8.2.5.9. Poland
8.2.5.10. Turkey
8.2.5.11. Rest of Europe
8.3. Germany Cobalt Sulfate Market Statistics, 2022-2032F
8.3.1.Market Size & Growth Outlook
8.3.1.1. By Revenues in US$ Million
8.3.2.Market Segmentation & Growth Outlook
8.3.2.1. By Grade- Market Insights and Forecast 2022-2032, USD Million
8.3.2.2. By Application- Market Insights and Forecast 2022-2032, USD Million
8.4. Russia Cobalt Sulfate Market Statistics, 2022-2032F
8.4.1.Market Size & Growth Outlook
8.4.1.1. By Revenues in US$ Million
8.4.2.Market Segmentation & Growth Outlook
8.4.2.1. By Grade- Market Insights and Forecast 2022-2032, USD Million
8.4.2.2. By Application- Market Insights and Forecast 2022-2032, USD Million
8.5. France Cobalt Sulfate Market Statistics, 2022-2032F
8.5.1.Market Size & Growth Outlook
8.5.1.1. By Revenues in US$ Million
8.5.2.Market Segmentation & Growth Outlook
8.5.2.1. By Grade- Market Insights and Forecast 2022-2032, USD Million
8.5.2.2. By Application- Market Insights and Forecast 2022-2032, USD Million
8.6. UK Cobalt Sulfate Market Statistics, 2022-2032F
8.6.1.Market Size & Growth Outlook
8.6.1.1. By Revenues in US$ Million
8.6.2.Market Segmentation & Growth Outlook
8.6.2.1. By Grade- Market Insights and Forecast 2022-2032, USD Million
8.6.2.2. By Application- Market Insights and Forecast 2022-2032, USD Million
8.7. Spain Cobalt Sulfate Market Statistics, 2022-2032F
8.7.1.Market Size & Growth Outlook
8.7.1.1. By Revenues in US$ Million
8.7.2.Market Segmentation & Growth Outlook
8.7.2.1. By Grade- Market Insights and Forecast 2022-2032, USD Million
8.7.2.2. By Application- Market Insights and Forecast 2022-2032, USD Million
8.8. Italy Cobalt Sulfate Market Statistics, 2022-2032F
8.8.1.Market Size & Growth Outlook
8.8.1.1. By Revenues in US$ Million
8.8.2.Market Segmentation & Growth Outlook
8.8.2.1. By Grade- Market Insights and Forecast 2022-2032, USD Million
8.8.2.2. By Application- Market Insights and Forecast 2022-2032, USD Million
8.9. Netherlands Cobalt Sulfate Market Statistics, 2022-2032F
8.9.1.Market Size & Growth Outlook
8.9.1.1. By Revenues in US$ Million
8.9.2.Market Segmentation & Growth Outlook
8.9.2.1. By Grade- Market Insights and Forecast 2022-2032, USD Million
8.9.2.2. By Application- Market Insights and Forecast 2022-2032, USD Million
8.10. Belgium Cobalt Sulfate Market Statistics, 2022-2032F
8.10.1. Market Size & Growth Outlook
8.10.1.1. By Revenues in US$ Million
8.10.2. Market Segmentation & Growth Outlook
8.10.2.1. By Grade- Market Insights and Forecast 2022-2032, USD Million
8.10.2.2. By Application- Market Insights and Forecast 2022-2032, USD Million
8.11. Poland Cobalt Sulfate Market Statistics, 2022-2032F
8.11.1. Market Size & Growth Outlook
8.11.1.1. By Revenues in US$ Million
8.11.2. Market Segmentation & Growth Outlook
8.11.2.1. By Grade- Market Insights and Forecast 2022-2032, USD Million
8.11.2.2. By Application- Market Insights and Forecast 2022-2032, USD Million
8.12. Turkey Cobalt Sulfate Market Statistics, 2022-2032F
8.12.1. Market Size & Growth Outlook
8.12.1.1. By Revenues in US$ Million
8.12.2. Market Segmentation & Growth Outlook
8.12.2.1. By Grade- Market Insights and Forecast 2022-2032, USD Million
8.12.2.2. By Application- Market Insights and Forecast 2022-2032, USD Million
9. Asia-Pacific Cobalt Sulfate Market Statistics, 2022-2032F
9.1. Market Size & Growth Outlook
9.1.1.By Revenues in US$ Million
9.2. Market Segmentation & Growth Outlook
9.2.1.By Grade- Market Insights and Forecast 2022-2032, USD Million
9.2.2.By Application- Market Insights and Forecast 2022-2032, USD Million
9.2.3.By Raw Material Source- Market Insights and Forecast 2022-2032, USD Million
9.2.4.By End-Use Industry- Market Insights and Forecast 2022-2032, USD Million
9.2.5.By Country
9.2.5.1. China
9.2.5.2. Japan
9.2.5.3. South Korea
9.2.5.4. India
9.2.5.5. Australia
9.2.5.6. Thailand
9.2.5.7. Rest of Asia-Pacific
9.3. China Cobalt Sulfate Market Statistics, 2022-2032F
9.3.1.Market Size & Growth Outlook
9.3.1.1. By Revenues in US$ Million
9.3.2.Market Segmentation & Growth Outlook
9.3.2.1. By Grade- Market Insights and Forecast 2022-2032, USD Million
9.3.2.2. By Application- Market Insights and Forecast 2022-2032, USD Million
9.4. Japan Cobalt Sulfate Market Statistics, 2022-2032F
9.4.1.Market Size & Growth Outlook
9.4.1.1. By Revenues in US$ Million
9.4.2.Market Segmentation & Growth Outlook
9.4.2.1. By Grade- Market Insights and Forecast 2022-2032, USD Million
9.4.2.2. By Application- Market Insights and Forecast 2022-2032, USD Million
9.5. South Korea Cobalt Sulfate Market Statistics, 2022-2032F
9.5.1.Market Size & Growth Outlook
9.5.1.1. By Revenues in US$ Million
9.5.2.Market Segmentation & Growth Outlook
9.5.2.1. By Grade- Market Insights and Forecast 2022-2032, USD Million
9.5.2.2. By Application- Market Insights and Forecast 2022-2032, USD Million
9.6. India Cobalt Sulfate Market Statistics, 2022-2032F
9.6.1.Market Size & Growth Outlook
9.6.1.1. By Revenues in US$ Million
9.6.2.Market Segmentation & Growth Outlook
9.6.2.1. By Grade- Market Insights and Forecast 2022-2032, USD Million
9.6.2.2. By Application- Market Insights and Forecast 2022-2032, USD Million
9.7. Australia Cobalt Sulfate Market Statistics, 2022-2032F
9.7.1.Market Size & Growth Outlook
9.7.1.1. By Revenues in US$ Million
9.7.2.Market Segmentation & Growth Outlook
9.7.2.1. By Grade- Market Insights and Forecast 2022-2032, USD Million
9.7.2.2. By Application- Market Insights and Forecast 2022-2032, USD Million
9.8. Thailand Cobalt Sulfate Market Statistics, 2022-2032F
9.8.1.Market Size & Growth Outlook
9.8.1.1. By Revenues in US$ Million
9.8.2.Market Segmentation & Growth Outlook
9.8.2.1. By Grade- Market Insights and Forecast 2022-2032, USD Million
9.8.2.2. By Application- Market Insights and Forecast 2022-2032, USD Million
10. Competitive Outlook
10.1. Company Profiles
10.1.1. China Molybdenum Co.
10.1.1.1. Business Description
10.1.1.2. Product Portfolio
10.1.1.3. Collaborations & Alliances
10.1.1.4. Recent Developments
10.1.1.5. Financial Details
10.1.1.6. Others
10.1.2. Eurasian Resources Group (ERG)
10.1.2.1. Business Description
10.1.2.2. Product Portfolio
10.1.2.3. Collaborations & Alliances
10.1.2.4. Recent Developments
10.1.2.5. Financial Details
10.1.2.6. Others
10.1.3. Freeport-McMoRan
10.1.3.1. Business Description
10.1.3.2. Product Portfolio
10.1.3.3. Collaborations & Alliances
10.1.3.4. Recent Developments
10.1.3.5. Financial Details
10.1.3.6. Others
10.1.4. Umicore
10.1.4.1. Business Description
10.1.4.2. Product Portfolio
10.1.4.3. Collaborations & Alliances
10.1.4.4. Recent Developments
10.1.4.5. Financial Details
10.1.4.6. Others
10.1.5. Glencore
10.1.5.1. Business Description
10.1.5.2. Product Portfolio
10.1.5.3. Collaborations & Alliances
10.1.5.4. Recent Developments
10.1.5.5. Financial Details
10.1.5.6. Others
10.1.6. Sumitomo Metal Mining
10.1.6.1. Business Description
10.1.6.2. Product Portfolio
10.1.6.3. Collaborations & Alliances
10.1.6.4. Recent Developments
10.1.6.5. Financial Details
10.1.6.6. Others
10.1.7. Norilsk Nickel
10.1.7.1. Business Description
10.1.7.2. Product Portfolio
10.1.7.3. Collaborations & Alliances
10.1.7.4. Recent Developments
10.1.7.5. Financial Details
10.1.7.6. Others
10.1.8. Huayou Cobalt
10.1.8.1. Business Description
10.1.8.2. Product Portfolio
10.1.8.3. Collaborations & Alliances
10.1.8.4. Recent Developments
10.1.8.5. Financial Details
10.1.8.6. Others
10.1.9. Jinchuan Group
10.1.9.1. Business Description
10.1.9.2. Product Portfolio
10.1.9.3. Collaborations & Alliances
10.1.9.4. Recent Developments
10.1.9.5. Financial Details
10.1.9.6. Others
10.1.10. Nantong Xinwei Nickel & Cobalt HighTech
10.1.10.1.Business Description
10.1.10.2.Product Portfolio
10.1.10.3.Collaborations & Alliances
10.1.10.4.Recent Developments
10.1.10.5.Financial Details
10.1.10.6.Others
10.1.11. Ganzhou Tengyuan Cobalt New Material
10.1.11.1.Business Description
10.1.11.2.Product Portfolio
10.1.11.3.Collaborations & Alliances
10.1.11.4.Recent Developments
10.1.11.5.Financial Details
10.1.11.6.Others
10.1.12. Zhangjiagang Huayi Chemical
10.1.12.1.Business Description
10.1.12.2.Product Portfolio
10.1.12.3.Collaborations & Alliances
10.1.12.4.Recent Developments
10.1.12.5.Financial Details
10.1.12.6.Others
10.1.13. Vital Materials Co.
10.1.13.1.Business Description
10.1.13.2.Product Portfolio
10.1.13.3.Collaborations & Alliances
10.1.13.4.Recent Developments
10.1.13.5.Financial Details
10.1.13.6.Others
10.1.14. Forbes Pharmaceutical
10.1.14.1.Business Description
10.1.14.2.Product Portfolio
10.1.14.3.Collaborations & Alliances
10.1.14.4.Recent Developments
10.1.14.5.Financial Details
10.1.14.6.Others
10.1.15. Freeport Cobalt Oy
10.1.15.1.Business Description
10.1.15.2.Product Portfolio
10.1.15.3.Collaborations & Alliances
10.1.15.4.Recent Developments
10.1.15.5.Financial Details
10.1.15.6.Others
11. Disclaimer
| Segment | Sub-Segment |
|---|---|
| By Grade |
|
| By Application |
|
| By Raw Material Source |
|
| By End-Use Industry |
|
| By Region |
|
Research Methodology
This study followed a structured approach comprising four key phases to assess the size and scope of the electro-oxidation market. The process began with thorough secondary research to collect data on the target market, related markets, and broader industry context. These findings, along with preliminary assumptions and estimates, were then validated through extensive primary research involving industry experts from across the value chain. To calculate the overall market size, both top-down and bottom-up methodologies were employed. Finally, market segmentation and data triangulation techniques were applied to refine and validate segment-level estimations.
Secondary Research
The secondary research phase involved gathering data from a wide range of credible and published sources. This step helped in identifying industry trends, defining market segmentation, and understanding the market landscape and value chain.
Sources consulted during this phase included:
- Company annual reports, investor presentations, and press releases
- Industry white papers and certified publications
- Trade directories and market-recognized databases
- Articles from authoritative authors and reputable journals
- Gold and silver standard websites
Secondary research was critical in mapping out the industry's value chain and monetary flow, identifying key market segments, understanding regional variations, and tracking significant industry developments.
Other key sources:
- Financial disclosures
- Industry associations and trade bodies
- News outlets and business magazines
- Academic journals and research studies
- Paid industry databases
Primary Research
To validate secondary data and gain deeper market insights, primary research was conducted with key stakeholders across both the supply and demand sides of the market.
On the demand side, participants included decision-makers and influencers from end-user industries—such as CIOs, CTOs, and CSOs—who provided first-hand perspectives on market needs, product usage, and future expectations.
On the supply side, interviews were conducted with manufacturers, industry associations, and institutional participants to gather insights into current offerings, product pipelines, and market challenges.
Primary interviews provided critical inputs such as:
- Market size and revenue data
- Product and service breakdowns
- Market forecasts
- Regional and application-specific trends
Stakeholders consulted included:
- Leading OEM and solution providers
- Channel and distribution partners
- End users across various applications
- Independent consultants and industry specialists
Market Size Estimation and Data Triangulation
- Identifying Key Market Participants (Secondary Research)
- Goal: To identify the major players or companies in the target market. This typically involves using publicly available data sources such as industry reports, market research publications, and financial statements of companies.
- Tools: Reports from firms like Gartner, Forrester, Euromonitor, Statista, IBISWorld, and others. Public financial statements, news articles, and press releases from top market players.
- Extracting Earnings of Key Market Participants
- Goal: To estimate the earnings generated from the product or service being analyzed. This step helps in understanding the revenue potential of each market player in a specific geography.
- Methods: Earnings data can be gathered from:
- Publicly available financial reports (for listed companies).
- Interviews and primary data sources from professionals, such as Directors, VPs, SVPs, etc. This is especially useful for understanding more nuanced, internal data that isn't publicly disclosed.
- Annual reports and investor presentations of key players.
- Data Collation and Development of a Relevant Data Model
- Goal: To collate inputs from both primary and secondary sources into a structured, data-driven model for market estimation. This model will incorporate key market KPIs and any independent variables relevant to the market.
- Key KPIs: These could include:
- Market size, growth rate, and demand drivers.
- Industry-specific metrics like market share, average revenue per customer (ARPC), or average deal size.
- External variables, such as economic growth rates, inflation rates, or commodity prices, that could affect the market.
- Data Modeling: Based on this data, the market forecasts are developed for the next 5 years. A combination of trend analysis, scenario modeling, and statistical regression might be used to generate projections.
- Scenario Analysis
- Goal: To test different assumptions and validate how sensitive the market is to changes in key variables (e.g., market demand, regulatory changes, technological disruptions).
- Types of Scenarios:
- Base Case: Based on current assumptions and historical data.
- Best-Case Scenario: Assuming favorable market conditions, regulatory environments, and technological advancements.
- Worst-Case Scenario: Accounting for adverse factors, such as economic downturns, stricter regulations, or unexpected disruptions.


