Global Graphite (Natural & Synthetic Spherical) Market Report: Trends, Growth and Forecast (2026-2032)
By Type (Natural (Flake/Amorphous), Synthetic Spherical Graphite), By Application (Battery Anodes, Lubricants, Refractories, Fuel Cells, Others), By Technology (Hydrothermal, Mechanical, Chemical), By Sales Channel (Direct Sales, Online, Retail), By Region (North America, Latin America, Europe, Asia-Pacific) ... Read more
|
Major Players
|
Global Graphite (Natural & Synthetic Spherical) Market Statistics and Insights, 2026
- Market Size Statistics
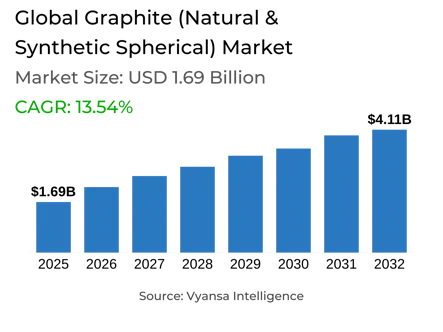
- Global Graphite (Natural & Synthetic Spherical) Market is estimated at $ 1.69 Billion.
- The market size is expected to grow to $ 4.11 Billion by 2032.
- Market to register a CAGR of around 13.54% during 2026-32.
- Type Shares
- Battery Anodes grabbed market share of 70%.
- Competition
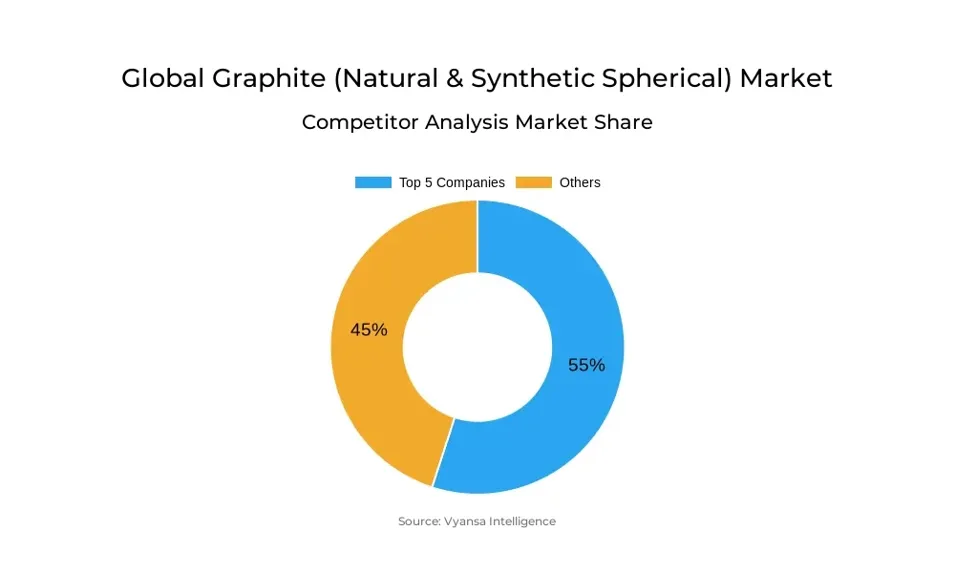
- More than 30 companies are actively engaged in producing Graphite (Natural & Synthetic Spherical).
- Top 5 companies acquired 50% of the market share.
- Imerys, Asbury Carbons, Superior Graphite, Syrah Resources, GrafTech International etc., are few of the top companies.
- Application
- Battery Anodes grabbed 55% of the market.
- Region
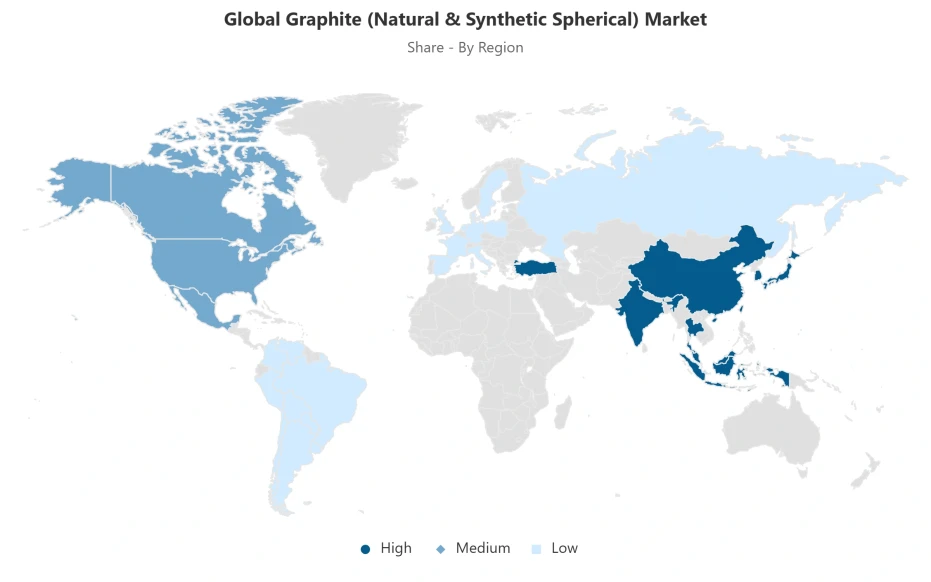
- Asia-Pacific leads with a 55% share of the Global Market.
Global Graphite (Natural & Synthetic Spherical) Market Outlook
The Global Graphite (Natural & Synthetic Spherical) Market is witnessing growth backed by the high speed of adoption of electric vehicles (EVs) and increasing renewable energy infrastructure. Every EV takes around 50 to 100 kilograms of graphite per battery pack, and hence, graphite is a vital material in lithium-ion batteries, where it constitutes nearly 95% of the anode. Global EV sales exceeded 14 million units in 2023, creating substantial demand for high-quality spherical graphite. This material’s excellent conductivity, chemical stability, and consistent particle morphology make it indispensable for both automotive and stationary energy storage applications, ensuring long-term market stability and growth.
The production of spherical graphite is technologically complex and cost-intensive. Turning natural flake graphite to battery-grade spherical graphite has an efficiency of only 30–45%, and it takes about three tons of natural graphite to make one ton of coated spherical graphite. The production is energy-intensive and utilizes chemicals such as hydrofluoric acid, which creates environmental and regulatory restrictions limiting production elsewhere except in China. Synthetic graphite manufacturing, despite providing high purity and accurate morphology, also has expensive energy costs and environmental impacts, thus highlighting the requirements for better technologies and efficient production processes.
Natural graphite remains the market leader, making up about 70% of global consumption because it is readily available and relatively inexpensive, while synthetic spherical graphite is used in specialized high-performance applications. Battery anodes remain the largest use segment with 55% of the market because of growing EV and large-scale energy storage system production. End users depend on graphite anodes for their stability, conductivity, and long cycle life, so they are critical to new battery technologies.
The Global Graphite (Natural & Synthetic Spherical) Market is valued at $1.69 billion in 2025 and is expected to grow to $4.11 billion by 2032. The market is dominated by Asia-Pacific, which is spearheaded by China, with 55% of the regional share in place of well-integrated production facilities, robust supply chains, and powerful EV battery manufacturing bases. Japan and South Korea also significantly contribute as prominent export markets. The confluence of increasing EV adoption, renewable energy growth, and continued technology advancements puts the graphite market on track for significant growth to meet cost-conscious as well as performance-driven end-user applications globally.
Global Graphite (Natural & Synthetic Spherical) Market Growth Driver
The worldwide electric vehicle (EV) boom is a key driver of spherical graphite demand. Every EV uses around 50 to 100 kilograms of graphite per battery pack, and thus graphite represents the biggest single material by weight in lithium-ion batteries. Graphite represents almost 95% of anode material, demonstrating its crucial function in battery performance. Worldwide EV sales were over 14 million units in 2023, driving big market momentum. The huge volume of existing demand finds expression in China's export of 25,500 tons of spherical graphite within the first eight months of 2024, highlighting the material's irreplaceable role in the supply chain for environmentally friendly transport. The critical characteristics of graphite in energy storage and automotive electrification render it an anchor material for end-consumers in EV and renewable energy industries.
The increasing take-up of EVs is immediately translated into strong demand for high-grade spherical graphite. With advances in battery technology, end users ever more strongly value consistent particle morphology and electrical conductivity to deliver maximum anode performance. The dominance of lithium-ion batteries by graphite further supports its status as a non-replaceable material, creating long-term market stability.
Global Graphite (Natural & Synthetic Spherical) Market Challenge
Producing spherical graphite is marked by high technological sophistication and high cost of production. It takes 30–45% efficiency to transform natural flake graphite to battery-grade spherical graphite, and three tons of natural graphite is needed to yield one ton of cleaned spherical coated graphite. The low recovery spurs prices of coated spherical graphite to over ten times those of micronized graphite concentrate. Second, graphitization requires energy-consuming operations, which topped at 27,000–28,000 yuan per tonne in early 2022, an increase of 76% from the levels in 2021. The process also entails aggressive chemicals such as hydrofluoric acid, increasing environmental and regulatory limitations affecting the volume of manufacturing capabilities outside China.
Synthetic graphite manufacturing is also beset by energy intensity and cost control issues. Increasing energy prices and strict environmental protection laws aggravate scalability issues in production, particularly for end customers who demand stable high-purity supplies. Such limitations underscore the importance of technology breakthroughs and process improvements for increased efficiency and lower environmental footprint. Both producers and end customers are working around these limitations while upholding battery application high-performance levels to ensure supply keeps pace with expanding world demand.
Unlock Market Intelligence
Explore the market potential with our data-driven report
Global Graphite (Natural & Synthetic Spherical) Market Opportunity
The construction of renewable energy infrastructure is generating huge demand for spherical graphite for use in energy storage. Effective anode materials are essential for utility-scale storage systems, and spherical graphite offers better conductivity, chemical stability, and cycling performance necessary for these uses. Demand for battery graphite stood at about 1.3 million tonnes in 2024, a 20% year-on-year increase, highlighting the growing size of end-user demands. Global policies and initiatives promoting renewable energy and EV take-up continue to strengthen long-term growth opportunities for spherical graphite.
Improvements in battery chemistry and energy storage materials are expanding the scope of graphite use from automotive batteries. Since EVs are expected to represent 30% of worldwide vehicle sales by 2030, end users come to rely more on high-performance graphite for both mobility and stationary energy storage applications. These trends make spherical graphite a strategic material for the development of energy storage infrastructure to support grid-scale and household energy systems and global decarbonization ambitions. The convergence of renewable energy and electrification efforts provides a sustainable and expanding industry for graphite suppliers and end consumers alike.
Global Graphite (Natural & Synthetic Spherical) Market Regional Analysis
By Region
- North America
- Latin America
- Europe
- Asia-Pacific
Asia-Pacific dominates the global market with a regional share of 55%, fueled by China's value-added production potential and gigantic downstream demand. The region enjoys strong supply chains connecting graphite mining, processing, and battery manufacturing. China has 28% of global graphite reserves and manufactures about 79% of global output, generating a large regional advantage in supply and production efficiency. Installed infrastructure facilitates routine supply of superior-quality material to automotive and energy storage end users.
China, Japan, and South Korea are primary consuming markets and are the leading EV battery manufacturing centers with widespread gigafactory activities. Domestic EV manufacturing in China fuels high-demand internal graphite, whereas Japan and South Korea are essential export markets. The dominance of the region is complemented by favorable government policies favoring electric mobility, highly developed production infrastructure, as well as tight interconnection of mining and processing operations. All these collectively make Asia-Pacific the focal point for spherical graphite supply and development, guaranteeing high growth for end customers.
Unlock Market Intelligence
Explore the market potential with our data-driven report
Global Graphite (Natural & Synthetic Spherical) Market Segmentation Analysis

By Type
- Natural (Flake/Amorphous)
- Synthetic Spherical Graphite
Natural (Flake/Amorphous) Graphite leads the market with about 70% of worldwide consumption benefiting from widespread availability of raw materials, cost advantages for production, and well-established mining infrastructure. It is well used in EV battery anodes, providing low-cost processing and consistent performance. Natural graphite remains popular with end users in cost-conscious applications and maintains minimum quality requirements to achieve target battery performance. Its market dominance is supported by established supply chains and vetted scalability in high-volume production settings.
Synthetic Spherical Graphite is favored in technical applications requiring greater purity and accurate particle morphology. Although production is more expensive, synthetic graphite enables end-users to achieve repeatable performance for advanced battery chemistries and high-performance energy storage products. By providing natural and synthetic types, the market caters to both cost-sensitive and high-performance segments, providing comprehensive coverage of end-user needs. Long-term adoption across a range of battery and energy storage technologies is facilitated by the dual-type approach while addressing changing quality standards.
By Application
- Battery Anodes
- Lubricants
- Refractories
- Fuel Cells
- Others
The largest market share under the Application category belongs to battery anodes with 55% of total demand. The success of the segment is fueled by high growth in EV manufacturing and megascale energy storage systems. Every vehicle and storage system demands considerable volumes of spherical graphite to make anodes, generating enormous volumes of demand. Graphite anodes confer vital attributes like high electrical conductivity, chemical stability, and long cycle life, which are essential to the efficiency of lithium-ion batteries and end-user experience.
Refractories are the second-largest application segment, followed by lubricants, fuel cells, and other niche applications that take up smaller shares of the market. The dominance of the battery anode segment also indicates the world's shift to sustainable energy technologies based on sophisticated storage solutions. The end users value high-performance graphite for its stability and efficiency, which has a direct impact on battery performance and reliability. The growth pattern of the segment closely follows the growth in increasing electrification trends in both automotive and stationary energy uses.
Top Companies in Global Graphite (Natural & Synthetic Spherical) Market
The top companies operating in the market include Imerys, Asbury Carbons, Superior Graphite, Syrah Resources, GrafTech International, Talga Group, BTR New Material, SGL Carbon, Nippon Graphite, Tokai Carbon, Northern Graphite, Graphite India, Mason Graphite, HEG Ltd., Tirupati Carbons, etc., are the top players operating in the Global Graphite (Natural & Synthetic Spherical) Market.
Frequently Asked Questions
Related Report
1. Market Segmentation
1.1. Research Scope
1.2. Research Methodology
1.3. Definitions and Assumptions
2. Executive Summary
3. Global Graphite (Natural & Synthetic Spherical) Market Policies, Regulations, and Standards
4. Global Graphite (Natural & Synthetic Spherical) Market Dynamics
4.1. Growth Factors
4.2. Challenges
4.3. Trends
4.4. Opportunities
5. Global Graphite (Natural & Synthetic Spherical) Market Statistics, 2022-2032F
5.1. Market Size & Growth Outlook
5.1.1.By Revenues in US$ Million
5.2. Market Segmentation & Growth Outlook
5.2.1.By Type
5.2.1.1. Natural (Flake/Amorphous)- Market Insights and Forecast 2022-2032, USD Million
5.2.1.2. Synthetic Spherical Graphite- Market Insights and Forecast 2022-2032, USD Million
5.2.2.By Application
5.2.2.1. Battery Anodes- Market Insights and Forecast 2022-2032, USD Million
5.2.2.2. Lubricants- Market Insights and Forecast 2022-2032, USD Million
5.2.2.3. Refractories- Market Insights and Forecast 2022-2032, USD Million
5.2.2.4. Fuel Cells- Market Insights and Forecast 2022-2032, USD Million
5.2.2.5. Others- Market Insights and Forecast 2022-2032, USD Million
5.2.3.By Technology
5.2.3.1. Hydrothermal- Market Insights and Forecast 2022-2032, USD Million
5.2.3.2. Mechanical- Market Insights and Forecast 2022-2032, USD Million
5.2.3.3. Chemical- Market Insights and Forecast 2022-2032, USD Million
5.2.4.By Sales Channel
5.2.4.1. Direct Sales- Market Insights and Forecast 2022-2032, USD Million
5.2.4.2. Online- Market Insights and Forecast 2022-2032, USD Million
5.2.4.3. Retail- Market Insights and Forecast 2022-2032, USD Million
5.2.5.By Region
5.2.5.1. North America
5.2.5.2. Latin America
5.2.5.3. Europe
5.2.5.4. Asia-Pacific
5.2.6.By Competitors
5.2.6.1. Competition Characteristics
5.2.6.2. Market Share & Analysis
6. North America Graphite (Natural & Synthetic Spherical) Market Statistics, 2022-2032F
6.1. Market Size & Growth Outlook
6.1.1.By Revenues in US$ Million
6.2. Market Segmentation & Growth Outlook
6.2.1.By Type- Market Insights and Forecast 2022-2032, USD Million
6.2.2.By Application- Market Insights and Forecast 2022-2032, USD Million
6.2.3.By Technology- Market Insights and Forecast 2022-2032, USD Million
6.2.4.By Sales Channel- Market Insights and Forecast 2022-2032, USD Million
6.2.5.By Country
6.2.5.1. USA
6.2.5.2. Canada
6.2.5.3. Mexico
6.2.5.4. Rest of North America
6.3. USA Graphite (Natural & Synthetic Spherical) Market Statistics, 2022-2032F
6.3.1.Market Size & Growth Outlook
6.3.1.1. By Revenues in US$ Million
6.3.2.Market Segmentation & Growth Outlook
6.3.2.1. By Type- Market Insights and Forecast 2022-2032, USD Million
6.3.2.2. By Sales Channel- Market Insights and Forecast 2022-2032, USD Million
6.4. Canada Graphite (Natural & Synthetic Spherical) Market Statistics, 2022-2032F
6.4.1.Market Size & Growth Outlook
6.4.1.1. By Revenues in US$ Million
6.4.2.Market Segmentation & Growth Outlook
6.4.2.1. By Type- Market Insights and Forecast 2022-2032, USD Million
6.4.2.2. By Sales Channel- Market Insights and Forecast 2022-2032, USD Million
6.5. Mexico Graphite (Natural & Synthetic Spherical) Market Statistics, 2022-2032F
6.5.1.Market Size & Growth Outlook
6.5.1.1. By Revenues in US$ Million
6.5.2.Market Segmentation & Growth Outlook
6.5.2.1. By Type- Market Insights and Forecast 2022-2032, USD Million
6.5.2.2. By Sales Channel- Market Insights and Forecast 2022-2032, USD Million
7. Latin America Graphite (Natural & Synthetic Spherical) Market Statistics, 2022-2032F
7.1. Market Size & Growth Outlook
7.1.1.By Revenues in US$ Million
7.2. Market Segmentation & Growth Outlook
7.2.1.By Type- Market Insights and Forecast 2022-2032, USD Million
7.2.2.By Application- Market Insights and Forecast 2022-2032, USD Million
7.2.3.By Technology- Market Insights and Forecast 2022-2032, USD Million
7.2.4.By Sales Channel- Market Insights and Forecast 2022-2032, USD Million
7.2.5.By Country
7.2.5.1. Brazil
7.2.5.2. Mexico
7.2.5.3. Rest of Latin America
7.3. Brazil Graphite (Natural & Synthetic Spherical) Market Statistics, 2022-2032F
7.3.1.Market Size & Growth Outlook
7.3.1.1. By Revenues in US$ Million
7.3.2.Market Segmentation & Growth Outlook
7.3.2.1. By Type- Market Insights and Forecast 2022-2032, USD Million
7.3.2.2. By Sales Channel- Market Insights and Forecast 2022-2032, USD Million
7.4. Mexico Graphite (Natural & Synthetic Spherical) Market Statistics, 2022-2032F
7.4.1.Market Size & Growth Outlook
7.4.1.1. By Revenues in US$ Million
7.4.2.Market Segmentation & Growth Outlook
7.4.2.1. By Type- Market Insights and Forecast 2022-2032, USD Million
7.4.2.2. By Sales Channel- Market Insights and Forecast 2022-2032, USD Million
8. Europe Graphite (Natural & Synthetic Spherical) Market Statistics, 2022-2032F
8.1. Market Size & Growth Outlook
8.1.1.By Revenues in US$ Million
8.2. Market Segmentation & Growth Outlook
8.2.1.By Type- Market Insights and Forecast 2022-2032, USD Million
8.2.2.By Application- Market Insights and Forecast 2022-2032, USD Million
8.2.3.By Technology- Market Insights and Forecast 2022-2032, USD Million
8.2.4.By Sales Channel- Market Insights and Forecast 2022-2032, USD Million
8.2.5.By Country
8.2.5.1. Germany
8.2.5.2. France
8.2.5.3. UK
8.2.5.4. Spain
8.2.5.5. Italy
8.2.5.6. Russia
8.2.5.7. Netherlands
8.2.5.8. Belgium
8.2.5.9. Poland
8.2.5.10. Turkey
8.2.5.11. Rest of Europe
8.3. Germany Graphite (Natural & Synthetic Spherical) Market Statistics, 2022-2032F
8.3.1. Market Size & Growth Outlook
8.3.1.1. By Revenues in US$ Million
8.3.2.Market Segmentation & Growth Outlook
8.3.2.1. By Type- Market Insights and Forecast 2022-2032, USD Million
8.3.2.2. By Sales Channel- Market Insights and Forecast 2022-2032, USD Million
8.4. France Graphite (Natural & Synthetic Spherical) Market Statistics, 2022-2032F
8.4.1.Market Size & Growth Outlook
8.4.1.1. By Revenues in US$ Million
8.4.2.Market Segmentation & Growth Outlook
8.4.2.1. By Type- Market Insights and Forecast 2022-2032, USD Million
8.4.2.2. By Sales Channel- Market Insights and Forecast 2022-2032, USD Million
8.5. UK Graphite (Natural & Synthetic Spherical) Market Statistics, 2022-2032F
8.5.1.Market Size & Growth Outlook
8.5.1.1. By Revenues in US$ Million
8.5.2.Market Segmentation & Growth Outlook
8.5.2.1. By Type- Market Insights and Forecast 2022-2032, USD Million
8.5.2.2. By Sales Channel- Market Insights and Forecast 2022-2032, USD Million
8.6. Spain Graphite (Natural & Synthetic Spherical) Market Statistics, 2022-2032F
8.6.1.Market Size & Growth Outlook
8.6.1.1. By Revenues in US$ Million
8.6.2.Market Segmentation & Growth Outlook
8.6.2.1. By Type- Market Insights and Forecast 2022-2032, USD Million
8.6.2.2. By Sales Channel- Market Insights and Forecast 2022-2032, USD Million
8.7. Italy Graphite (Natural & Synthetic Spherical) Market Statistics, 2022-2032F
8.7.1.Market Size & Growth Outlook
8.7.1.1. By Revenues in US$ Million
8.7.2.Market Segmentation & Growth Outlook
8.7.2.1. By Type- Market Insights and Forecast 2022-2032, USD Million
8.7.2.2. By Sales Channel- Market Insights and Forecast 2022-2032, USD Million
8.8. Russia Graphite (Natural & Synthetic Spherical) Market Statistics, 2022-2032F
8.8.1.Market Size & Growth Outlook
8.8.1.1. By Revenues in US$ Million
8.8.2.Market Segmentation & Growth Outlook
8.8.2.1. By Type- Market Insights and Forecast 2022-2032, USD Million
8.8.2.2. By Sales Channel- Market Insights and Forecast 2022-2032, USD Million
8.9. Netherlands Graphite (Natural & Synthetic Spherical) Market Statistics, 2022-2032F
8.9.1.Market Size & Growth Outlook
8.9.1.1. By Revenues in US$ Million
8.9.2.Market Segmentation & Growth Outlook
8.9.2.1. By Type- Market Insights and Forecast 2022-2032, USD Million
8.9.2.2. By Sales Channel- Market Insights and Forecast 2022-2032, USD Million
8.10. Belgium Graphite (Natural & Synthetic Spherical) Market Statistics, 2022-2032F
8.10.1. Market Size & Growth Outlook
8.10.1.1. By Revenues in US$ Million
8.10.2. Market Segmentation & Growth Outlook
8.10.2.1. By Type- Market Insights and Forecast 2022-2032, USD Million
8.10.2.2. By Sales Channel- Market Insights and Forecast 2022-2032, USD Million
8.11. Poland Graphite (Natural & Synthetic Spherical) Market Statistics, 2022-2032F
8.11.1. Market Size & Growth Outlook
8.11.1.1. By Revenues in US$ Million
8.11.2. Market Segmentation & Growth Outlook
8.11.2.1. By Type- Market Insights and Forecast 2022-2032, USD Million
8.11.2.2. By Sales Channel- Market Insights and Forecast 2022-2032, USD Million
8.12. Turkey Graphite (Natural & Synthetic Spherical) Market Statistics, 2022-2032F
8.12.1. Market Size & Growth Outlook
8.12.1.1. By Revenues in US$ Million
8.12.2. Market Segmentation & Growth Outlook
8.12.2.1. By Type- Market Insights and Forecast 2022-2032, USD Million
8.12.2.2. By Sales Channel- Market Insights and Forecast 2022-2032, USD Million
9. Asia-Pacific Graphite (Natural & Synthetic Spherical) Market Statistics, 2022-2032F
9.1. Market Size & Growth Outlook
9.1.1.By Revenues in US$ Million
9.2. Market Segmentation & Growth Outlook
9.2.1.By Type- Market Insights and Forecast 2022-2032, USD Million
9.2.2.By Application- Market Insights and Forecast 2022-2032, USD Million
9.2.3.By Technology- Market Insights and Forecast 2022-2032, USD Million
9.2.4.By Sales Channel- Market Insights and Forecast 2022-2032, USD Million
9.2.5.By Country
9.2.5.1. China
9.2.5.2. Japan
9.2.5.3. South Korea
9.2.5.4. India
9.2.5.5. Australia
9.2.5.6. Thailand
9.2.5.7. Rest of Asia-Pacific
9.3. China Graphite (Natural & Synthetic Spherical) Market Statistics, 2022-2032F
9.3.1.Market Size & Growth Outlook
9.3.1.1. By Revenues in US$ Million
9.3.2.Market Segmentation & Growth Outlook
9.3.2.1. By Type- Market Insights and Forecast 2022-2032, USD Million
9.3.2.2. By Sales Channel- Market Insights and Forecast 2022-2032, USD Million
9.4. Japan Graphite (Natural & Synthetic Spherical) Market Statistics, 2022-2032F
9.4.1.Market Size & Growth Outlook
9.4.1.1. By Revenues in US$ Million
9.4.2.Market Segmentation & Growth Outlook
9.4.2.1. By Type- Market Insights and Forecast 2022-2032, USD Million
9.4.2.2. By Sales Channel- Market Insights and Forecast 2022-2032, USD Million
9.5. South Korea Graphite (Natural & Synthetic Spherical) Market Statistics, 2022-2032F
9.5.1.Market Size & Growth Outlook
9.5.1.1. By Revenues in US$ Million
9.5.2.Market Segmentation & Growth Outlook
9.5.2.1. By Type- Market Insights and Forecast 2022-2032, USD Million
9.5.2.2. By Sales Channel- Market Insights and Forecast 2022-2032, USD Million
9.6. India Graphite (Natural & Synthetic Spherical) Market Statistics, 2022-2032F
9.6.1.Market Size & Growth Outlook
9.6.1.1. By Revenues in US$ Million
9.6.2.Market Segmentation & Growth Outlook
9.6.2.1. By Type- Market Insights and Forecast 2022-2032, USD Million
9.6.2.2. By Sales Channel- Market Insights and Forecast 2022-2032, USD Million
9.7. Australia Graphite (Natural & Synthetic Spherical) Market Statistics, 2022-2032F
9.7.1.Market Size & Growth Outlook
9.7.1.1. By Revenues in US$ Million
9.7.2.Market Segmentation & Growth Outlook
9.7.2.1. By Type- Market Insights and Forecast 2022-2032, USD Million
9.7.2.2. By Sales Channel- Market Insights and Forecast 2022-2032, USD Million
9.8. Thailand Graphite (Natural & Synthetic Spherical) Market Statistics, 2022-2032F
9.8.1.Market Size & Growth Outlook
9.8.1.1. By Revenues in US$ Million
9.8.2.Market Segmentation & Growth Outlook
9.8.2.1. By Type- Market Insights and Forecast 2022-2032, USD Million
9.8.2.2. By Sales Channel- Market Insights and Forecast 2022-2032, USD Million
10. Competitive Outlook
10.1. Company Profiles
10.1.1. Syrah Resources
10.1.1.1. Business Description
10.1.1.2. Product Portfolio
10.1.1.3. Collaborations & Alliances
10.1.1.4. Recent Developments
10.1.1.5. Financial Details
10.1.1.6. Others
10.1.2. GrafTech International
10.1.2.1. Business Description
10.1.2.2. Product Portfolio
10.1.2.3. Collaborations & Alliances
10.1.2.4. Recent Developments
10.1.2.5. Financial Details
10.1.2.6. Others
10.1.3. Talga Group
10.1.3.1. Business Description
10.1.3.2. Product Portfolio
10.1.3.3. Collaborations & Alliances
10.1.3.4. Recent Developments
10.1.3.5. Financial Details
10.1.3.6. Others
10.1.4. BTR New Material
10.1.4.1. Business Description
10.1.4.2. Product Portfolio
10.1.4.3. Collaborations & Alliances
10.1.4.4. Recent Developments
10.1.4.5. Financial Details
10.1.4.6. Others
10.1.5. SGL Carbon
10.1.5.1. Business Description
10.1.5.2. Product Portfolio
10.1.5.3. Collaborations & Alliances
10.1.5.4. Recent Developments
10.1.5.5. Financial Details
10.1.5.6. Others
10.1.6. Imerys
10.1.6.1. Business Description
10.1.6.2. Product Portfolio
10.1.6.3. Collaborations & Alliances
10.1.6.4. Recent Developments
10.1.6.5. Financial Details
10.1.6.6. Others
10.1.7. Asbury Carbons
10.1.7.1. Business Description
10.1.7.2. Product Portfolio
10.1.7.3. Collaborations & Alliances
10.1.7.4. Recent Developments
10.1.7.5. Financial Details
10.1.7.6. Others
10.1.8. Superior Graphite
10.1.8.1. Business Description
10.1.8.2. Product Portfolio
10.1.8.3. Collaborations & Alliances
10.1.8.4. Recent Developments
10.1.8.5. Financial Details
10.1.8.6. Others
10.1.9. Nippon Graphite
10.1.9.1. Business Description
10.1.9.2. Product Portfolio
10.1.9.3. Collaborations & Alliances
10.1.9.4. Recent Developments
10.1.9.5. Financial Details
10.1.9.6. Others
10.1.10. Tokai Carbon
10.1.10.1.Business Description
10.1.10.2.Product Portfolio
10.1.10.3.Collaborations & Alliances
10.1.10.4.Recent Developments
10.1.10.5.Financial Details
10.1.10.6.Others
10.1.11. Northern Graphite
10.1.11.1.Business Description
10.1.11.2.Product Portfolio
10.1.11.3.Collaborations & Alliances
10.1.11.4.Recent Developments
10.1.11.5.Financial Details
10.1.11.6.Others
10.1.12. Graphite India
10.1.12.1.Business Description
10.1.12.2.Product Portfolio
10.1.12.3.Collaborations & Alliances
10.1.12.4.Recent Developments
10.1.12.5.Financial Details
10.1.12.6.Others
10.1.13. Mason Graphite
10.1.13.1.Business Description
10.1.13.2.Product Portfolio
10.1.13.3.Collaborations & Alliances
10.1.13.4.Recent Developments
10.1.13.5.Financial Details
10.1.13.6.Others
10.1.14. HEG Ltd.
10.1.14.1.Business Description
10.1.14.2.Product Portfolio
10.1.14.3.Collaborations & Alliances
10.1.14.4.Recent Developments
10.1.14.5.Financial Details
10.1.14.6.Others
10.1.15. Tirupati Carbons
10.1.15.1.Business Description
10.1.15.2.Product Portfolio
10.1.15.3.Collaborations & Alliances
10.1.15.4.Recent Developments
10.1.15.5.Financial Details
10.1.15.6.Others
11. Disclaimer
| Segment | Sub-Segment |
|---|---|
| By Type |
|
| By Application |
|
| By Technology |
|
| By Sales Channel |
|
| By Region |
|
Research Methodology
This study followed a structured approach comprising four key phases to assess the size and scope of the electro-oxidation market. The process began with thorough secondary research to collect data on the target market, related markets, and broader industry context. These findings, along with preliminary assumptions and estimates, were then validated through extensive primary research involving industry experts from across the value chain. To calculate the overall market size, both top-down and bottom-up methodologies were employed. Finally, market segmentation and data triangulation techniques were applied to refine and validate segment-level estimations.
Secondary Research
The secondary research phase involved gathering data from a wide range of credible and published sources. This step helped in identifying industry trends, defining market segmentation, and understanding the market landscape and value chain.
Sources consulted during this phase included:
- Company annual reports, investor presentations, and press releases
- Industry white papers and certified publications
- Trade directories and market-recognized databases
- Articles from authoritative authors and reputable journals
- Gold and silver standard websites
Secondary research was critical in mapping out the industry's value chain and monetary flow, identifying key market segments, understanding regional variations, and tracking significant industry developments.
Other key sources:
- Financial disclosures
- Industry associations and trade bodies
- News outlets and business magazines
- Academic journals and research studies
- Paid industry databases
Primary Research
To validate secondary data and gain deeper market insights, primary research was conducted with key stakeholders across both the supply and demand sides of the market.
On the demand side, participants included decision-makers and influencers from end-user industries—such as CIOs, CTOs, and CSOs—who provided first-hand perspectives on market needs, product usage, and future expectations.
On the supply side, interviews were conducted with manufacturers, industry associations, and institutional participants to gather insights into current offerings, product pipelines, and market challenges.
Primary interviews provided critical inputs such as:
- Market size and revenue data
- Product and service breakdowns
- Market forecasts
- Regional and application-specific trends
Stakeholders consulted included:
- Leading OEM and solution providers
- Channel and distribution partners
- End users across various applications
- Independent consultants and industry specialists
Market Size Estimation and Data Triangulation
- Identifying Key Market Participants (Secondary Research)
- Goal: To identify the major players or companies in the target market. This typically involves using publicly available data sources such as industry reports, market research publications, and financial statements of companies.
- Tools: Reports from firms like Gartner, Forrester, Euromonitor, Statista, IBISWorld, and others. Public financial statements, news articles, and press releases from top market players.
- Extracting Earnings of Key Market Participants
- Goal: To estimate the earnings generated from the product or service being analyzed. This step helps in understanding the revenue potential of each market player in a specific geography.
- Methods: Earnings data can be gathered from:
- Publicly available financial reports (for listed companies).
- Interviews and primary data sources from professionals, such as Directors, VPs, SVPs, etc. This is especially useful for understanding more nuanced, internal data that isn't publicly disclosed.
- Annual reports and investor presentations of key players.
- Data Collation and Development of a Relevant Data Model
- Goal: To collate inputs from both primary and secondary sources into a structured, data-driven model for market estimation. This model will incorporate key market KPIs and any independent variables relevant to the market.
- Key KPIs: These could include:
- Market size, growth rate, and demand drivers.
- Industry-specific metrics like market share, average revenue per customer (ARPC), or average deal size.
- External variables, such as economic growth rates, inflation rates, or commodity prices, that could affect the market.
- Data Modeling: Based on this data, the market forecasts are developed for the next 5 years. A combination of trend analysis, scenario modeling, and statistical regression might be used to generate projections.
- Scenario Analysis
- Goal: To test different assumptions and validate how sensitive the market is to changes in key variables (e.g., market demand, regulatory changes, technological disruptions).
- Types of Scenarios:
- Base Case: Based on current assumptions and historical data.
- Best-Case Scenario: Assuming favorable market conditions, regulatory environments, and technological advancements.
- Worst-Case Scenario: Accounting for adverse factors, such as economic downturns, stricter regulations, or unexpected disruptions.


