Europe Compound Feed Market Report: Trends, Growth and Forecast (2026-2032)
By Animal Type (Ruminants, Poultry, Swine, Aquaculture, Others), By Ingredient (Grains & Cereals, Cakes & Meals, Oilseeds & Derivatives, Fish Meal & Fish Oil), By Supplements (Vitamins, Amino Acid, Enzymes, Prebiotics & Probiotics, Acidifiers, Others), By Form (Mash, Pellets, Crumbles), By Sales Channel (Online, Retail, Direct Sales), By Country (UK, France, Spain, Germany, Italy, Russia, Sweden, Denmark, Netherlands, Rest of Europe) ... Read more

|
Major Players
|
Europe Compound Feed Market Statistics and Insights, 2026
- Market Size Statistics
- Europe Compound Feed Market is estimated at $ 105 Billion.
- The market size is expected to grow to $ 130 Billion by 2032.
- Market to register a CAGR of around 3.1% during 2026-32.
- Animal Type Segment
- Ruminants continues to dominate the market.
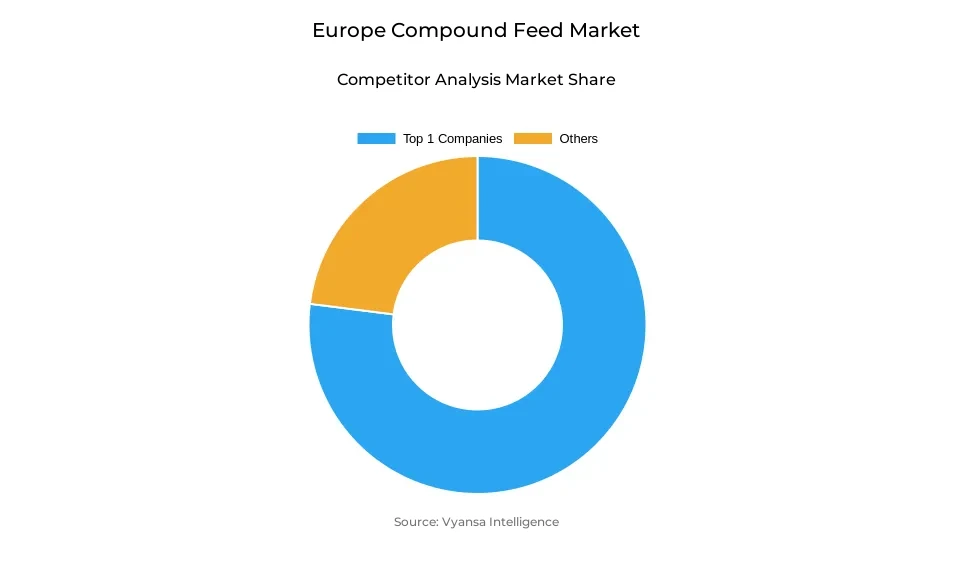
- Competition
- More than 15 companies are actively engaged in producing Compound Feed in Europe.
- Top 10 companies acquired the maximum share of the market.
- ForFarmers, BASF SE, Nutreco NV, Alltech, Biomin etc., are few of the top companies.
- Ingredient Type
- Grains & Cereals continues to dominate the market.
- Country
- Spain emerges as the leading market.
Europe Compound Feed Market Outlook
The Europe Compound Feed Market is estimated at USD 105 billion in 2024 and is likely to reach USD 130 billion by 2030, led by growing demand for specialized and sustainable feed solutions. The largest share is held by ruminants, fueled by their foundational role in the beef and dairy industries, which need predictable, high-quality diets to increase productivity and animal health. Aquaculture is growing as the most rapidly expanding segment, driven by world demand for seafood and by innovation in environmentally sound aquafeed formulations acceptable both environmentally and nutritionally.
Yet, the market has some challenges. Small farmers in underdeveloped areas tend to have limited access to proper knowledge, infrastructure, and technical skills, hindering the application of contemporary feed practices. Unpredictable raw material prices for grains, oilseeds, and proteins based on climate volatility, worldwide supply chain vulnerabilities, and geopolitical tensions impose cost burdens. These pressures, together with regulatory regulations imposed by the government, limit producers' profit margins as well as create operational barriers.
Sustainability patterns are transforming the market environment. The increasing awareness of the environment and consumer demand for green and ethical operations are fueling the transition to plant-based proteins and substitute ingredients like insect protein, algae-based material, and by-products from the food industry. Initiatives such as the European Green Deal and Farm to Fork strategy are speeding up innovation in feed manufacturing, serving both environmental and economic effectiveness.
Geographically, Spain dominates the market with a firm feed industry bolstered by leading manufacturing technologies and a complex of small- and medium-sized mills supplying varied livestock. The market is also driven by increasing meat consumption in the countries of Germany, France, Spain, and the UK, where demand for high-protein diets continues to be robust under economic constraints.
Europe Compound Feed Market Challenge
Rising Operational and Input Cost Pressures Hindering Market Growth
The main problem is the absence of knowledge and information among small-scale farmers in underdeveloped economies. The unavailability of infrastructure facilities and technical knowledge, particularly in underdeveloped areas, hinders effective implementation of new feed practices. The shortages impede the overall rate of growth since farmers are not able to maximize production and utilize resources efficiently.
Growing raw material prices further aggravate the issue. Grains, oilseeds, and proteins costs are subject to change with climatic variations, worldwide supply chain breakdowns, and international tensions. Such cost changes directly affect feed production costs, which shrink producers' profit margins and increase farmers' prices. Tight government controls over compound feed manufacturing add additional operational challenges, hindering the market's ability to achieve steady growth.
Europe Compound Feed Market Trend
Shift Towards Sustainable and Plant-Based Feed Ingredients
The Europe compound feed market is experiencing an increasing demand for plant-based and sustainable feed ingredients. Environmental consciousness and consumers' changing attitudes toward ethical and green practices are compelling the move toward alternative proteins, particularly plant-based protein sources. In December 2024, EU feed manufacture amounts to 147 million tons, and FEFAC mentions that industrial compound feed production increases by 0.50%, determined by economic, regulatory, environmental, and animal health criteria.
Regulatory policies like the European Green Deal and the Farm to Fork strategy promote the lowering of carbon emissions and an increase in biodiversity. This is driving feed businesses to look into plant protein technologies and other sustainable options like insect protein, algal-derived ingredients, and food industry by-products like fruit pulp and brewers' grains. These are supporting environmental objectives as well as economic efficiency with less food waste.
Unlock Market Intelligence
Explore the market potential with our data-driven report
Europe Compound Feed Market Country Analysis
Spain leads the Europe compound feed market on the back of a robust feed industry with numerous active companies and a sizeable workforce. The sector has attracted major international players, which are increasing their presence further. Advances in technology used in feed manufacturing and a system of small- to medium-sized mills with varying livestock activities have fueled the growth further. Much of the production is destined for export markets, mainly feed and cattle.
The market is boosted by increasing demand for high-protein diets, backed by increasing incomes in major markets like Russia and Germany. Rising global meat consumption is fueling greater standards of quality, with Poland dominating chicken production in the region. Meat demand in Germany, France, Spain, and the UK will continue to grow steadily despite economic adversities, backed by shifting diets, population growth, and economic prosperity.
Unlock Market Intelligence
Explore the market potential with our data-driven report
Europe Compound Feed Market Segmentation Analysis
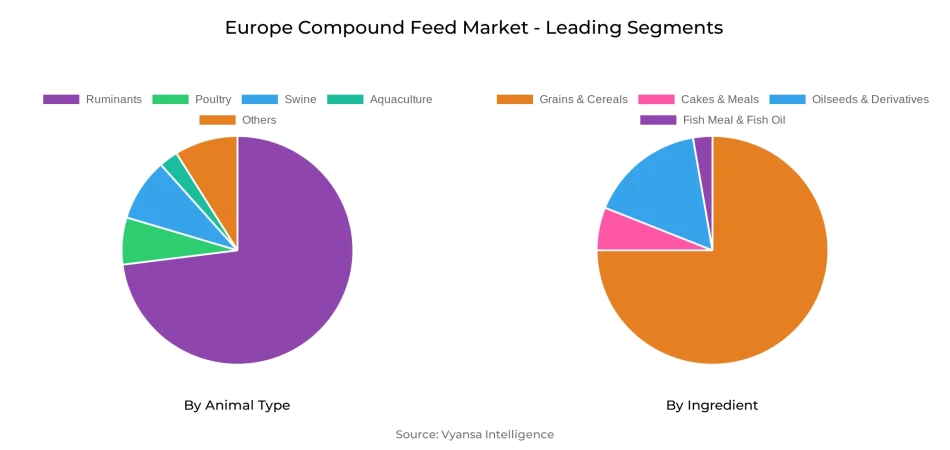
By Animal Type
- Ruminants
- Poultry
- Swine
- Aquaculture
- Others
The most prominent market share from the Animal Type segment is that of Ruminants. Their dominance can be traced to their critical position in the beef and dairy sectors, where there is always a demand for expert feed solutions to enhance productivity and support animal health. The consistent demand from these industries guarantees the robust consumption of compound feed and hence contributes to overall market growth.
Aquaculture is the fastest-growing sector in the Europe Compound Feed Market. Its growth is stimulated by rising global demand for seafood and innovation in sustainable aquafeed formulations. These developments promote efficiency in fish farming while ensuring environmental and nutritional requirements, thus creating tremendous growth prospects for the sector between 2025–2030.
Top Companies in Europe Compound Feed Market
The top companies operating in the market include ForFarmers, BASF SE, Nutreco NV, Alltech, Biomin, Kemin Industries, Inc., ADM Animal Nutrition, Cargill, Incorporated, Yara International ASA, Evonik Industries AG, Land O’Lakes Inc., Lallemand Inc, etc., are the top players operating in the Europe Compound Feed Market.
Frequently Asked Questions
Related Report
1. Market Segmentation
1.1. Research Scope
1.2. Research Methodology
1.3. Definitions and Assumptions
2. Executive Summary
3. Europe Compound Feed Market Policies, Regulations, and Standards
4. Europe Compound Feed Market Dynamics
4.1. Growth Factors
4.2. Challenges
4.3. Trends
4.4. Opportunities
5. Europe Compound Feed Market Statistics, 2020-2030F
5.1. Market Size & Growth Outlook
5.1.1.By Revenues in US$ Million
5.1.2.By Quantity Sold in Thousand Tons
5.2. Market Segmentation & Growth Outlook
5.2.1.By Animal Type
5.2.1.1. Ruminants- Market Insights and Forecast 2020-2030, USD Million
5.2.1.2. Poultry- Market Insights and Forecast 2020-2030, USD Million
5.2.1.3. Swine- Market Insights and Forecast 2020-2030, USD Million
5.2.1.4. Aquaculture- Market Insights and Forecast 2020-2030, USD Million
5.2.1.5. Others- Market Insights and Forecast 2020-2030, USD Million
5.2.2.By Ingredient
5.2.2.1. Grains & Cereals- Market Insights and Forecast 2020-2030, USD Million
5.2.2.2. Cakes & Meals- Market Insights and Forecast 2020-2030, USD Million
5.2.2.3. Oilseeds & Derivatives- Market Insights and Forecast 2020-2030, USD Million
5.2.2.4. Fish Meal & Fish Oil- Market Insights and Forecast 2020-2030, USD Million
5.2.3.By Supplements
5.2.3.1. Vitamins- Market Insights and Forecast 2020-2030, USD Million
5.2.3.2. Amino Acid- Market Insights and Forecast 2020-2030, USD Million
5.2.3.3. Enzymes- Market Insights and Forecast 2020-2030, USD Million
5.2.3.4. Prebiotics & Probiotics- Market Insights and Forecast 2020-2030, USD Million
5.2.3.5. Acidifiers- Market Insights and Forecast 2020-2030, USD Million
5.2.3.6. Others- Market Insights and Forecast 2020-2030, USD Million
5.2.4.By Form
5.2.4.1. Mash- Market Insights and Forecast 2020-2030, USD Million
5.2.4.2. Pellets- Market Insights and Forecast 2020-2030, USD Million
5.2.4.3. Crumbles- Market Insights and Forecast 2020-2030, USD Million
5.2.5.By Sales Channel
5.2.5.1. Online- Market Insights and Forecast 2020-2030, USD Million
5.2.5.2. Retail- Market Insights and Forecast 2020-2030, USD Million
5.2.5.3. Direct Sales- Market Insights and Forecast 2020-2030, USD Million
5.2.6.By Country
5.2.6.1. UK
5.2.6.2. France
5.2.6.3. Spain
5.2.6.4. Germany
5.2.6.5. Italy
5.2.6.6. Russia
5.2.6.7. Sweden
5.2.6.8. Denmark
5.2.6.9. Netherlands
5.2.6.10. Rest of Europe
5.2.7.By Competitors
5.2.7.1. Competition Characteristics
5.2.7.2. Market Share & Analysis
6. UK Compound Feed Market Statistics, 2020-2030F
6.1. Market Size & Growth Outlook
6.1.1.By Revenues in US$ Million
6.1.2.By Quantity Sold in Thousand Tons
6.2. Market Segmentation & Growth Outlook
6.2.1.By Animal Type- Market Insights and Forecast 2020-2030, USD Million
6.2.2.By Ingredient- Market Insights and Forecast 2020-2030, USD Million
6.2.3.By Supplements- Market Insights and Forecast 2020-2030, USD Million
6.2.4.By Form- Market Insights and Forecast 2020-2030, USD Million
6.2.5.By Sales Channel- Market Insights and Forecast 2020-2030, USD Million
7. France Compound Feed Market Statistics, 2020-2030F
7.1. Market Size & Growth Outlook
7.1.1.By Revenues in US$ Million
7.1.2.By Quantity Sold in Thousand Tons
7.2. Market Segmentation & Growth Outlook
7.2.1.By Animal Type- Market Insights and Forecast 2020-2030, USD Million
7.2.2.By Ingredient- Market Insights and Forecast 2020-2030, USD Million
7.2.3.By Supplements- Market Insights and Forecast 2020-2030, USD Million
7.2.4.By Form- Market Insights and Forecast 2020-2030, USD Million
7.2.5.By Sales Channel- Market Insights and Forecast 2020-2030, USD Million
8. Spain Compound Feed Market Statistics, 2020-2030F
8.1. Market Size & Growth Outlook
8.1.1.By Revenues in US$ Million
8.1.2.By Quantity Sold in Thousand Tons
8.2. Market Segmentation & Growth Outlook
8.2.1.By Animal Type- Market Insights and Forecast 2020-2030, USD Million
8.2.2.By Ingredient- Market Insights and Forecast 2020-2030, USD Million
8.2.3.By Supplements- Market Insights and Forecast 2020-2030, USD Million
8.2.4.By Form- Market Insights and Forecast 2020-2030, USD Million
8.2.5.By Sales Channel- Market Insights and Forecast 2020-2030, USD Million
9. Germany Compound Feed Market Statistics, 2020-2030F
9.1. Market Size & Growth Outlook
9.1.1.By Revenues in US$ Million
9.1.2.By Quantity Sold in Thousand Tons
9.2. Market Segmentation & Growth Outlook
9.2.1.By Animal Type- Market Insights and Forecast 2020-2030, USD Million
9.2.2.By Ingredient- Market Insights and Forecast 2020-2030, USD Million
9.2.3.By Supplements- Market Insights and Forecast 2020-2030, USD Million
9.2.4.By Form- Market Insights and Forecast 2020-2030, USD Million
9.2.5.By Sales Channel- Market Insights and Forecast 2020-2030, USD Million
10. Italy Compound Feed Market Statistics, 2020-2030F
10.1. Market Size & Growth Outlook
10.1.1. By Revenues in US$ Million
10.1.2. By Quantity Sold in Thousand Tons
10.2. Market Segmentation & Growth Outlook
10.2.1. By Animal Type- Market Insights and Forecast 2020-2030, USD Million
10.2.2. By Ingredient- Market Insights and Forecast 2020-2030, USD Million
10.2.3. By Supplements- Market Insights and Forecast 2020-2030, USD Million
10.2.4. By Form- Market Insights and Forecast 2020-2030, USD Million
10.2.5. By Sales Channel- Market Insights and Forecast 2020-2030, USD Million
11. Russia Compound Feed Market Statistics, 2020-2030F
11.1. Market Size & Growth Outlook
11.1.1. By Revenues in US$ Million
11.1.2. By Quantity Sold in Thousand Tons
11.2. Market Segmentation & Growth Outlook
11.2.1. By Animal Type- Market Insights and Forecast 2020-2030, USD Million
11.2.2. By Ingredient- Market Insights and Forecast 2020-2030, USD Million
11.2.3. By Supplements- Market Insights and Forecast 2020-2030, USD Million
11.2.4. By Form- Market Insights and Forecast 2020-2030, USD Million
11.2.5. By Sales Channel- Market Insights and Forecast 2020-2030, USD Million
12. Sweden Compound Feed Market Statistics, 2020-2030F
12.1. Market Size & Growth Outlook
12.1.1. By Revenues in US$ Million
12.1.2. By Quantity Sold in Thousand Tons
12.2. Market Segmentation & Growth Outlook
12.2.1. By Animal Type- Market Insights and Forecast 2020-2030, USD Million
12.2.2. By Ingredient- Market Insights and Forecast 2020-2030, USD Million
12.2.3. By Supplements- Market Insights and Forecast 2020-2030, USD Million
12.2.4. By Form- Market Insights and Forecast 2020-2030, USD Million
12.2.5. By Sales Channel- Market Insights and Forecast 2020-2030, USD Million
13. Denmark Compound Feed Market Statistics, 2020-2030F
13.1. Market Size & Growth Outlook
13.1.1. By Revenues in US$ Million
13.1.2. By Quantity Sold in Thousand Tons
13.2. Market Segmentation & Growth Outlook
13.2.1. By Animal Type- Market Insights and Forecast 2020-2030, USD Million
13.2.2. By Ingredient- Market Insights and Forecast 2020-2030, USD Million
13.2.3. By Supplements- Market Insights and Forecast 2020-2030, USD Million
13.2.4. By Form- Market Insights and Forecast 2020-2030, USD Million
13.2.5. By Sales Channel- Market Insights and Forecast 2020-2030, USD Million
14. Netherlands Compound Feed Market Statistics, 2020-2030F
14.1. Market Size & Growth Outlook
14.1.1. By Revenues in US$ Million
14.1.2. By Quantity Sold in Thousand Tons
14.2. Market Segmentation & Growth Outlook
14.2.1. By Animal Type- Market Insights and Forecast 2020-2030, USD Million
14.2.2. By Ingredient- Market Insights and Forecast 2020-2030, USD Million
14.2.3. By Supplements- Market Insights and Forecast 2020-2030, USD Million
14.2.4. By Form- Market Insights and Forecast 2020-2030, USD Million
14.2.5. By Sales Channel- Market Insights and Forecast 2020-2030, USD Million
15. Competitive Outlook
15.1. Company Profiles
15.1.1. Alltech
15.1.1.1. Business Description
15.1.1.2. Product Portfolio
15.1.1.3. Collaborations & Alliances
15.1.1.4. Recent Developments
15.1.1.5. Financial Details
15.1.1.6. Others
15.1.2. Biomin
15.1.2.1. Business Description
15.1.2.2. Product Portfolio
15.1.2.3. Collaborations & Alliances
15.1.2.4. Recent Developments
15.1.2.5. Financial Details
15.1.2.6. Others
15.1.3. Kemin Industries, Inc.
15.1.3.1. Business Description
15.1.3.2. Product Portfolio
15.1.3.3. Collaborations & Alliances
15.1.3.4. Recent Developments
15.1.3.5. Financial Details
15.1.3.6. Others
15.1.4. ADM Animal Nutrition
15.1.4.1. Business Description
15.1.4.2. Product Portfolio
15.1.4.3. Collaborations & Alliances
15.1.4.4. Recent Developments
15.1.4.5. Financial Details
15.1.4.6. Others
15.1.5. Cargill, Incorporated
15.1.5.1. Business Description
15.1.5.2. Product Portfolio
15.1.5.3. Collaborations & Alliances
15.1.5.4. Recent Developments
15.1.5.5. Financial Details
15.1.5.6. Others
15.1.6. ForFarmers
15.1.6.1. Business Description
15.1.6.2. Product Portfolio
15.1.6.3. Collaborations & Alliances
15.1.6.4. Recent Developments
15.1.6.5. Financial Details
15.1.6.6. Others
15.1.7. BASF SE
15.1.7.1. Business Description
15.1.7.2. Product Portfolio
15.1.7.3. Collaborations & Alliances
15.1.7.4. Recent Developments
15.1.7.5. Financial Details
15.1.7.6. Others
15.1.8. Nutreco NV
15.1.8.1. Business Description
15.1.8.2. Product Portfolio
15.1.8.3. Collaborations & Alliances
15.1.8.4. Recent Developments
15.1.8.5. Financial Details
15.1.8.6. Others
15.1.9. Yara International ASA
15.1.9.1. Business Description
15.1.9.2. Product Portfolio
15.1.9.3. Collaborations & Alliances
15.1.9.4. Recent Developments
15.1.9.5. Financial Details
15.1.9.6. Others
15.1.10. Evonik Industries AG
15.1.10.1.Business Description
15.1.10.2.Product Portfolio
15.1.10.3.Collaborations & Alliances
15.1.10.4.Recent Developments
15.1.10.5.Financial Details
15.1.10.6.Others
16. Disclaimer
| Segment | Sub-Segment |
|---|---|
| By Animal Type |
|
| By Ingredient |
|
| By Supplements |
|
| By Form |
|
| By Sales Channel |
|
| By Country |
|
Research Methodology
This study followed a structured approach comprising four key phases to assess the size and scope of the electro-oxidation market. The process began with thorough secondary research to collect data on the target market, related markets, and broader industry context. These findings, along with preliminary assumptions and estimates, were then validated through extensive primary research involving industry experts from across the value chain. To calculate the overall market size, both top-down and bottom-up methodologies were employed. Finally, market segmentation and data triangulation techniques were applied to refine and validate segment-level estimations.
Secondary Research
The secondary research phase involved gathering data from a wide range of credible and published sources. This step helped in identifying industry trends, defining market segmentation, and understanding the market landscape and value chain.
Sources consulted during this phase included:
- Company annual reports, investor presentations, and press releases
- Industry white papers and certified publications
- Trade directories and market-recognized databases
- Articles from authoritative authors and reputable journals
- Gold and silver standard websites
Secondary research was critical in mapping out the industry's value chain and monetary flow, identifying key market segments, understanding regional variations, and tracking significant industry developments.
Other key sources:
- Financial disclosures
- Industry associations and trade bodies
- News outlets and business magazines
- Academic journals and research studies
- Paid industry databases
Primary Research
To validate secondary data and gain deeper market insights, primary research was conducted with key stakeholders across both the supply and demand sides of the market.
On the demand side, participants included decision-makers and influencers from end-user industries—such as CIOs, CTOs, and CSOs—who provided first-hand perspectives on market needs, product usage, and future expectations.
On the supply side, interviews were conducted with manufacturers, industry associations, and institutional participants to gather insights into current offerings, product pipelines, and market challenges.
Primary interviews provided critical inputs such as:
- Market size and revenue data
- Product and service breakdowns
- Market forecasts
- Regional and application-specific trends
Stakeholders consulted included:
- Leading OEM and solution providers
- Channel and distribution partners
- End users across various applications
- Independent consultants and industry specialists
Market Size Estimation and Data Triangulation
- Identifying Key Market Participants (Secondary Research)
- Goal: To identify the major players or companies in the target market. This typically involves using publicly available data sources such as industry reports, market research publications, and financial statements of companies.
- Tools: Reports from firms like Gartner, Forrester, Euromonitor, Statista, IBISWorld, and others. Public financial statements, news articles, and press releases from top market players.
- Extracting Earnings of Key Market Participants
- Goal: To estimate the earnings generated from the product or service being analyzed. This step helps in understanding the revenue potential of each market player in a specific geography.
- Methods: Earnings data can be gathered from:
- Publicly available financial reports (for listed companies).
- Interviews and primary data sources from professionals, such as Directors, VPs, SVPs, etc. This is especially useful for understanding more nuanced, internal data that isn't publicly disclosed.
- Annual reports and investor presentations of key players.
- Data Collation and Development of a Relevant Data Model
- Goal: To collate inputs from both primary and secondary sources into a structured, data-driven model for market estimation. This model will incorporate key market KPIs and any independent variables relevant to the market.
- Key KPIs: These could include:
- Market size, growth rate, and demand drivers.
- Industry-specific metrics like market share, average revenue per customer (ARPC), or average deal size.
- External variables, such as economic growth rates, inflation rates, or commodity prices, that could affect the market.
- Data Modeling: Based on this data, the market forecasts are developed for the next 5 years. A combination of trend analysis, scenario modeling, and statistical regression might be used to generate projections.
- Scenario Analysis
- Goal: To test different assumptions and validate how sensitive the market is to changes in key variables (e.g., market demand, regulatory changes, technological disruptions).
- Types of Scenarios:
- Base Case: Based on current assumptions and historical data.
- Best-Case Scenario: Assuming favorable market conditions, regulatory environments, and technological advancements.
- Worst-Case Scenario: Accounting for adverse factors, such as economic downturns, stricter regulations, or unexpected disruptions.


