Indonesia Small Cooking Appliances Market Report: Trends, Growth and Forecast (2026-2032)
By Appliances (Breadmakers, Coffee Machines (Standard Coffee Machines (Espresso Coffee Machines, Filter Coffee Machines), Pod Coffee Machines (Hard Pods, Soft Pods)), Coffee Mills, Fryers (Air Fryers, Oil Based Fryers), Electric Grills, Electric Steamers, Freestanding Hobs (Gas, Induction, Standard Electric, Mixed, Vitroceramic), Kettles, Rice Cookers, Slow Cookers, Others), By Sales Channel (Retail Offline (Grocery Retailers (Hypermarkets), Non-Grocery Retailers (General Merchandise Stores, Department Stores, Variety Stores, Appliances and Electronics Specialists, Home Products Specialists)), Retail Online), By Region (Sumatra, Java, Kalimantan, Sulawesi, Others) ... Read more
|
Major Players
|
Indonesia Small Cooking Appliances Market Statistics and Insights, 2026
- Market Size Statistics
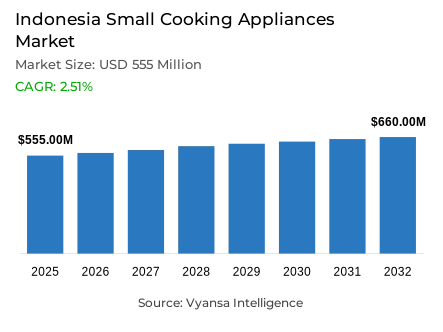
- Small cooking appliances market size in Indonesia was valued at USD 555 million in 2025 and is estimated at USD 588 million in 2026.
- The market size is expected to grow to USD 660 million by 2032.
- Market to register a CAGR of around 2.51% during 2026-32.
- Appliances Shares
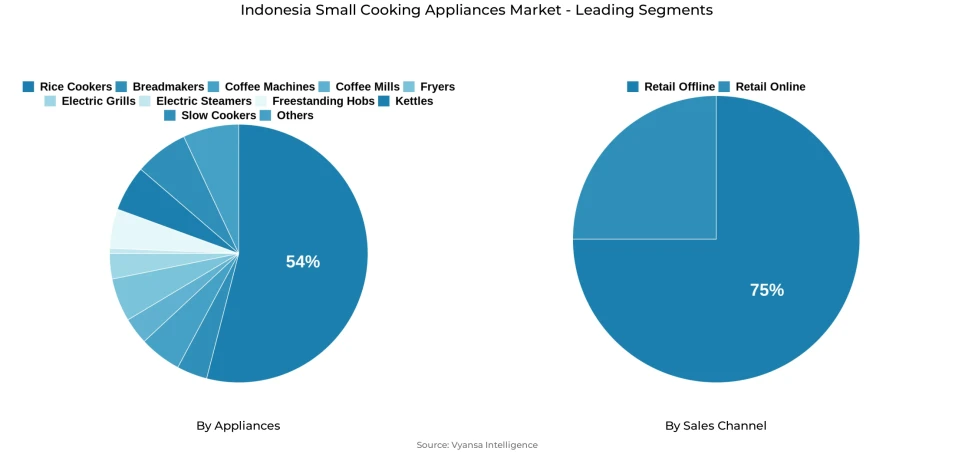
- Rice cookers grabbed market share of 54%.
- Competition
- More than 20 companies are actively engaged in producing small cooking appliances in Indonesia.
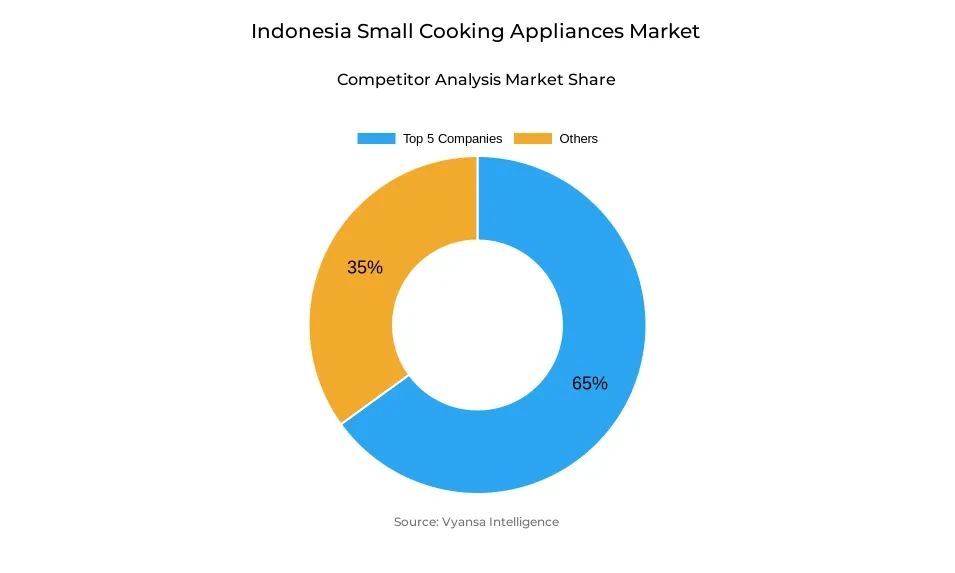
- Top 5 companies acquired around 65% of the market share.
- Yong Ma Electric Co Ltd PT, Sharp Electronics Indonesia PT, Hokinda Citra Lestari PT, Rinnai Indonesia PT, Kencana Gemilang PT etc., are few of the top companies.
- Sales Channel
- Retail offline grabbed 75% of the market.
Indonesia Small Cooking Appliances Market Outlook
Indonesia small cooking appliances market size was valued at USD 555 million in 2025 and is projected to grow from USD 588 million in 2026 to USD 660 million by 2032, exhibiting a CAGR of 2.51% during the forecast period. The future is stable because the category is anchored by the increasing digital commerce, the expansion of household demand, and the ongoing consumer interest in practical kitchen products that are used to prepare everyday meals.
A major factor shaping this outlook is the strong position of rice cookers, which account for 54% share under the appliances segment. Their dominance is attributed to their necessity in the Indonesian households where they are commonly used as a convenience, consistency and time saving cooking tool. Moreover, the need to compare products online and the increased emphasis on practical, everyday use kitchen solutions contribute to the demand of small cooking appliances.
The dominance of retail offline, which has 75% share under the sales channel segment, also affects the category. This indicates that consumers continue to use physical stores to make most of their purchases, particularly when they need to physically evaluate the size of the product, the quality of the building, and the functionality. Small cooking appliances still enjoy high in store visibility and point of purchase consumer confidence in this environment.
Meanwhile, the prospects are influenced by the increasing focus on energy efficiency and operating cost. There is an increasing awareness of electricity consumption among consumers, and there is also a shift in interest towards appliances with more explicit efficiency data and realistic cooking performance. This maintains the small cooking appliances in line with the household requirements in Indonesia in terms of convenience, functionality and enhanced everyday value.
Indonesia Small Cooking Appliances Market Growth DriverRising Digital Commerce Supports Household Appliance Demand
A major factor for growth of small cooking appliances in Indonesia is the rapid expansion of digital commerce. Bank Indonesia states that e-commerce transactions reach Rp503 trillion in 2025, showing how strongly digital buying is shaping household purchasing behavior. At the same time, BPS reports that 72.78% of Indonesia’s population accesses the internet in 2024, up from 69.21% in 2023. The increase in internet-accessible households will provide a viable purchase opportunity for small cooking appliances since consumers will easily access purchase options through comparing product features and benefits like price, convenience, and efficiency among other options when purchasing kitchen appliances through e-commerce websites.
Convenience, functionality, and replacement purchases would typically be driving factors when making a selection for them. Electronic commerce sites that provide a broader selection of options, provide greater exposure to product offerings, as well as enabling brands to reach consumers throughout Indonesia, will continue to expand beyond their current potentials. That keeps digital retail as an important growth driver for the category.
Indonesia Small Cooking Appliances Market ChallengeEnergy Cost Sensitivity Remains a Key Barrier
An ovstacle for small cooking appliances in Indonesia is consumer sensitivity to electricity use and operating cost. State Electricity Company (PLN) states that household electricity tariffs for R1 non-subsidy 1,300–2,200 VA stand at Rp1,444.70/kWh in Q4 2025, while R2 3,500–5,500 VA and R3 ≥6,600 VA tariffs are Rp1,699.53/kWh. This makes energy use an important consideration for households when choosing cooking appliances used frequently in daily meal preparation.
This matters because small cooking appliances are everyday use products, and buyers may hesitate if they feel a device adds to monthly electricity bills. In a price conscious household environment, brands need to balance functionality, cooking speed, and energy efficiency. As a result, electricity cost awareness remains a clear challenge for appliance makers operating in Indonesia.
Unlock Market Intelligence
Explore the market potential with our data-driven report
Indonesia Small Cooking Appliances Market TrendEnergy-Efficient Product Choices Are Shaping Market Direction
A major trend in Indonesia is the growing preference for energy efficient household appliances. Indonesia’s Ministry of Energy and Mineral Resources states in March 2025 that the Minimum Energy Performance Standards (SKEM) and Energy Saving Label (LTHE) already cover eight types of appliances, and rice cookers have been included since 2021. The ministry also notes that the label uses a 1 star to 5 star rating system, helping consumers compare efficiency more easily.
This trend matters because rice cookers are one of the most common kitchen appliances in Indonesian homes, so energy labeling directly influences buying decisions. As consumers pay more attention to electricity use and product quality, demand is moving toward appliances that offer clearer efficiency information along with practical cooking performance. This keeps energy efficient design at the center of product development in Indonesia.
Indonesia Small Cooking Appliances Market OpportunityExpanding Consumer Base Opens Wider Household Demand
A major opportunity for small cooking appliances in Indonesia comes from the country’s large and still growing consumer base. BPS reports that Indonesia’s population reaches 281.60 million in 2024, with annual population growth at 1.11%. A broad population base supports continued household demand for practical kitchen products used in daily cooking, especially appliances that simplify meal preparation and save time.
This creates room for wider adoption of compact cooking appliances across both replacement demand and first time household purchases. Products such as rice cookers and other essential countertop appliances benefit from their practical role in everyday food preparation. With such a large domestic consumer base, Indonesia offers continued opportunity for brands that provide reliable and cost effective cooking solutions.
Unlock Market Intelligence
Explore the market potential with our data-driven report
Indonesia Small Cooking Appliances Market Segmentation Analysis
By Appliances
- Breadmakers
- Coffee Machines
- Standard Coffee Machines
- Espresso Coffee Machines
- Filter Coffee Machines
- Pod Coffee Machines
- Hard Pods
- Soft Pods
- Standard Coffee Machines
- Coffee Mills
- Fryers
- Air Fryers
- Oil Based Fryers
- Electric Grills
- Electric Steamers
- Freestanding Hobs
- Gas
- Induction
- Standard Electric
- Mixed
- Vitroceramic
- Kettles
- Rice Cookers
- Slow Cookers
- Others
The segment with the highest share around the appliances category is rice cookers, with a 54% share. This leadership reflects their essential role in everyday meal preparation in Indonesia, where they are widely used for convenience, consistency, and time saving cooking. Their strong position also aligns with the country’s policy focus on household appliance efficiency, which keeps rice cookers highly relevant in daily kitchen use.
This leading position is also supported by recent regulatory attention to the category. Indonesia’s Ministry of Energy and Mineral Resources states that rice cookers have been included under the national energy efficiency label framework since 2021, and the wider labeling system covers eight appliance types in 2025. This strengthens consumer awareness and supports the continued importance of rice cookers in the category.
By Sales Channel
- Retail Offline
- Grocery Retailers
- Hypermarkets
- Non-Grocery Retailers
- General Merchandise Stores
- Department Stores
- Variety Stores
- Appliances and Electronics Specialists
- Home Products Specialists
- Grocery Retailers
- Retail Online
The segment with the highest share around the sales channel is retail offline, with a 75% share. This means that many small cooking appliance purchases are still made by consumers in Indonesia in physical stores, where the size of the product, the quality of its construction, and its practicality can be evaluated more easily in-store. In store purchase is still significant in the case of kitchen appliances that are frequently used at home as it facilitates direct comparison and instant confidence in the product.
This stance also suits the wide household consumer base of the country. According to BPS, the population of Indonesia is 281.60 million in 2024, which contributes to the extensive physical retail network that meets the daily household needs of the population in the country. Offline stores still have a significant role to play in the distribution of the necessary cooking appliances to consumers in such an environment.
List of Companies Covered in Indonesia Small Cooking Appliances Market
The companies listed below are highly influential in the Indonesia small cooking appliances market, with a significant market share and a strong impact on industry developments.
- Yong Ma Electric Co Ltd PT
- Sharp Electronics Indonesia PT
- Hokinda Citra Lestari PT
- Rinnai Indonesia PT
- Kencana Gemilang PT
- Star Cosmos PT
- Aditec Cakrawiyasa PT
- Philips Indonesia PT
- Citra Surya Abadi Prima PT
- Panasonic Global Indonesia PT
Competitive Landscape
In 2025, the small cooking appliances market in Indonesia remained led by Rinnai and Kencana, with freestanding hobs and rice cookers continuing to dominate retail volume sales due to their essential role in daily meal preparation and widespread household penetration. Air fryers, particularly from brands such as Han River and Mito, emerged as the most dynamic category, driven by growing health consciousness, social media influence, and affordability through e-commerce channels. The market is shaped by consumer demand for multifunctional and compact appliances that save space and offer versatility, with products such as multifunction air fryers and versatile rice cookers gaining traction. Sustainability and energy efficiency are increasingly influencing consumer choices, prompting manufacturers to incorporate green technologies and design innovations, while competition remains strong as local and international brands continuously upgrade offerings to meet evolving health, convenience, and lifestyle preferences.
Frequently Asked Questions
Related Report
- Market Segmentation
- Research Scope
- Research Methodology
- Definitions and Assumptions
- Executive Summary
- Indonesia Small Cooking Appliances Market Policies, Regulations, and Standards
- Indonesia Small Cooking Appliances Market Dynamics
- Growth Factors
- Challenges
- Trends
- Opportunities
- Indonesia Small Cooking Appliances Market Statistics, 2022-2032F
- Market Size & Growth Outlook
- By Revenues in USD Million
- Market Segmentation & Growth Outlook
- By Appliances
- Breadmakers- Market Insights and Forecast 2022-2032, USD Million
- Coffee Machines- Market Insights and Forecast 2022-2032, USD Million
- Standard Coffee Machines- Market Insights and Forecast 2022-2032, USD Million
- Espresso Coffee Machines- Market Insights and Forecast 2022-2032, USD Million
- Filter Coffee Machines- Market Insights and Forecast 2022-2032, USD Million
- Pod Coffee Machines- Market Insights and Forecast 2022-2032, USD Million
- Hard Pods- Market Insights and Forecast 2022-2032, USD Million
- Soft Pods- Market Insights and Forecast 2022-2032, USD Million
- Standard Coffee Machines- Market Insights and Forecast 2022-2032, USD Million
- Coffee Mills- Market Insights and Forecast 2022-2032, USD Million
- Fryers- Market Insights and Forecast 2022-2032, USD Million
- Air Fryers- Market Insights and Forecast 2022-2032, USD Million
- Oil Based Fryers- Market Insights and Forecast 2022-2032, USD Million
- Electric Grills- Market Insights and Forecast 2022-2032, USD Million
- Electric Steamers- Market Insights and Forecast 2022-2032, USD Million
- Freestanding Hobs- Market Insights and Forecast 2022-2032, USD Million
- Gas- Market Insights and Forecast 2022-2032, USD Million
- Induction- Market Insights and Forecast 2022-2032, USD Million
- Standard Electric- Market Insights and Forecast 2022-2032, USD Million
- Mixed- Market Insights and Forecast 2022-2032, USD Million
- Vitroceramic- Market Insights and Forecast 2022-2032, USD Million
- Kettles- Market Insights and Forecast 2022-2032, USD Million
- Rice Cookers- Market Insights and Forecast 2022-2032, USD Million
- Slow Cookers- Market Insights and Forecast 2022-2032, USD Million
- Others- Market Insights and Forecast 2022-2032, USD Million
- By Sales Channel
- Retail Offline- Market Insights and Forecast 2022-2032, USD Million
- Grocery Retailers- Market Insights and Forecast 2022-2032, USD Million
- Hypermarkets- Market Insights and Forecast 2022-2032, USD Million
- Non-Grocery Retailers- Market Insights and Forecast 2022-2032, USD Million
- General Merchandise Stores- Market Insights and Forecast 2022-2032, USD Million
- Department Stores- Market Insights and Forecast 2022-2032, USD Million
- Variety Stores- Market Insights and Forecast 2022-2032, USD Million
- Appliances and Electronics Specialists- Market Insights and Forecast 2022-2032, USD Million
- Home Products Specialists- Market Insights and Forecast 2022-2032, USD Million
- Grocery Retailers- Market Insights and Forecast 2022-2032, USD Million
- Retail Online- Market Insights and Forecast 2022-2032, USD Million
- Retail Offline- Market Insights and Forecast 2022-2032, USD Million
- By Region
- Sumatra
- Java
- Kalimantan
- Sulawesi
- Others
- By Competitors
- Competition Characteristics
- Market Share & Analysis
- By Appliances
- Market Size & Growth Outlook
- Indonesia Breadmakers Market Statistics, 2022-2032
- Market Size & Growth Outlook
- By Revenues in USD Million
- Market Segmentation & Growth Outlook
- By Sales Channel- Market Insights and Forecast 2022-2032, USD Million
- By Region- Market Insights and Forecast 2022-2032, USD Million
- Market Size & Growth Outlook
- Indonesia Coffee Machines Market Statistics, 2022-2032
- Market Size & Growth Outlook
- By Revenues in USD Million
- Market Segmentation & Growth Outlook
- By Sales Channel- Market Insights and Forecast 2022-2032, USD Million
- By Region- Market Insights and Forecast 2022-2032, USD Million
- Market Size & Growth Outlook
- Indonesia Coffee Mills Market Statistics, 2022-2032
- Market Size & Growth Outlook
- By Revenues in USD Million
- Market Segmentation & Growth Outlook
- By Sales Channel- Market Insights and Forecast 2022-2032, USD Million
- By Region- Market Insights and Forecast 2022-2032, USD Million
- Market Size & Growth Outlook
- Indonesia Fryers Market Statistics, 2022-2032
- Market Size & Growth Outlook
- By Revenues in USD Million
- Market Segmentation & Growth Outlook
- By Sales Channel- Market Insights and Forecast 2022-2032, USD Million
- By Region- Market Insights and Forecast 2022-2032, USD Million
- Market Size & Growth Outlook
- Indonesia Electric Grills Market Statistics, 2022-2032
- Market Size & Growth Outlook
- By Revenues in USD Million
- Market Segmentation & Growth Outlook
- By Sales Channel- Market Insights and Forecast 2022-2032, USD Million
- By Region- Market Insights and Forecast 2022-2032, USD Million
- Market Size & Growth Outlook
- Indonesia Electric Steamers Market Statistics, 2022-2032
- Market Size & Growth Outlook
- By Revenues in USD Million
- Market Segmentation & Growth Outlook
- By Sales Channel- Market Insights and Forecast 2022-2032, USD Million
- By Region- Market Insights and Forecast 2022-2032, USD Million
- Market Size & Growth Outlook
- Indonesia Freestanding Hobs Market Statistics, 2022-2032
- Market Size & Growth Outlook
- By Revenues in USD Million
- Market Segmentation & Growth Outlook
- By Sales Channel- Market Insights and Forecast 2022-2032, USD Million
- By Region- Market Insights and Forecast 2022-2032, USD Million
- Market Size & Growth Outlook
- Indonesia Kettles Market Statistics, 2022-2032
- Market Size & Growth Outlook
- By Revenues in USD Million
- Market Segmentation & Growth Outlook
- By Sales Channel- Market Insights and Forecast 2022-2032, USD Million
- By Region- Market Insights and Forecast 2022-2032, USD Million
- Market Size & Growth Outlook
- Indonesia Rice Cookers Market Statistics, 2022-2032
- Market Size & Growth Outlook
- By Revenues in USD Million
- Market Segmentation & Growth Outlook
- By Sales Channel- Market Insights and Forecast 2022-2032, USD Million
- By Region- Market Insights and Forecast 2022-2032, USD Million
- Market Size & Growth Outlook
- Indonesia Slow Cookers Market Statistics, 2022-2032
- Market Size & Growth Outlook
- By Revenues in USD Million
- Market Segmentation & Growth Outlook
- By Sales Channel- Market Insights and Forecast 2022-2032, USD Million
- By Region- Market Insights and Forecast 2022-2032, USD Million
- Market Size & Growth Outlook
- Competitive Outlook
- Company Profiles
- Rinnai Indonesia PT
- Business Description
- Product Portfolio
- Collaborations & Alliances
- Recent Developments
- Financial Details
- Others
- Kencana Gemilang PT
- Business Description
- Product Portfolio
- Collaborations & Alliances
- Recent Developments
- Financial Details
- Others
- Star Cosmos PT
- Business Description
- Product Portfolio
- Collaborations & Alliances
- Recent Developments
- Financial Details
- Others
- Aditec Cakrawiyasa PT
- Business Description
- Product Portfolio
- Collaborations & Alliances
- Recent Developments
- Financial Details
- Others
- Philips Indonesia PT
- Business Description
- Product Portfolio
- Collaborations & Alliances
- Recent Developments
- Financial Details
- Others
- Yong Ma Electric Co Ltd PT
- Business Description
- Product Portfolio
- Collaborations & Alliances
- Recent Developments
- Financial Details
- Others
- Sharp Electronics Indonesia PT
- Business Description
- Product Portfolio
- Collaborations & Alliances
- Recent Developments
- Financial Details
- Others
- Hokinda Citra Lestari PT
- Business Description
- Product Portfolio
- Collaborations & Alliances
- Recent Developments
- Financial Details
- Others
- Citra Surya Abadi Prima PT
- Business Description
- Product Portfolio
- Collaborations & Alliances
- Recent Developments
- Financial Details
- Others
- Panasonic Global Indonesia PT
- Business Description
- Product Portfolio
- Collaborations & Alliances
- Recent Developments
- Financial Details
- Others
- Rinnai Indonesia PT
- Company Profiles
- Disclaimer
| Segment | Sub-Segment |
|---|---|
| By Appliances |
|
| By Sales Channel |
|
| By Region |
|
Research Methodology
This study followed a structured approach comprising four key phases to assess the size and scope of the electro-oxidation market. The process began with thorough secondary research to collect data on the target market, related markets, and broader industry context. These findings, along with preliminary assumptions and estimates, were then validated through extensive primary research involving industry experts from across the value chain. To calculate the overall market size, both top-down and bottom-up methodologies were employed. Finally, market segmentation and data triangulation techniques were applied to refine and validate segment-level estimations.
Secondary Research
The secondary research phase involved gathering data from a wide range of credible and published sources. This step helped in identifying industry trends, defining market segmentation, and understanding the market landscape and value chain.
Sources consulted during this phase included:
- Company annual reports, investor presentations, and press releases
- Industry white papers and certified publications
- Trade directories and market-recognized databases
- Articles from authoritative authors and reputable journals
- Gold and silver standard websites
Secondary research was critical in mapping out the industry's value chain and monetary flow, identifying key market segments, understanding regional variations, and tracking significant industry developments.
Other key sources:
- Financial disclosures
- Industry associations and trade bodies
- News outlets and business magazines
- Academic journals and research studies
- Paid industry databases
Primary Research
To validate secondary data and gain deeper market insights, primary research was conducted with key stakeholders across both the supply and demand sides of the market.
On the demand side, participants included decision-makers and influencers from end-user industries—such as CIOs, CTOs, and CSOs—who provided first-hand perspectives on market needs, product usage, and future expectations.
On the supply side, interviews were conducted with manufacturers, industry associations, and institutional participants to gather insights into current offerings, product pipelines, and market challenges.
Primary interviews provided critical inputs such as:
- Market size and revenue data
- Product and service breakdowns
- Market forecasts
- Regional and application-specific trends
Stakeholders consulted included:
- Leading OEM and solution providers
- Channel and distribution partners
- End users across various applications
- Independent consultants and industry specialists
Market Size Estimation and Data Triangulation
- Identifying Key Market Participants (Secondary Research)
- Goal: To identify the major players or companies in the target market. This typically involves using publicly available data sources such as industry reports, market research publications, and financial statements of companies.
- Tools: Reports from firms like Gartner, Forrester, Euromonitor, Statista, IBISWorld, and others. Public financial statements, news articles, and press releases from top market players.
- Extracting Earnings of Key Market Participants
- Goal: To estimate the earnings generated from the product or service being analyzed. This step helps in understanding the revenue potential of each market player in a specific geography.
- Methods: Earnings data can be gathered from:
- Publicly available financial reports (for listed companies).
- Interviews and primary data sources from professionals, such as Directors, VPs, SVPs, etc. This is especially useful for understanding more nuanced, internal data that isn't publicly disclosed.
- Annual reports and investor presentations of key players.
- Data Collation and Development of a Relevant Data Model
- Goal: To collate inputs from both primary and secondary sources into a structured, data-driven model for market estimation. This model will incorporate key market KPIs and any independent variables relevant to the market.
- Key KPIs: These could include:
- Market size, growth rate, and demand drivers.
- Industry-specific metrics like market share, average revenue per customer (ARPC), or average deal size.
- External variables, such as economic growth rates, inflation rates, or commodity prices, that could affect the market.
- Data Modeling: Based on this data, the market forecasts are developed for the next 5 years. A combination of trend analysis, scenario modeling, and statistical regression might be used to generate projections.
- Scenario Analysis
- Goal: To test different assumptions and validate how sensitive the market is to changes in key variables (e.g., market demand, regulatory changes, technological disruptions).
- Types of Scenarios:
- Base Case: Based on current assumptions and historical data.
- Best-Case Scenario: Assuming favorable market conditions, regulatory environments, and technological advancements.
- Worst-Case Scenario: Accounting for adverse factors, such as economic downturns, stricter regulations, or unexpected disruptions.