Indonesia Room Air Conditioners Market Report: Trends, Growth and Forecast (2026-2032)
By Product Type (Split Air Conditioners (Up to 9,000 BTU/h, 9,001-12,000 BTU/h, 12,001-18,000 BTU/h, 18,001-24,000 BTU/h, Above 24,000 BTU/h), Window Air Conditioners (Up to 9,000 BTU/h, 9,001-12,000 BTU/h, 12,001-18,000 BTU/h, 18,001-24,000 BTU/h, Above 24,000 BTU/h), Others), By Technology (Inverter, Non-Inverter), By Price (Up to USD 300, USD 301 to USD 600, USD 601 to USD 1,000, Above USD 1,000), By End User (Residential (Individual Households, Apartments/Condominiums, Vacation/Secondary Homes), Commercial (Offices, Retail Stores/Showrooms, Hospitality, Healthcare Facilities, Educational Institutions, Small Commercial Establishments, Others)), By Sales Channel (Retail Online (Brand-Owned Websites/D2C, E-Commerce Marketplaces), Retail Offline (Exclusive Brand Stores, Multi-Brand Electronics & Appliance Stores, Specialty Stores, Hypermarkets/Supermarkets, Home Improvement Stores, Dealer/Distributor Network, Direct Sales/Institutional Sales, Local Independent Retailers)), By Refrigerant Type (R-32, R-410A, R-290, R-454B, Others), By Connectivity (Smart/Connected, Conventional/Non-Smart), By Energy Efficiency (1 Star, 2 Star, 3 Star, 4 Star, 5 Star), By Region (Sumatra, Java, Kalimantan, Sulawesi, Others) ... Read more
|
Major Players
|
Indonesia Room Air Conditioners Market Statistics and Insights, 2026
- Market Size Statistics
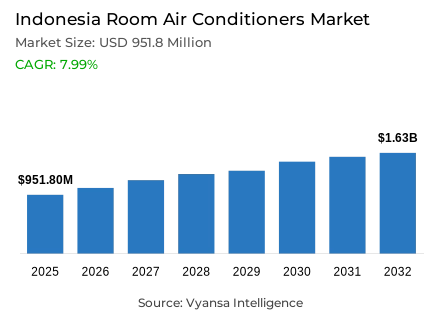
- Room air conditioners market size in Indonesia was valued at USD 951.8 million in 2025 and is estimated at USD 1.06 billion in 2026.
- The market size is expected to grow to USD 1.63 billion by 2032.
- Market to register a CAGR of around 7.99% during 2026-32.
- Product Type Shares
- Split air conditioners grabbed market share of 85%.
- Competition
- More than 10 companies are actively engaged in producing room air conditioners in Indonesia.
- Top 5 companies acquired around 65% of the market share.
- Midea Group Co Ltd, Haier Group, Samsung Corp, Daikin Industries Ltd, Hon Hai Precision Industry Co Ltd etc., are few of the top companies.
- Technology
- Inverte grabbed 70% of the market.
Indonesia Room Air Conditioners Market Outlook
The Indonesia room air conditioners market is estimated to be USD 951.8 million in 2025 and it is forecast to rise from USD 1.06 billion in 2026 to USD 1.63 billion by 2032, indicating a CAGR of 7.99%. This strong growth trend indicates a high-growth market supported by growing cooling requirements and expanded use in households and small business premises. The market is experiencing a growing demand rate with room air conditioners no longer being luxurious items but necessities.
The residential use continues to be highly concentrated with demand being influenced by the practicality of installation and the stability of cooling performance to influence purchase decisions. Split air conditioners account for approximately 85% of total market share, reflecting strong alignment with urban housing formats. This leadership shows that the market is organized around room-level cooling systems that are affordable, efficient, and usable. It also supports the significance of standardized formats in maintaining volume growth.
Technology preference is increasingly centered on energy‑efficient performance, with inverter models accounting for around 70% of the market. This is an indication of a definite change in end-user preferences to electricity saving, less noise, and constant temperature. As a result, air conditioners are not being judged based on cooling capacity alone but also based on long-term operating efficiency. This shift makes inverter systems a major competitive standard in the market.
The future is also positive up to 2032, with replacement cycles, first-time buyers, and efficiency-based upgrades. The growth of USD 1.06billion in 2026 to USD 1.63billion in 2032 indicates the growth in penetration and the value per unit. The market will be transformed by the innovation of products, the availability of better services, and the better correspondence to the energy-saving preferences, which will support its long-term growth trajectory.

Indonesia Room Air Conditioners Market Growth DriverRising Cooling Demand Amid Increasing Temperature Levels
Rising temperature patterns remain the primary growth driver in Indonesia’s room air conditioners market. The rising intensity of heat makes indoor cooling a necessity and not a luxury. This change maintains demand in urban households, where there is more heat accumulation and humidity. It also highlights the necessity of air conditioners in enhancing the daily living standards.
The power of this demand driver is confirmed by climate data over the past years. In 2024, Indonesia registered a mean temperature of 27.5°C with an anomaly of 0.8°C above the normal temperature in the long run, the hottest year since 1981. In 2025, the temperatures were high at 27.05°C with an anomaly of 0.38°C. These conditions ensure a steady cooling requirement and support the necessity of frequent air conditioner use until 2032.
Indonesia Room Air Conditioners Market ChallengeElevated Electricity Costs Impacting Adoption
Electricity cost pressure remains the principal challenge influencing purchasing decisions in Indonesia’s room air conditioners market. end user are also considering the long-term operating cost in addition to the initial cost of the appliance. This poses an obstacle to adoption, especially of less efficient models, as households trade off cooling requirements and the regular electricity bills. Expansion is thus still dependent on the cost of buying and consuming.
The data on energy consumption emphasizes the significance of this constraint in household decision-making. A typical 1 PK air conditioner uses about 800 to 900 watts per hour and electricity tariffs are between Rp144.70 and Rp169.53 per kWh depending on the category of use. These expenses increase the sensitivity to energy efficiency and strengthen the careful buying behaviour, especially among price-sensitive end user until 2032.
Unlock Market Intelligence
Explore the market potential with our data-driven report
Indonesia Room Air Conditioners Market TrendAccelerating Shift Toward Energy-Efficient Technologies
Energy efficiency is emerging as a defining trend shaping product development and end-user preference in Indonesia’s room air conditioners market. End user are becoming more concerned with reduced energy use, improved stability in performance and long-term cost savings. This is indicative of a larger trend of value-based buying, in which operational efficiency is a major point of distinction among competing products.
This transition is supported by regulatory frameworks that influence consumer choice and manufacturer innovation. Appliances are classified into a 1-star to 5-star efficiency system through energy performance standards and labeling programmes, which allow easier comparison at the point of purchase. It is estimated that high-efficiency products will help decrease peak electricity load and create substantial energy savings. These forces reinforce the trend of the market to smarter, energy-efficient cooling solutions by 2032.
Indonesia Room Air Conditioners Market OpportunityExpanding Urbanization Driving Residential Cooling Demand
Urbanisation is an important opportunity to increase the use of room air conditioners in Indonesia. The rising urban population is expanding the households that need modern cooling systems especially in small living spaces. This growth helps in first-time buying and replacement demand, particularly with the increased availability of organised retail and installation services. The market is best in fast growing cities and peri-urban regions.
The demographic and economic statistics indicate the magnitude of this opportunity in the market. Approximately 59% of Indonesia’s population lived in urban areas in 2024, with total population reaching 283.5 million and GDP growth at 5.0%. These aspects suggest an increasing middle-income population with better buying power. With the growth of urban housing, the need to have practical and energy-efficient cooling systems is likely to increase at a faster rate by 2032.
Unlock Market Intelligence
Explore the market potential with our data-driven report
Indonesia Room Air Conditioners Market Segmentation Analysis
By Product Type
- Split Air Conditioners
- Up to 9,000 BTU/h
- 9,001-12,000 BTU/h
- 12,001-18,000 BTU/h
- 18,001-24,000 BTU/h
- Above 24,000 BTU/h
- Window Air Conditioners
- Up to 9,000 BTU/h
- 9,001-12,000 BTU/h
- 12,001-18,000 BTU/h
- 18,001-24,000 BTU/h
- Above 24,000 BTU/h
- Others
The segment with highest market share under the Product Type is Split Air Conditioners, accounting for approximately 85% of the total market. Its management is well aligned to residential applications, with efficient room-level cooling and simple installation in different housing types. This further makes split systems the most preferred in the apartments and the landed homes, which further strengthens their central position in the household cooling solutions.
The segment also enjoys a high installed base and wide price range availability. This helps to ensure a consistent replacement demand and accessibility to first-time buyers. Consequently, split air conditioners will continue to be the volume driver and the key point of reference in product innovation, pricing, and competitive positioning until 2032.

By Technology
- Inverter
- Non-Inverter
The segment with highest market share under the Technology is Inverter, accounting for approximately 70% of the total market. This dominance indicates a powerful transition to energy-saving systems that provide superior electricity control and enhanced cooling stability. These features are becoming more and more important to end user as a long-term cost-saving and comfort-enhancing factor.
The leadership of the segment also suggests that the competition in technology is currently focused on refining performance instead of mere adoption. Manufacturers are also working on efficiency, noise reduction, and user experience in inverter systems. This makes inverter technology the fundamental standard that defines product development and consumer expectations in the market up to 2032.
List of Companies Covered in Indonesia Room Air Conditioners Market
The companies listed below are highly influential in the Indonesia room air conditioners market, with a significant market share and a strong impact on industry developments.
- Midea Group Co Ltd
- Haier Group
- Samsung Corp
- Daikin Industries Ltd
- Hon Hai Precision Industry Co Ltd
- Gree Electric Appliances Inc of Zhuhai
- Panasonic Corp
- LG Corp
- Changhong Electric Co Ltd
- TCL Corp
Market News & Updates
- Haier Group, 2026:
Haier Indonesia officially launched the Haier brand and product portfolio in Indonesia in February 2026, stating that its premium appliance range for the country includes air conditioners alongside other major home-appliance categories. This is significant for the Indonesia room air conditioners market because it marks a formal premium-brand push backed by dealer-network expansion and long-term local commitment, which can intensify competition in Indonesia’s residential AC segment.
- Panasonic Corp, 2025:
Panasonic Indonesia highlighted its si-BIRU SUPER X room air conditioner in its 2025 official communications, positioning it as a next-generation model that combines advanced cooling with air purification for Indonesian families. This is an important Indonesia market update because it reflects growing demand for room ACs that go beyond temperature control to indoor-air-quality positioning, especially in dense urban households concerned about enclosed-air health and comfort.
Frequently Asked Questions
Related Report
- Market Segmentation
- Research Scope
- Research Methodology
- Definitions and Assumptions
- Executive Summary
- Indonesia Room Air Conditioners Market Policies, Regulations, and Standards
- Indonesia Room Air Conditioners Market Dynamics
- Growth Factors
- Challenges
- Trends
- Opportunities
- Indonesia Room Air Conditioners Market Statistics, 2022-2032F
- Market Size & Growth Outlook
- By Revenues in USD Million
- By Units Sold in Thousand Units
- Market Segmentation & Growth Outlook
- By Product Type
- Split Air Conditioners- Market Insights and Forecast 2022-2032, USD Million
- Up to 9,000 BTU/h- Market Insights and Forecast 2022-2032, USD Million
- 9,001-12,000 BTU/h- Market Insights and Forecast 2022-2032, USD Million
- 12,001-18,000 BTU/h- Market Insights and Forecast 2022-2032, USD Million
- 18,001-24,000 BTU/h- Market Insights and Forecast 2022-2032, USD Million
- Above 24,000 BTU/h- Market Insights and Forecast 2022-2032, USD Million
- Window Air Conditioners- Market Insights and Forecast 2022-2032, USD Million
- Up to 9,000 BTU/h- Market Insights and Forecast 2022-2032, USD Million
- 9,001-12,000 BTU/h- Market Insights and Forecast 2022-2032, USD Million
- 12,001-18,000 BTU/h- Market Insights and Forecast 2022-2032, USD Million
- 18,001-24,000 BTU/h- Market Insights and Forecast 2022-2032, USD Million
- Above 24,000 BTU/h- Market Insights and Forecast 2022-2032, USD Million
- Others- Market Insights and Forecast 2022-2032, USD Million
- Split Air Conditioners- Market Insights and Forecast 2022-2032, USD Million
- By Technology
- Inverter- Market Insights and Forecast 2022-2032, USD Million
- Non-Inverter- Market Insights and Forecast 2022-2032, USD Million
- By Price
- Up to USD 300- Market Insights and Forecast 2022-2032, USD Million
- USD 301 to USD 600- Market Insights and Forecast 2022-2032, USD Million
- USD 601 to USD 1,000- Market Insights and Forecast 2022-2032, USD Million
- Above USD 1,000- Market Insights and Forecast 2022-2032, USD Million
- By End User
- Residential- Market Insights and Forecast 2022-2032, USD Million
- Individual Households- Market Insights and Forecast 2022-2032, USD Million
- Apartments/Condominiums- Market Insights and Forecast 2022-2032, USD Million
- Vacation/Secondary Homes- Market Insights and Forecast 2022-2032, USD Million
- Commercial- Market Insights and Forecast 2022-2032, USD Million
- Offices- Market Insights and Forecast 2022-2032, USD Million
- Retail Stores/Showrooms- Market Insights and Forecast 2022-2032, USD Million
- Hospitality- Market Insights and Forecast 2022-2032, USD Million
- Healthcare Facilities- Market Insights and Forecast 2022-2032, USD Million
- Educational Institutions- Market Insights and Forecast 2022-2032, USD Million
- Small Commercial Establishments- Market Insights and Forecast 2022-2032, USD Million
- Others- Market Insights and Forecast 2022-2032, USD Million
- Residential- Market Insights and Forecast 2022-2032, USD Million
- By Sales Channel
- Retail Online- Market Insights and Forecast 2022-2032, USD Million
- Brand-Owned Websites/D2C- Market Insights and Forecast 2022-2032, USD Million
- E-Commerce Marketplaces- Market Insights and Forecast 2022-2032, USD Million
- Retail Offline- Market Insights and Forecast 2022-2032, USD Million
- Exclusive Brand Stores- Market Insights and Forecast 2022-2032, USD Million
- Multi-Brand Electronics & Appliance Stores- Market Insights and Forecast 2022-2032, USD Million
- Specialty Stores- Market Insights and Forecast 2022-2032, USD Million
- Hypermarkets/Supermarkets- Market Insights and Forecast 2022-2032, USD Million
- Home Improvement Stores- Market Insights and Forecast 2022-2032, USD Million
- Dealer/Distributor Network- Market Insights and Forecast 2022-2032, USD Million
- Direct Sales/Institutional Sales- Market Insights and Forecast 2022-2032, USD Million
- Local Independent Retailers- Market Insights and Forecast 2022-2032, USD Million
- Retail Online- Market Insights and Forecast 2022-2032, USD Million
- By Refrigerant Type
- R-32- Market Insights and Forecast 2022-2032, USD Million
- R-410A- Market Insights and Forecast 2022-2032, USD Million
- R-290- Market Insights and Forecast 2022-2032, USD Million
- R-454B- Market Insights and Forecast 2022-2032, USD Million
- Others- Market Insights and Forecast 2022-2032, USD Million
- By Connectivity
- Smart/Connected- Market Insights and Forecast 2022-2032, USD Million
- Conventional/Non-Smart- Market Insights and Forecast 2022-2032, USD Million
- By Energy Efficiency
- 1 Star- Market Insights and Forecast 2022-2032, USD Million
- 2 Star- Market Insights and Forecast 2022-2032, USD Million
- 3 Star- Market Insights and Forecast 2022-2032, USD Million
- 4 Star- Market Insights and Forecast 2022-2032, USD Million
- 5 Star- Market Insights and Forecast 2022-2032, USD Million
- By Region
- Sumatra
- Java
- Kalimantan
- Sulawesi
- Others
- By Competitors
- Competition Characteristics
- Market Share & Analysis
- By Product Type
- Market Size & Growth Outlook
- Indonesia Split Air Conditioners Market Statistics, 2022-2032
- Market Size & Growth Outlook
- By Revenues in USD Million
- By Units Sold in Thousand Units
- Market Segmentation & Growth Outlook
- By Technology- Market Insights and Forecast 2022-2032, USD Million
- By Price- Market Insights and Forecast 2022-2032, USD Million
- By End User- Market Insights and Forecast 2022-2032, USD Million
- By Sales Channel- Market Insights and Forecast 2022-2032, USD Million
- By Refrigerant Type- Market Insights and Forecast 2022-2032, USD Million
- By Connectivity- Market Insights and Forecast 2022-2032, USD Million
- By Energy Efficiency- Market Insights and Forecast 2022-2032, USD Million
- By Region- Market Insights and Forecast 2022-2032, USD Million
- Market Size & Growth Outlook
- Indonesia Window Air Conditioners Market Statistics, 2022-2032
- Market Size & Growth Outlook
- By Revenues in USD Million
- By Units Sold in Thousand Units
- Market Segmentation & Growth Outlook
- By Technology- Market Insights and Forecast 2022-2032, USD Million
- By Price- Market Insights and Forecast 2022-2032, USD Million
- By End User- Market Insights and Forecast 2022-2032, USD Million
- By Sales Channel- Market Insights and Forecast 2022-2032, USD Million
- By Refrigerant Type- Market Insights and Forecast 2022-2032, USD Million
- By Connectivity- Market Insights and Forecast 2022-2032, USD Million
- By Energy Efficiency- Market Insights and Forecast 2022-2032, USD Million
- By Region- Market Insights and Forecast 2022-2032, USD Million
- Market Size & Growth Outlook
- Competitive Outlook
- Company Profiles
- Daikin Industries Ltd
- Business Description
- Product Portfolio
- Collaborations & Alliances
- Recent Developments
- Financial Details
- Others
- Hon Hai Precision Industry Co Ltd
- Business Description
- Product Portfolio
- Collaborations & Alliances
- Recent Developments
- Financial Details
- Others
- Gree Electric Appliances Inc of Zhuhai
- Business Description
- Product Portfolio
- Collaborations & Alliances
- Recent Developments
- Financial Details
- Others
- Panasonic Corp
- Business Description
- Product Portfolio
- Collaborations & Alliances
- Recent Developments
- Financial Details
- Others
- LG Corp
- Business Description
- Product Portfolio
- Collaborations & Alliances
- Recent Developments
- Financial Details
- Others
- Midea Group Co Ltd
- Business Description
- Product Portfolio
- Collaborations & Alliances
- Recent Developments
- Financial Details
- Others
- Haier Group
- Business Description
- Product Portfolio
- Collaborations & Alliances
- Recent Developments
- Financial Details
- Others
- Samsung Corp
- Business Description
- Product Portfolio
- Collaborations & Alliances
- Recent Developments
- Financial Details
- Others
- Changhong Electric Co Ltd
- Business Description
- Product Portfolio
- Collaborations & Alliances
- Recent Developments
- Financial Details
- Others
- TCL Corp
- Business Description
- Product Portfolio
- Collaborations & Alliances
- Recent Developments
- Financial Details
- Others
- Daikin Industries Ltd
- Company Profiles
- Disclaimer
| Segment | Sub-Segment |
|---|---|
| By Product Type |
|
| By Technology |
|
| By Price |
|
| By End User |
|
| By Sales Channel |
|
| By Refrigerant Type |
|
| By Connectivity |
|
| By Energy Efficiency |
|
| By Region |
|
Research Methodology
This study followed a structured approach comprising four key phases to assess the size and scope of the electro-oxidation market. The process began with thorough secondary research to collect data on the target market, related markets, and broader industry context. These findings, along with preliminary assumptions and estimates, were then validated through extensive primary research involving industry experts from across the value chain. To calculate the overall market size, both top-down and bottom-up methodologies were employed. Finally, market segmentation and data triangulation techniques were applied to refine and validate segment-level estimations.
Secondary Research
The secondary research phase involved gathering data from a wide range of credible and published sources. This step helped in identifying industry trends, defining market segmentation, and understanding the market landscape and value chain.
Sources consulted during this phase included:
- Company annual reports, investor presentations, and press releases
- Industry white papers and certified publications
- Trade directories and market-recognized databases
- Articles from authoritative authors and reputable journals
- Gold and silver standard websites
Secondary research was critical in mapping out the industry's value chain and monetary flow, identifying key market segments, understanding regional variations, and tracking significant industry developments.
Other key sources:
- Financial disclosures
- Industry associations and trade bodies
- News outlets and business magazines
- Academic journals and research studies
- Paid industry databases
Primary Research
To validate secondary data and gain deeper market insights, primary research was conducted with key stakeholders across both the supply and demand sides of the market.
On the demand side, participants included decision-makers and influencers from end-user industries—such as CIOs, CTOs, and CSOs—who provided first-hand perspectives on market needs, product usage, and future expectations.
On the supply side, interviews were conducted with manufacturers, industry associations, and institutional participants to gather insights into current offerings, product pipelines, and market challenges.
Primary interviews provided critical inputs such as:
- Market size and revenue data
- Product and service breakdowns
- Market forecasts
- Regional and application-specific trends
Stakeholders consulted included:
- Leading OEM and solution providers
- Channel and distribution partners
- End users across various applications
- Independent consultants and industry specialists
Market Size Estimation and Data Triangulation
- Identifying Key Market Participants (Secondary Research)
- Goal: To identify the major players or companies in the target market. This typically involves using publicly available data sources such as industry reports, market research publications, and financial statements of companies.
- Tools: Reports from firms like Gartner, Forrester, Euromonitor, Statista, IBISWorld, and others. Public financial statements, news articles, and press releases from top market players.
- Extracting Earnings of Key Market Participants
- Goal: To estimate the earnings generated from the product or service being analyzed. This step helps in understanding the revenue potential of each market player in a specific geography.
- Methods: Earnings data can be gathered from:
- Publicly available financial reports (for listed companies).
- Interviews and primary data sources from professionals, such as Directors, VPs, SVPs, etc. This is especially useful for understanding more nuanced, internal data that isn't publicly disclosed.
- Annual reports and investor presentations of key players.
- Data Collation and Development of a Relevant Data Model
- Goal: To collate inputs from both primary and secondary sources into a structured, data-driven model for market estimation. This model will incorporate key market KPIs and any independent variables relevant to the market.
- Key KPIs: These could include:
- Market size, growth rate, and demand drivers.
- Industry-specific metrics like market share, average revenue per customer (ARPC), or average deal size.
- External variables, such as economic growth rates, inflation rates, or commodity prices, that could affect the market.
- Data Modeling: Based on this data, the market forecasts are developed for the next 5 years. A combination of trend analysis, scenario modeling, and statistical regression might be used to generate projections.
- Scenario Analysis
- Goal: To test different assumptions and validate how sensitive the market is to changes in key variables (e.g., market demand, regulatory changes, technological disruptions).
- Types of Scenarios:
- Base Case: Based on current assumptions and historical data.
- Best-Case Scenario: Assuming favorable market conditions, regulatory environments, and technological advancements.
- Worst-Case Scenario: Accounting for adverse factors, such as economic downturns, stricter regulations, or unexpected disruptions.


