Indonesia Jewellery Market Report: Trends, Growth and Forecast (2026-2032)
Category (Costume Jewellery, Fine Jewellery), Type (Earrings, Neckwear, Rings, Wristwear, Other), Collection (Diamond, Non-Diamond), Material Type (Gold, Platinum, Metal Combination, Silver), Sales Channel (Retail Offline, Retail Online), End User (Men, Women) ... Read more
|
Major Players
|
Indonesia Jewellery Market Statistics and Insights, 2026
- Market Size Statistics
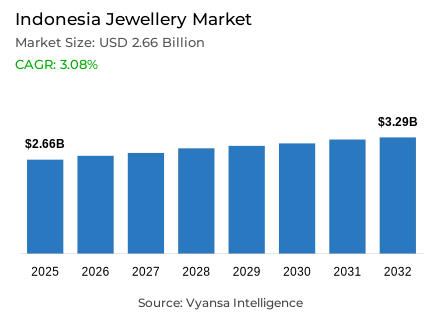
- Jewellery in Indonesia is estimated at USD 2.66 billion.
- The market size is expected to grow to USD 3.29 billion by 2032.
- Market to register a cagr of around 3.08% during 2026-32.
- Category Shares
- Fine jewellery grabbed market share of 95%.
- Competition
- More than 10 companies are actively engaged in producing jewellery in Indonesia.
- Top 5 companies acquired around 5% of the market share.
- Felice Jewellery PT; D'Paris Silver PT; Luvitasindo PT; Sumber Kreasi Cipta Logam PT; LVMH Moët Hennessy Louis Vuitton SA etc., are few of the top companies.
- Sales Channel
- Retail offline grabbed 95% of the market.
Indonesia Jewellery Market Outlook
The jewellery market in Indonesia is projected to expand steadily over the coming years, with its value estimated at around USD 2.66 billion in 2025 and expected to reach around USD 3.29 billion by 2032, reflecting a CAGR of around 3.08% during 2026–2032. This steady rise is supported by Indonesia’s strong cultural and emotional connection to jewellery, which continues to be an essential part of social identity and family tradition. End users regard jewellery not only as an accessory but also as a reliable investment that holds value over time. Its importance during weddings, religious celebrations, and festive events keeps demand consistent across both rural and urban areas, reinforcing its long-standing presence in daily life and major occasions.
The segment of fine jewellery accounts for around 95% of total sales in the market. The end users are still attached to the gold and gemstone pieces, as these signify their status, tradition, and art. This segment is strong not only because it has traditionally been the mainstream but also because modern designs with minimalist aesthetics attract young end users who value cultural depth and modern style alike. In this regard, fine jewellery manages to balance both heritage and innovation, making it relevant and emotionally important across generations.
The retail offline channel, which accounts for around 95% of market share, continues to be the leading channel. The physical stores are still preferred by end users because they can see the product personally and create trust through direct interaction. These outlets also provide tailored service and professional advice, which are essential for high-value purchases. While online platforms continue their progressive increase, in-store remains the foundation of jewellery sales due to authenticity and reassurance.
Looking ahead, deep rooted cultural pride combined with continuous craftsmanship development and sustained government support of local artisans and export initiatives is apt to provide healthy growth well into the future. Supported by increasing international exposure, the rising interest in uniquely designed and personalized jewellery will place the Indonesia jewellery market in a strategically advantageous position for long-term development and heightened global recognition through 2032.

Indonesia Jewellery Market Growth Driver
Cultural Heritage Strengthening Global Appeal
Local jewellery is gaining more attention as traditional craftsmanship continues to connects deeply with artistic identity. End users appreciate the unique designs that reflect creativity, culture, and emotional value. This strong cultural story gives each piece a special meaning, helping it attract both domestic and international audiences. The combination of detailed handmade work and modern design continues to make jewellery a proud symbol of national artistry. In 2023, Indonesia recorded jewellery exports worth USD 3.14 billion, ranking as the world’s 11th largest exporter, with precious metal jewellery exports reaching USD 5.52 billion a 46% increase from 2022.
Furthermore, at global exhibitions, heritage inspired designs have earned widespread praise for their originality and intricate detailing. Such creativity is making this market stand tall globally, while preserving local skills and traditions. As more artisans continues to make balance between traditional values with modern design ideas, cultural heritage remains the cornerstone for recognition and pride in local craftsmanship, strengthening appreciation for the real artistry across the markets.
Indonesia Jewellery Market Challenge
Fragmented Market Limiting Competitive Strength
The market remains highly divided, with many small producers competing against one another without clear market leaders. This situation makes it hard to achieve large scale production or maintain consistent standards of quality. Smaller producers usually face financial and technical limitations that affect their possibilities of expanding their businesses or investing in modern tools. The uneven structure slows industry progress and limits the visibility of the industry among global buyers. About 90% of Indonesia overall business structure consists of small and medium enterprises, reflecting deep fragmentation in the jewellery sector too.
While small producers are flexible in design, their limited reach affects supply stability and innovation. This issue is further highlighted by the rapid growth of social media sellers, which creates more clutter and makes it hard for end users to identify trustworthy sources. Such a scattered setup prevents the creation of a strong and unified industry identity that reduces overall impact in export markets and weakens collective progress.
Unlock Market Intelligence
Explore the market potential with our data-driven report
Indonesia Jewellery Market Trend
Personalised Designs Reflecting Individual Identity
The end users are starting to look for jewellery that actually reflects something about who they are. It's no longer just about gold weight or big stones it's about meaning. A growing number of end users now prefer pieces that carry a personal story, like a ring designed to mark a life event or a pendant created to celebrate someone special. Across ASEAN, the appetite for this kind of jewellery is rising fast. In 2022, demand reached 77.8 tons over three times higher than Hong Kong 22.4 tons showing how much end users in the region value creativity and custom design.
Additionally, with time as technology is changing how jewellery is made and bought. With tools such as 3D modelling and digital previews, end users can now see and adjust their designs before anything is finalised. That experience adds a real sense of connection to make end user as a part of the process, not just the purchase. It also builds trust and loyalty, showing how personal meaning is starting to shape not only what people buy, but how they buy it.
Indonesia Jewellery Market Opportunity
Expanding Export Channels Through Government Support
Government initiatives plays an important role in helping artisans access international buyers and further develop their capacities to export. Programs such as training workshops, support for the improvement of design, and participation in trade exhibitions give small producers significant exposure. They let artisans showcase their skills on the world stage and develop connections with investors and distributors for long term growth. The Ministry of Industry, through BBSPJIKB, actively develops mapping programs for jewellery and provide technical guidance for improving export capacity.
Furthermore, through partnerships between ministries, trade organizations, and creative communities, jewellery makers gain access to export channels and international showcases. This formal support raises standards of products, encourages innovative activities, and strengthens their presence as competitors overseas jewellery markets. Additionally, this community builds confidence in the whole value chain from artisans to end users, supporting future growth that builds inclusivity and sustainability in the industry.
Unlock Market Intelligence
Explore the market potential with our data-driven report
Indonesia Jewellery Market Segmentation Analysis

By Category
- Costume Jewellery
- Fine Jewellery
The fine jewellery segment holds the highest share in the market, accounting for around 95% of total sales. This strong lead comes from the deep cultural connection that end users have with gold and gemstone jewellery. Fine jewellery is seen not just as decoration but as a long-term investment and symbol of status and tradition. Its importance during weddings, religious festivals, and family events keeps it the most preferred category, even during changes in fashion or price movements.
Additionally, the increasing interest in handcraft and minimalistic designs keeps fine jewellery fashionable for younger end customers. Many prefer one-of-a-kind pieces, mixing heritage with a contemporary style. Therefore, fine jewellery retains the top market share due to its emotional value, cultural significance, and consistent demand across generations.
By Sales Channel
- Retail Offline
- Retail Online
The highest share in the market, under the sales channel, is occupied by retail offline, which accounts for around 95% of the total sales. The majority of end users still prefer visiting physical jewellery stores personally and selectively look at and try out items before buying. All this goes on to instill confidence and trust, especially when buying precious items such as gold or diamond jewellery. Offline stores also guide customers personally in order to assist end users with selecting designs for weddings, as a gift, and on different occasions.
Besides, strong cultural habits and family traditions also support in-store shopping for luxury products. Though retail online channels have slowly gained attention, they remain secondary due to quality concerns and the emotional nature of buying jewellery. We believe that with its reliability, personal service, and established presence, retail offline now continues to dominate the market's sales landscape.
List of Companies Covered in Indonesia Jewellery Market
The companies listed below are highly influential in the Indonesia jewellery market, with a significant market share and a strong impact on industry developments.
- Felice Jewellery PT
- D'Paris Silver PT
- Luvitasindo PT
- Sumber Kreasi Cipta Logam PT
- LVMH Moët Hennessy Louis Vuitton SA
- Frank & Co PT
- Gold Martindo PT
- Chopard & Cie SA
- Kering SA
- Tiffany & Co
Frequently Asked Questions
Related Report
1. Market Segmentation
1.1. Research Scope
1.2. Research Methodology
1.3. Definitions and Assumptions
2. Executive Summary
3. Indonesia Jewellery Market Policies, Regulations, and Standards
4. Indonesia Jewellery Market Dynamics
4.1. Growth Factors
4.2. Challenges
4.3. Trends
4.4. Opportunities
5. Indonesia Jewellery Market Statistics, 2022-2032F
5.1. Market Size & Growth Outlook
5.1.1.By Revenues in USD Million
5.2. Market Segmentation & Growth Outlook
5.2.1.By Category
5.2.1.1. Costume Jewellery- Market Insights and Forecast 2022-2032, USD Million
5.2.1.2. Fine Jewellery- Market Insights and Forecast 2022-2032, USD Million
5.2.2.By Type
5.2.2.1. Earrings- Market Insights and Forecast 2022-2032, USD Million
5.2.2.2. Neckwear- Market Insights and Forecast 2022-2032, USD Million
5.2.2.3. Rings- Market Insights and Forecast 2022-2032, USD Million
5.2.2.4. Wristwear- Market Insights and Forecast 2022-2032, USD Million
5.2.2.5. Other- Market Insights and Forecast 2022-2032, USD Million
5.2.3.By Collection
5.2.3.1. Diamond- Market Insights and Forecast 2022-2032, USD Million
5.2.3.2. Non-Diamond- Market Insights and Forecast 2022-2032, USD Million
5.2.4.By Material Type
5.2.4.1. Gold- Market Insights and Forecast 2022-2032, USD Million
5.2.4.2. Platinum- Market Insights and Forecast 2022-2032, USD Million
5.2.4.3. Metal Combination- Market Insights and Forecast 2022-2032, USD Million
5.2.4.4. Silver- Market Insights and Forecast 2022-2032, USD Million
5.2.5.By Sales Channel
5.2.5.1. Retail Offline- Market Insights and Forecast 2022-2032, USD Million
5.2.5.2. Retail Online- Market Insights and Forecast 2022-2032, USD Million
5.2.6.By End User
5.2.6.1. Men- Market Insights and Forecast 2022-2032, USD Million
5.2.6.2. Women- Market Insights and Forecast 2022-2032, USD Million
5.2.7.By Competitors
5.2.7.1. Competition Characteristics
5.2.7.2. Market Share & Analysis
6. Indonesia Costume Jewellery Market Statistics, 2022-2032
6.1. Market Size & Growth Outlook
6.1.1.By Revenues in USD Million
6.2. Market Segmentation & Growth Outlook
6.2.1.By Type- Market Insights and Forecast 2022-2032, USD Million
6.2.2.By Collection- Market Insights and Forecast 2022-2032, USD Million
6.2.3.By Material Type- Market Insights and Forecast 2022-2032, USD Million
6.2.4.By Sales Channel- Market Insights and Forecast 2022-2032, USD Million
6.2.5.By End User- Market Insights and Forecast 2022-2032, USD Million
7. Indonesia Fine Jewellery Market Statistics, 2022-2032
7.1. Market Size & Growth Outlook
7.1.1.By Revenues in USD Million
7.2. Market Segmentation & Growth Outlook
7.2.1.By Type- Market Insights and Forecast 2022-2032, USD Million
7.2.2.By Collection- Market Insights and Forecast 2022-2032, USD Million
7.2.3.By Material Type- Market Insights and Forecast 2022-2032, USD Million
7.2.4.By Sales Channel- Market Insights and Forecast 2022-2032, USD Million
7.2.5.By End User- Market Insights and Forecast 2022-2032, USD Million
8. Competitive Outlook
8.1. Company Profiles
8.1.1.Sumber Kreasi Cipta Logam PT
8.1.1.1. Business Description
8.1.1.2. Product Portfolio
8.1.1.3. Collaborations & Alliances
8.1.1.4. Recent Developments
8.1.1.5. Financial Details
8.1.1.6. Others
8.1.2.LVMH Moët Hennessy Louis Vuitton SA
8.1.2.1. Business Description
8.1.2.2. Product Portfolio
8.1.2.3. Collaborations & Alliances
8.1.2.4. Recent Developments
8.1.2.5. Financial Details
8.1.2.6. Others
8.1.3.Frank & Co PT
8.1.3.1. Business Description
8.1.3.2. Product Portfolio
8.1.3.3. Collaborations & Alliances
8.1.3.4. Recent Developments
8.1.3.5. Financial Details
8.1.3.6. Others
8.1.4.Gold Martindo PT
8.1.4.1. Business Description
8.1.4.2. Product Portfolio
8.1.4.3. Collaborations & Alliances
8.1.4.4. Recent Developments
8.1.4.5. Financial Details
8.1.4.6. Others
8.1.5.Chopard & Cie SA
8.1.5.1. Business Description
8.1.5.2. Product Portfolio
8.1.5.3. Collaborations & Alliances
8.1.5.4. Recent Developments
8.1.5.5. Financial Details
8.1.5.6. Others
8.1.6.Felice Jewellery PT
8.1.6.1. Business Description
8.1.6.2. Product Portfolio
8.1.6.3. Collaborations & Alliances
8.1.6.4. Recent Developments
8.1.6.5. Financial Details
8.1.6.6. Others
8.1.7.D'Paris Silver PT
8.1.7.1. Business Description
8.1.7.2. Product Portfolio
8.1.7.3. Collaborations & Alliances
8.1.7.4. Recent Developments
8.1.7.5. Financial Details
8.1.7.6. Others
8.1.8.Luvitasindo PT
8.1.8.1. Business Description
8.1.8.2. Product Portfolio
8.1.8.3. Collaborations & Alliances
8.1.8.4. Recent Developments
8.1.8.5. Financial Details
8.1.8.6. Others
8.1.9.Kering SA
8.1.9.1. Business Description
8.1.9.2. Product Portfolio
8.1.9.3. Collaborations & Alliances
8.1.9.4. Recent Developments
8.1.9.5. Financial Details
8.1.9.6. Others
8.1.10. Tiffany & Co
8.1.10.1. Business Description
8.1.10.2. Product Portfolio
8.1.10.3. Collaborations & Alliances
8.1.10.4. Recent Developments
8.1.10.5. Financial Details
8.1.10.6. Others
9. Disclaimer
| Segment | Sub-Segment |
|---|---|
| By Category |
|
| By Type |
|
| By Collection |
|
| By Material Type |
|
| By Sales Channel |
|
| By End User |
|
Research Methodology
This study followed a structured approach comprising four key phases to assess the size and scope of the electro-oxidation market. The process began with thorough secondary research to collect data on the target market, related markets, and broader industry context. These findings, along with preliminary assumptions and estimates, were then validated through extensive primary research involving industry experts from across the value chain. To calculate the overall market size, both top-down and bottom-up methodologies were employed. Finally, market segmentation and data triangulation techniques were applied to refine and validate segment-level estimations.
Secondary Research
The secondary research phase involved gathering data from a wide range of credible and published sources. This step helped in identifying industry trends, defining market segmentation, and understanding the market landscape and value chain.
Sources consulted during this phase included:
- Company annual reports, investor presentations, and press releases
- Industry white papers and certified publications
- Trade directories and market-recognized databases
- Articles from authoritative authors and reputable journals
- Gold and silver standard websites
Secondary research was critical in mapping out the industry's value chain and monetary flow, identifying key market segments, understanding regional variations, and tracking significant industry developments.
Other key sources:
- Financial disclosures
- Industry associations and trade bodies
- News outlets and business magazines
- Academic journals and research studies
- Paid industry databases
Primary Research
To validate secondary data and gain deeper market insights, primary research was conducted with key stakeholders across both the supply and demand sides of the market.
On the demand side, participants included decision-makers and influencers from end-user industries—such as CIOs, CTOs, and CSOs—who provided first-hand perspectives on market needs, product usage, and future expectations.
On the supply side, interviews were conducted with manufacturers, industry associations, and institutional participants to gather insights into current offerings, product pipelines, and market challenges.
Primary interviews provided critical inputs such as:
- Market size and revenue data
- Product and service breakdowns
- Market forecasts
- Regional and application-specific trends
Stakeholders consulted included:
- Leading OEM and solution providers
- Channel and distribution partners
- End users across various applications
- Independent consultants and industry specialists
Market Size Estimation and Data Triangulation
- Identifying Key Market Participants (Secondary Research)
- Goal: To identify the major players or companies in the target market. This typically involves using publicly available data sources such as industry reports, market research publications, and financial statements of companies.
- Tools: Reports from firms like Gartner, Forrester, Euromonitor, Statista, IBISWorld, and others. Public financial statements, news articles, and press releases from top market players.
- Extracting Earnings of Key Market Participants
- Goal: To estimate the earnings generated from the product or service being analyzed. This step helps in understanding the revenue potential of each market player in a specific geography.
- Methods: Earnings data can be gathered from:
- Publicly available financial reports (for listed companies).
- Interviews and primary data sources from professionals, such as Directors, VPs, SVPs, etc. This is especially useful for understanding more nuanced, internal data that isn't publicly disclosed.
- Annual reports and investor presentations of key players.
- Data Collation and Development of a Relevant Data Model
- Goal: To collate inputs from both primary and secondary sources into a structured, data-driven model for market estimation. This model will incorporate key market KPIs and any independent variables relevant to the market.
- Key KPIs: These could include:
- Market size, growth rate, and demand drivers.
- Industry-specific metrics like market share, average revenue per customer (ARPC), or average deal size.
- External variables, such as economic growth rates, inflation rates, or commodity prices, that could affect the market.
- Data Modeling: Based on this data, the market forecasts are developed for the next 5 years. A combination of trend analysis, scenario modeling, and statistical regression might be used to generate projections.
- Scenario Analysis
- Goal: To test different assumptions and validate how sensitive the market is to changes in key variables (e.g., market demand, regulatory changes, technological disruptions).
- Types of Scenarios:
- Base Case: Based on current assumptions and historical data.
- Best-Case Scenario: Assuming favorable market conditions, regulatory environments, and technological advancements.
- Worst-Case Scenario: Accounting for adverse factors, such as economic downturns, stricter regulations, or unexpected disruptions.


