Indonesia Footwear Market Report: Trends, Growth and Forecast (2026-2032)
By Category (Children's Footwear (Infants (0-9 Months) Foot Length (CM) (8.3-8.9, 9.2-9.5, 10.1-10.5), Toddlers (9 Months - 4 Years) Foot Length (CM) (10.8, 11.4-11.7, 12.1-12.7, 13.0-13.3, 14.0-14.3, 14.6-15.2, 15.6-15.9, 16.5), Little Kids (4-7 Years) Foot Length (CM) (16.8, 17.1-17.8, 18.1-18.4, 19.1-19.4, 19.7-20.6, 21.0-21.6), Big Kids (7-12 Years) Foot Length (CM) (21.9, 22.2-23.5, 24.1-24.8)), Women's Footwear (Foot Length (CM) (20.8, 21.3-21.6, 22.2-22.5, 23.0-23.8, 24.1-24.6, 25.1-25.9, 26.2-26.7, 27.6)), Men's Footwear (Foot Length (CM) (23.5, 24.1-24.8, 25.4-25.7, 26.0-26.7, 27.0-27.9, 28.3-28.6, 29.4, 30.2, 31.0-31.8))), By Product Type (Casual, Athletic/Sports, Formal, Others), By Sales Channel (Retail Online, Retail Offline), By Material (Leather, Textile, Rubber, Synthetic, Canvas), By Price (Mass, Premium), By Footwear Type (Shoes (Sneakers, Boots), Sandals & Slippers (Flip-Flops)), By Application (Conventional Footwear (Daily Wear, Work/Office Wear, Outdoor & Adventure, Sports & Fitness, Party/Occasion Wear), Functional/Therapeutic Footwear (Therapeutic/Orthopedic, Medicated Slippers, Acupressure Slippers)), By Region (Sumatra, Java, Kalimantan, Sulawesi, Others) ... Read more
|
Major Players
|
Indonesia Footwear Market Statistics and Insights, 2026
- Market Size Statistics
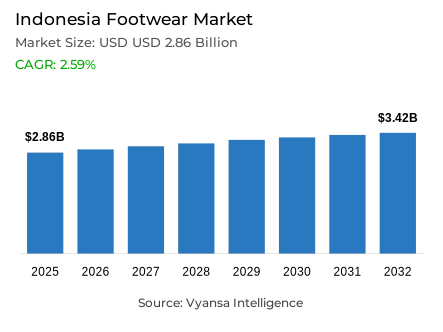
- Footwear in Indonesia is estimated at USD 2.86 billion in 2025.
- The market size is expected to grow to USD 3.42 billion by 2032.
- Market to register a cagr of around 2.59% during 2026-32.
- Category Shares
- Women's footwear grabbed market share of 40%.
- Competition
- More than 20 companies are actively engaged in producing footwear in Indonesia.
- Top 5 companies acquired around 5% of the market share.
- Global Fashion Indonesia; Sumber Kreasi Fumiko; Nike Inc; Skechers USA Inc; PT Adidas Indonesia etc., are few of the top companies.
- Sales Channel
- Retail offline grabbed 65% of the market.
Indonesia Footwear Market Outlook
The Indonesia footwear market will continue to grow steadily from 2026–2032 due to the rising trend of footwear as a fashion and lifestyle statement. The market is expected to reach USD 2.86 billion in 2025 and USD 3.42 billion in 2032, with a CAGR of approximately 2.59%. Sneakers are at the forefront of this trend, as they have evolved from being mere functional products to symbolize personal identity for all age groups and both genders. Social media, fashion trends, and the increasing trend of online retail have all led to the incorporation of sneakers into everyday life, not necessarily as sports or fitness wear.
The demand is expected to be fueled by casual and sports-related footwear during the forecast period, which is in sync with the current trend of athleisure and comfort-based fashion. New materials such as breathable fabrics, adjustable soles, and eco-friendly designs are all adding to the end user interest. At the same time, collaborations between performance brands and luxury designers are redefining footwear by combining high-end design with technical capabilities, further cementing sneakers as a cultural and lifestyle product, rather than just sports footwear.
Women footwear has the highest share of approximately 40% by category, indicating high demand of footwear that is versatile, stylish, comfortable, and useful in everyday life. The trend of wearing sneakers and casual shoes is becoming a common wardrobe among women due to fashion-oriented designs and work and lifestyle trends. This segment is likely to be the dominant one as brands keep on coming up with designs that are performance-based, attractive, and affordable.
Retail offline, with brand-owned stores and specialty stores offering customized services like foot-scanning technology, accounts for around 65% of overall sales. As the global brands continue to lead in the higher income segments, the local manufacturers face difficulties due to the reduced domestic demand and export pressures. However, innovation, customization, and positive brand experiences are expected to sustain the overall market growth until 2032.

Indonesia Footwear Market Growth Driver
Urbanisation Anchoring Daily Footwear Demand
Sustained urbanisation across Indonesia continues to support the footwear market by reinforcing routine footwear usage in commuting, professional settings, educational environments, and daily social activities.In 2023, the urban population of Indonesia constituted 59% of the total population as per the World Bank, which is a long-term trend of transition to urban living patterns. City dwellers generally need shoes that can be used in terms of regular movement, extended daily use, and multi-purpose application, which generates stable replacement demand in both casual and lifestyle segments.
With the growth of urban lifestyles, footwear is now considered a practical everyday need and not a luxury item. Casual and sport-related styles are easily integrated into urban lifestyles, and they encourage regular consumption even when the economy is restrained. This structural change of lifestyle remains to stabilize the demand of the baseline footwear and gives the Indonesian market a long-term stability.
Indonesia Footwear Market Challenge
Manufacturing Strain Amid Weaker Demand Cycles
Persistent pressure on domestic manufacturing capacity has emerged within Indonesia’s footwear market, driven by subdued global demand and a more cautious discretionary spending environment among Indonesia’s end users. In 2023 as per the World Bank, manufacturing value added constituted 19% of GDP, which underscores a decelerating industrial trend that impacts labour-intensive industries like footwear. Export-based manufacturers experience fewer orders to large foreign markets, which affects the volume of production and the stability of employment.
Domestically, consumer spending has been redirected towards necessities, restricting discretionary purchases of footwear by lower-income earners. This climate limits the flexibility of pricing and margins of local producers. In the meantime, global brands that have more robust supply chains and financial cushions are more resilient, which puts a competitive advantage in the domestic footwear ecosystem.
Unlock Market Intelligence
Explore the market potential with our data-driven report
Indonesia Footwear Market Trend
Shift Toward Casual, Comfort-First Footwear Choices
An observable shift in end-user preferences is reshaping the footwear market in Indonesia, with increasing demand for casual and comfort-oriented footwear suitable for everyday wear. The increasing need for versatility and wearability rather than formal looks is a consequence of more flexible work environments, social settings, and lifestyle changes that took place during and after the pandemic. This shift in behavior is also aided by the increasing urbanization, where commuting and spending more time outside the house on a daily basis makes comfortable shoes a need. In 2023, the urban population of Indonesia accounted for 59% of the total population as per the World Bank, which increases the demand for sneakers and casual shoes that can be worn throughout the day.
At the same time, there is a growing awareness about health and foot comfort, cushioning, and durability. The sneakers and sport-themed shoes are no longer confined to the sports domain but have been included in the work, leisure, and social wardrobe. This trend is indicative of a larger behavioural change in which footwear buying behaviour is becoming more and more influenced by comfort, utility and lifestyle compatibility as opposed to occasion-specific fashion alone and is redefining the product demand in the Indonesian market.
Indonesia Footwear Market Opportunity
Experiential Retail and Personalisation
A significant opportunity within the Indonesia footwear market lies in the expansion of experiential retail formats and the adoption of personalisation-driven strategies This is facilitated by the fact that household consumption is being reinforced, which still forms the basis of discretionary spending in the urban regions. The household final consumption expenditure in Indonesia increased by 5.1% in 2023 as per the World Bank, which means that the end user demand is stable in the country despite the economic pressure in the world.
With the stabilisation of purchasing power, end users are becoming more and more interested in shopping experiences that extend beyond simple affordability. Foot scanning, customised fit recommendations, and guided in-store services are technologies that increase perceived product value and customer satisfaction. These experiential aspects promote brand loyalty and facilitate premium positioning. Through physical retail interaction and digital impact, footwear brands will be able to stand out and establish better long-term end user relationships in Indonesia.
Unlock Market Intelligence
Explore the market potential with our data-driven report
Indonesia Footwear Market Segmentation Analysis
By Category
- Children's Footwear
- Infants (0-9 Months) Foot Length (CM)
- 8.3-8.9
- 9.2-9.5
- 10.1-10.5
- Toddlers (9 Months - 4 Years) Foot Length (CM)
- 10.8
- 11.4-11.7
- 12.1-12.7
- 13.0-13.3
- 14.0-14.3
- 14.6-15.2
- 15.6-15.9
- 16.5
- Little Kids (4-7 Years) Foot Length (CM)
- 16.8
- 17.1-17.8
- 18.1-18.4
- 19.1-19.4
- 19.7-20.6
- 21.0-21.6
- Big Kids (7-12 Years) Foot Length (CM)
- 21.9
- 22.2-23.5
- 24.1-24.8
- Infants (0-9 Months) Foot Length (CM)
- Women's Footwear
- Foot Length (CM)
- 20.8
- 21.3-21.6
- 22.2-22.5
- 23.0-23.8
- 24.1-24.6
- 25.1-25.9
- 26.2-26.7
- 27.6
- Foot Length (CM)
- Men's Footwear
- Foot Length (CM)
- 23.5
- 24.1-24.8
- 25.4-25.7
- 26.0-26.7
- 27.0-27.9
- 28.3-28.6
- 29.4
- 30.2
- 31.0-31.8
- Foot Length (CM)
The category with the largest share in the division of categories is Women’s Footwear, which currently represents 40% of the market. This is due to the higher purchase and usage rates of footwear in work, casual, and social settings. Women generally have a larger footwear repertoire, hence the stronger replacement cycles and demand.
Fashion sensitivity and quicker style turns also contribute to the dominance of this category. Comfort-driven fashion trends are driving the adoption of sneakers, casual flats, and lifestyle footwear. Such dynamics make women’s footwear the largest and most stable category in the Indonesian footwear market.

By Sales Channel
- Retail Online
- Retail Offline
The category with the largest share in the sales channel division is Retail Offline, which accounts for approximately 65% of the total footwear sales. This is because physical stores are important for assessing the fit of the footwear, as well as for the comfort and availability of the product.
The offline retail category also enables offline experiences like personalized service and selection. Although online platforms have a significant impact on discovery and decision-making, the final purchase is made in physical stores.
List of Companies Covered in Indonesia Footwear Market
The companies listed below are highly influential in the Indonesia footwear market, with a significant market share and a strong impact on industry developments.
- Global Fashion Indonesia
- Sumber Kreasi Fumiko
- Nike Inc
- Skechers USA Inc
- PT Adidas Indonesia
- Sepatu Bata Tbk PT
- Nike Indonesia PT
- Collective Brands Inc
- Fladeo PT
- H&M Indonesia
Competitive Landscape
Indonesia’s footwear market is increasingly shaped by global sportswear and lifestyle brands that dominate sneaker culture and innovation-led retail experiences. International players such as Nike, adidas, New Balance, Asics, Hoka, and Puma hold strong positions, benefiting from brand prestige, limited-edition launches, and collaborations that blur the lines between fashion and performance. These brands are further strengthening competitiveness through technology-driven in-store experiences, including foot-scanning and gait analysis, which enhance personalisation and consumer trust. Luxury–activewear collaborations, such as those involving On Running and New Balance, are reinforcing premium appeal among trend-conscious consumers. While local brands like MTW and collaborative efforts such as Salomon Indonesia x Mote Mote add creative differentiation, international brands continue to dominate due to scale, innovation capability, and appeal to middle- and upper-income segments.
Frequently Asked Questions
Related Report
1. Market Segmentation
1.1. Research Scope
1.2. Research Methodology
1.3. Definitions and Assumptions
2. Executive Summary
3. Indonesia Footwear Market Policies, Regulations, and Standards
4. Indonesia Footwear Market Dynamics
4.1. Growth Factors
4.2. Challenges
4.3. Trends
4.4. Opportunities
5. Indonesia Footwear Market Statistics, 2022-2032F
5.1. Market Size & Growth Outlook
5.1.1.By Revenues in USD Million
5.1.2.By Units Sold in Thousand Units
5.2. Market Segmentation & Growth Outlook
5.2.1.By Category
5.2.1.1. Children's Footwear- Market Insights and Forecast 2022-2032, USD Million
5.2.1.1.1. Infants (0-9 Months) Foot Length (CM)- Market Insights and Forecast 2022-2032, USD Million
5.2.1.1.1.1. 8.3-8.9- Market Insights and Forecast 2022-2032, USD Million
5.2.1.1.1.2. 9.2-9.5- Market Insights and Forecast 2022-2032, USD Million
5.2.1.1.1.3. 10.1-10.5- Market Insights and Forecast 2022-2032, USD Million
5.2.1.1.2. Toddlers (9 Months - 4 Years) Foot Length (CM)- Market Insights and Forecast 2022-2032, USD Million
5.2.1.1.2.1. 10.8- Market Insights and Forecast 2022-2032, USD Million
5.2.1.1.2.2. 11.4-11.7- Market Insights and Forecast 2022-2032, USD Million
5.2.1.1.2.3. 12.1-12.7- Market Insights and Forecast 2022-2032, USD Million
5.2.1.1.2.4. 13.0-13.3- Market Insights and Forecast 2022-2032, USD Million
5.2.1.1.2.5. 14.0-14.3- Market Insights and Forecast 2022-2032, USD Million
5.2.1.1.2.6. 14.6-15.2- Market Insights and Forecast 2022-2032, USD Million
5.2.1.1.2.7. 15.6-15.9- Market Insights and Forecast 2022-2032, USD Million
5.2.1.1.2.8. 16.5- Market Insights and Forecast 2022-2032, USD Million
5.2.1.1.3. Little Kids (4-7 Years) Foot Length (CM)- Market Insights and Forecast 2022-2032, USD Million
5.2.1.1.3.1. 16.8- Market Insights and Forecast 2022-2032, USD Million
5.2.1.1.3.2. 17.1-17.8- Market Insights and Forecast 2022-2032, USD Million
5.2.1.1.3.3. 18.1-18.4- Market Insights and Forecast 2022-2032, USD Million
5.2.1.1.3.4. 19.1-19.4- Market Insights and Forecast 2022-2032, USD Million
5.2.1.1.3.5. 19.7-20.6- Market Insights and Forecast 2022-2032, USD Million
5.2.1.1.3.6. 21.0-21.6- Market Insights and Forecast 2022-2032, USD Million
5.2.1.1.4. Big Kids (7-12 Years) Foot Length (CM)- Market Insights and Forecast 2022-2032, USD Million
5.2.1.1.4.1. 21.9- Market Insights and Forecast 2022-2032, USD Million
5.2.1.1.4.2. 22.2-23.5- Market Insights and Forecast 2022-2032, USD Million
5.2.1.1.4.3. 24.1-24.8- Market Insights and Forecast 2022-2032, USD Million
5.2.1.2. Women's Footwear- Market Insights and Forecast 2022-2032, USD Million
5.2.1.2.1. Foot Length (CM)- Market Insights and Forecast 2022-2032, USD Million
5.2.1.2.1.1. 20.8- Market Insights and Forecast 2022-2032, USD Million
5.2.1.2.1.2. 21.3-21.6- Market Insights and Forecast 2022-2032, USD Million
5.2.1.2.1.3. 22.2-22.5- Market Insights and Forecast 2022-2032, USD Million
5.2.1.2.1.4. 23.0-23.8- Market Insights and Forecast 2022-2032, USD Million
5.2.1.2.1.5. 24.1-24.6- Market Insights and Forecast 2022-2032, USD Million
5.2.1.2.1.6. 25.1-25.9- Market Insights and Forecast 2022-2032, USD Million
5.2.1.2.1.7. 26.2-26.7- Market Insights and Forecast 2022-2032, USD Million
5.2.1.2.1.8. 27.6- Market Insights and Forecast 2022-2032, USD Million
5.2.1.3. Men's Footwear- Market Insights and Forecast 2022-2032, USD Million
5.2.1.3.1. Foot Length (CM)- Market Insights and Forecast 2022-2032, USD Million
5.2.1.3.1.1. 23.5- Market Insights and Forecast 2022-2032, USD Million
5.2.1.3.1.2. 24.1-24.8- Market Insights and Forecast 2022-2032, USD Million
5.2.1.3.1.3. 25.4-25.7- Market Insights and Forecast 2022-2032, USD Million
5.2.1.3.1.4. 26.0-26.7- Market Insights and Forecast 2022-2032, USD Million
5.2.1.3.1.5. 27.0-27.9- Market Insights and Forecast 2022-2032, USD Million
5.2.1.3.1.6. 28.3-28.6- Market Insights and Forecast 2022-2032, USD Million
5.2.1.3.1.7. 29.4- Market Insights and Forecast 2022-2032, USD Million
5.2.1.3.1.8. 30.2- Market Insights and Forecast 2022-2032, USD Million
5.2.1.3.1.9. 31.0-31.8- Market Insights and Forecast 2022-2032, USD Million
5.2.2.By Product Type
5.2.2.1. Casual- Market Insights and Forecast 2022-2032, USD Million
5.2.2.2. Athletic/Sports- Market Insights and Forecast 2022-2032, USD Million
5.2.2.3. Formal- Market Insights and Forecast 2022-2032, USD Million
5.2.2.4. Others- Market Insights and Forecast 2022-2032, USD Million
5.2.3.By Sales Channel
5.2.3.1. Retail Online- Market Insights and Forecast 2022-2032, USD Million
5.2.3.2. Retail Offline- Market Insights and Forecast 2022-2032, USD Million
5.2.4.By Material
5.2.4.1. Leather- Market Insights and Forecast 2022-2032, USD Million
5.2.4.2. Textile- Market Insights and Forecast 2022-2032, USD Million
5.2.4.3. Rubber- Market Insights and Forecast 2022-2032, USD Million
5.2.4.4. Synthetic- Market Insights and Forecast 2022-2032, USD Million
5.2.4.5. Canvas- Market Insights and Forecast 2022-2032, USD Million
5.2.5.By Price
5.2.5.1. Mass- Market Insights and Forecast 2022-2032, USD Million
5.2.5.2. Premium- Market Insights and Forecast 2022-2032, USD Million
5.2.6.By Footwear Type
5.2.6.1. Shoes- Market Insights and Forecast 2022-2032, USD Million
5.2.6.1.1. Sneakers- Market Insights and Forecast 2022-2032, USD Million
5.2.6.1.2. Boots- Market Insights and Forecast 2022-2032, USD Million
5.2.6.2. Sandals & Slippers- Market Insights and Forecast 2022-2032, USD Million
5.2.6.2.1. Flip-Flops- Market Insights and Forecast 2022-2032, USD Million
5.2.7.By Application
5.2.7.1. Conventional Footwear- Market Insights and Forecast 2022-2032, USD Million
5.2.7.1.1. Daily Wear- Market Insights and Forecast 2022-2032, USD Million
5.2.7.1.2. Work/Office Wear- Market Insights and Forecast 2022-2032, USD Million
5.2.7.1.3. Outdoor & Adventure- Market Insights and Forecast 2022-2032, USD Million
5.2.7.1.4. Sports & Fitness- Market Insights and Forecast 2022-2032, USD Million
5.2.7.1.5. Party/Occasion Wear- Market Insights and Forecast 2022-2032, USD Million
5.2.7.2. Functional/Therapeutic Footwear- Market Insights and Forecast 2022-2032, USD Million
5.2.7.2.1. Therapeutic/Orthopedic- Market Insights and Forecast 2022-2032, USD Million
5.2.7.2.2. Medicated Slippers- Market Insights and Forecast 2022-2032, USD Million
5.2.7.2.3. Acupressure Slippers- Market Insights and Forecast 2022-2032, USD Million
5.2.8.By Region
5.2.8.1. Sumatra
5.2.8.2. Java
5.2.8.3. Kalimantan
5.2.8.4. Sulawesi
5.2.8.5. Others
5.2.9.By Competitors
5.2.9.1. Competition Characteristics
5.2.9.2. Market Share & Analysis
6. Indonesia Children's Footwear Market Statistics, 2022-2032
6.1. Market Size & Growth Outlook
6.1.1.By Revenues in USD Million
6.1.2.By Units Sold in Thousand Units
6.2. Market Segmentation & Growth Outlook
6.2.1.By Category- Market Insights and Forecast 2022-2032, USD Million
6.2.2.By Product Type- Market Insights and Forecast 2022-2032, USD Million
6.2.3.By Sales Channel- Market Insights and Forecast 2022-2032, USD Million
6.2.4.By Material- Market Insights and Forecast 2022-2032, USD Million
6.2.5.By Price- Market Insights and Forecast 2022-2032, USD Million
6.2.6.By Footwear Type- Market Insights and Forecast 2022-2032, USD Million
6.2.7.By Application- Market Insights and Forecast 2022-2032, USD Million
6.2.8.By Region- Market Insights and Forecast 2022-2032, USD Million
7. Indonesia Women's Footwear Market Statistics, 2022-2032
7.1. Market Size & Growth Outlook
7.1.1.By Revenues in USD Million
7.1.2.By Units Sold in Thousand Units
7.2. Market Segmentation & Growth Outlook
7.2.1.By Category- Market Insights and Forecast 2022-2032, USD Million
7.2.2.By Product Type- Market Insights and Forecast 2022-2032, USD Million
7.2.3.By Sales Channel- Market Insights and Forecast 2022-2032, USD Million
7.2.4.By Material- Market Insights and Forecast 2022-2032, USD Million
7.2.5.By Price- Market Insights and Forecast 2022-2032, USD Million
7.2.6.By Footwear Type- Market Insights and Forecast 2022-2032, USD Million
7.2.7.By Application- Market Insights and Forecast 2022-2032, USD Million
7.2.8.By Region- Market Insights and Forecast 2022-2032, USD Million
8. Indonesia Men's Footwear Market Statistics, 2022-2032
8.1. Market Size & Growth Outlook
8.1.1.By Revenues in USD Million
8.1.2.By Units Sold in Thousand Units
8.2. Market Segmentation & Growth Outlook
8.2.1.By Category- Market Insights and Forecast 2022-2032, USD Million
8.2.2.By Product Type- Market Insights and Forecast 2022-2032, USD Million
8.2.3.By Sales Channel- Market Insights and Forecast 2022-2032, USD Million
8.2.4.By Material- Market Insights and Forecast 2022-2032, USD Million
8.2.5.By Price- Market Insights and Forecast 2022-2032, USD Million
8.2.6.By Footwear Type- Market Insights and Forecast 2022-2032, USD Million
8.2.7.By Application- Market Insights and Forecast 2022-2032, USD Million
8.2.8.By Region- Market Insights and Forecast 2022-2032, USD Million
9. Competitive Outlook
9.1. Company Profiles
9.1.1.Skechers USA Inc
9.1.1.1. Business Description
9.1.1.2. Product Portfolio
9.1.1.3. Collaborations & Alliances
9.1.1.4. Recent Developments
9.1.1.5. Financial Details
9.1.1.6. Others
9.1.2.PT Adidas Indonesia
9.1.2.1. Business Description
9.1.2.2. Product Portfolio
9.1.2.3. Collaborations & Alliances
9.1.2.4. Recent Developments
9.1.2.5. Financial Details
9.1.2.6. Others
9.1.3.Sepatu Bata Tbk PT
9.1.3.1. Business Description
9.1.3.2. Product Portfolio
9.1.3.3. Collaborations & Alliances
9.1.3.4. Recent Developments
9.1.3.5. Financial Details
9.1.3.6. Others
9.1.4.Nike Indonesia PT
9.1.4.1. Business Description
9.1.4.2. Product Portfolio
9.1.4.3. Collaborations & Alliances
9.1.4.4. Recent Developments
9.1.4.5. Financial Details
9.1.4.6. Others
9.1.5.Collective Brands Inc
9.1.5.1. Business Description
9.1.5.2. Product Portfolio
9.1.5.3. Collaborations & Alliances
9.1.5.4. Recent Developments
9.1.5.5. Financial Details
9.1.5.6. Others
9.1.6.Global Fashion Indonesia PT
9.1.6.1. Business Description
9.1.6.2. Product Portfolio
9.1.6.3. Collaborations & Alliances
9.1.6.4. Recent Developments
9.1.6.5. Financial Details
9.1.6.6. Others
9.1.7.Sumber Kreasi Fumiko PT
9.1.7.1. Business Description
9.1.7.2. Product Portfolio
9.1.7.3. Collaborations & Alliances
9.1.7.4. Recent Developments
9.1.7.5. Financial Details
9.1.7.6. Others
9.1.8.Nike Inc
9.1.8.1. Business Description
9.1.8.2. Product Portfolio
9.1.8.3. Collaborations & Alliances
9.1.8.4. Recent Developments
9.1.8.5. Financial Details
9.1.8.6. Others
9.1.9.Trus Megatara Fladeo PT
9.1.9.1. Business Description
9.1.9.2. Product Portfolio
9.1.9.3. Collaborations & Alliances
9.1.9.4. Recent Developments
9.1.9.5. Financial Details
9.1.9.6. Others
9.1.10. H&M Hennes & Mauritz AB
9.1.10.1. Business Description
9.1.10.2. Product Portfolio
9.1.10.3. Collaborations & Alliances
9.1.10.4. Recent Developments
9.1.10.5. Financial Details
9.1.10.6. Others
10. Disclaimer
| Segment | Sub-Segment |
|---|---|
| By Category |
|
| By Product Type |
|
| By Sales Channel |
|
| By Material |
|
| By Price |
|
| By Footwear Type |
|
| By Application |
|
| By Region |
|
Research Methodology
This study followed a structured approach comprising four key phases to assess the size and scope of the electro-oxidation market. The process began with thorough secondary research to collect data on the target market, related markets, and broader industry context. These findings, along with preliminary assumptions and estimates, were then validated through extensive primary research involving industry experts from across the value chain. To calculate the overall market size, both top-down and bottom-up methodologies were employed. Finally, market segmentation and data triangulation techniques were applied to refine and validate segment-level estimations.
Secondary Research
The secondary research phase involved gathering data from a wide range of credible and published sources. This step helped in identifying industry trends, defining market segmentation, and understanding the market landscape and value chain.
Sources consulted during this phase included:
- Company annual reports, investor presentations, and press releases
- Industry white papers and certified publications
- Trade directories and market-recognized databases
- Articles from authoritative authors and reputable journals
- Gold and silver standard websites
Secondary research was critical in mapping out the industry's value chain and monetary flow, identifying key market segments, understanding regional variations, and tracking significant industry developments.
Other key sources:
- Financial disclosures
- Industry associations and trade bodies
- News outlets and business magazines
- Academic journals and research studies
- Paid industry databases
Primary Research
To validate secondary data and gain deeper market insights, primary research was conducted with key stakeholders across both the supply and demand sides of the market.
On the demand side, participants included decision-makers and influencers from end-user industries—such as CIOs, CTOs, and CSOs—who provided first-hand perspectives on market needs, product usage, and future expectations.
On the supply side, interviews were conducted with manufacturers, industry associations, and institutional participants to gather insights into current offerings, product pipelines, and market challenges.
Primary interviews provided critical inputs such as:
- Market size and revenue data
- Product and service breakdowns
- Market forecasts
- Regional and application-specific trends
Stakeholders consulted included:
- Leading OEM and solution providers
- Channel and distribution partners
- End users across various applications
- Independent consultants and industry specialists
Market Size Estimation and Data Triangulation
- Identifying Key Market Participants (Secondary Research)
- Goal: To identify the major players or companies in the target market. This typically involves using publicly available data sources such as industry reports, market research publications, and financial statements of companies.
- Tools: Reports from firms like Gartner, Forrester, Euromonitor, Statista, IBISWorld, and others. Public financial statements, news articles, and press releases from top market players.
- Extracting Earnings of Key Market Participants
- Goal: To estimate the earnings generated from the product or service being analyzed. This step helps in understanding the revenue potential of each market player in a specific geography.
- Methods: Earnings data can be gathered from:
- Publicly available financial reports (for listed companies).
- Interviews and primary data sources from professionals, such as Directors, VPs, SVPs, etc. This is especially useful for understanding more nuanced, internal data that isn't publicly disclosed.
- Annual reports and investor presentations of key players.
- Data Collation and Development of a Relevant Data Model
- Goal: To collate inputs from both primary and secondary sources into a structured, data-driven model for market estimation. This model will incorporate key market KPIs and any independent variables relevant to the market.
- Key KPIs: These could include:
- Market size, growth rate, and demand drivers.
- Industry-specific metrics like market share, average revenue per customer (ARPC), or average deal size.
- External variables, such as economic growth rates, inflation rates, or commodity prices, that could affect the market.
- Data Modeling: Based on this data, the market forecasts are developed for the next 5 years. A combination of trend analysis, scenario modeling, and statistical regression might be used to generate projections.
- Scenario Analysis
- Goal: To test different assumptions and validate how sensitive the market is to changes in key variables (e.g., market demand, regulatory changes, technological disruptions).
- Types of Scenarios:
- Base Case: Based on current assumptions and historical data.
- Best-Case Scenario: Assuming favorable market conditions, regulatory environments, and technological advancements.
- Worst-Case Scenario: Accounting for adverse factors, such as economic downturns, stricter regulations, or unexpected disruptions.


