India Fertilizes Market Report: Trends, Growth and Forecast (2026-2032)
By Product Type (Straight Fertilizers (Nitrogenous, Phosphatic, Potassic), Complex/Compound Fertilizers (NP, PK, NPK), Secondary Nutrient Fertilizers, Micronutrient Fertilizers, Organic & Biofertilizers), By Form (Conventional Fertilizers, Specialty Fertilizers), By Application Method (Soil Application, Fertigation, Foliar Application), By Application Timing (Basal/Pre-plant, At-planting/Starter, In-season/Top-dress, Post-harvest/Soil-conditioning), By Crop Type (Cereals & Grains, Oilseeds & Pulses, Fruits & Vegetables, Plantation & Commercial Crops, Turf & Ornamentals, Other Crops), By End User (Commercial Farms, Smallholder Farms, Protected Cultivation Growers, Institutional/Landscape Users, Household/Retail Gardeners), By Distribution Channel (Retail Offline (Distributor/Dealer Network, Cooperatives/Agri-input Retailers), Retail Online (Online/E-commerce Retail, Non-Retail/Direct (Direct Sales, Institutional/Tender-based Sales))), By Region (North India (Uttar Pradesh, Punjab, Haryana, Rajasthan), West India (Maharashtra, Gujarat), East India (West Bengal, Bihar, Odisha), South India (Andhra Pradesh, Telangana, Karnataka, Tamil Nadu), Central India (Madhya Pradesh, Chhattisgarh))
|
Major Players
|
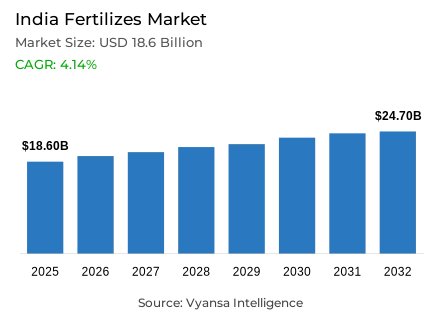
India Fertilizes Market Statistics and Insights, 2026
- Market Size Statistics
- Fertilizes market size in India was valued at USD 18.6 billion in 2025 and is estimated at USD 20 billion in 2026.
- The market size is expected to grow to USD 24.7 billion by 2032.
- Market to register a CAGR of around 4.14% during 2026-32.
- Product Type Shares
- Straight fertilizers grabbed market share of 80%.
- Competition
- More than 10 companies are actively engaged in producing fertilizes in India.
- Top 5 companies acquired around 35% of the market share.
- Indian Potash Limited (IPL), Rama Phosphates Limited, DCM Shriram Ltd., Coromandel International Ltd., Indian Farmers Fertiliser Cooperative Ltd. (IFFCO) etc., are few of the top companies.
- Application Method
- Soil application grabbed 85% of the market.
India Fertilizes Market Outlook
The India fertilizer market size was valued at USD 18.6 billion in 2025 and is projected to grow from USD 20 billion in 2026 to USD 24.7 billion by 2032, exhibiting a CAGR of 4.14% during the forecast period. This steady growth is underpinned by a robust subsidy architecture, with the Union Budget 2026-27 allocating USD 18.1 billionto shield farmers from global price volatility. As policy linked affordability remains a priority, the market continues to see strong demand across diverse cropping geographies, ensuring stable channel velocity and manufacturing utilization.
The structural backbone of the industry remains centered on traditional nutrient delivery, as straight fertilizers grabbed market share of 80%. This dominant position reflects a deep rooted preference for cost efficient and simple application methods among large scale agricultural users. While the market faces challenges from a heavy reliance on imported urea and DAP, the core demand for an India fertilizer product is sustained by extensive rural distribution networks and a subsidy framework that prioritizes indigenous and imported phosphatic and potassic nutrients.
Field level adoption patterns are primarily defined by conventional practices, particularly as soil application grabbed 85% of the market. This near total dominance is supported by long standing farmer familiarity and the compatibility of existing product formulations with standard equipment. However, the landscape of the India fertilizer sector is evolving through the commercialization of nano-technology; cumulative sales of nano urea and nano DAP have already reached millions of bottles, demonstrating a fundamental shift toward nutrient optimization and yield enhancement.
Looking ahead, the deployment of soil intelligence infrastructure, including the distribution of over 25.55 crore Soil Health Cards, is unlocking new opportunities for precision nutrients. Government initiatives like PM-PRANAM are further incentivizing the reduction of chemical usage in favor of alternative, higher-margin formulations. As the industry moves toward 2032, the integration of data-driven soil health profiles and innovative delivery formats will allow an India fertilizer to transition from a bulk commodity to a targeted efficacy solution, balancing traditional volume with modern sustainability.

India Fertilizes Market Growth DriverSubsidy Architecture Sustains Consumption and Channel Velocity
In India, the main structural driver of fertilizer demand continuity is the "policy-linked affordability" support mechanism, which helps insulate the agricultural industry's purchase decisions from the volatility of global commodity prices. With the subsidy framework, farmers are provided a macroeconomic transfer of risk from the agricultural end-user to ensure the volume of consumption is based on agronomic necessity and not price sensitivity. The fixity of this policy mechanism establishes a demand floor that supports the velocity of channel movement, utilization of manufacturing facilities, and investment in distribution throughout the fertilizer value chain irrespective of international commodity markets' volatility.
The monetary magnitude of this policy commitment is demonstrated with precision by its impact on the sustainability of the fertilizer market. The Union Budget 2026-27 allocates USD 18.1 billion to the Department of Fertilizers, specifically directed at preserving product affordability and shielding farmers from global price and supply disruptions. Over the 2022-23 to 2024-25 period, more than USD 21.5 billion in subsidies are allocated for indigenous and imported phosphatic and potassic fertilizers, while approved Rabi 2025-26 subsidy rates are maintained to ensure smooth availability at subsidized and reasonable prices. This sustained fiscal commitment preserves regular purchase behavior, keeps distribution channel movement active, and remains the foundational engine of fertilizer demand continuity through 2032.
India Fertilizes Market ChallengeImport Dependence Compounds Supply and Pricing Vulnerability
The foundation of domestic fertilizer production is based on importing nutrients and as such, has created present-day vulnerabilities for those products which will negatively impact supply reliability and price visibility throughout the domestic agricultural sector. For example, both urea and diammonium phosphate are heavily reliant on imported sources from countries with unstable economies or political climates. Therefore, if global supply chains deteriorate, shipping restrictions occur and the cost of production increases due to currency fluctuations, there could be negative effects to both urea and diammonium phosphate prices within the domestic market even if domestic agricultural product demand is still strong because domestic policy can’t help you source these products outside of the U.S.
Import volume data reflects the scale and acceleration of this dependence with measurable clarity. The large scale implementation of soil health intelligence infrastructure is producing a transformational opportunity for value added fertilizer products, advisory linked sell models and precision nutrient solutions that address specific soil deficiency profiles versus general application guidelines. As farmer awareness of soil specific nutrient needs changes, the basis of farmer purchasing decisions move from general commodity volume to focus on targeted efficacy. This is creating the structural demand conditions that favour differentiated, higher margin product categories as opposed to more typical bulk commodity input categories.
Unlock Market Intelligence
Explore the market potential with our data-driven report
India Fertilizes Market TrendNano Fertilizer Commercialisation Redefines Nutrient Efficiency
The transition of nano fertilizers from pilot projects to scaled commercial application is a significant shift in the agricultural input ecosystem. It indicates a change in how the agricultural community thinks about, and measures, nutrient delivery efficiency in India. This transition shifts the competitive landscape from the areas of volume and price to agronomic performance, optimizing inputs and being environmentally sustainable, and will ultimately drive differentiation and premium placement of products as the market matures. From a manufacturer or distributor’s perspective, the evolution of the nano fertilizer journey offers both an imperative for product development, as well as an opportunity to create channel capabilities.
Sales data indicate that this trend has already achieved a level of penetration into the marketplace beyond mere demonstrations. The cumulative number of nano fertilizer sales to date is 1,593.37 lakh bottles, which consists of 1,219.27 lakh bottles of Nano Urea and 374.10 lakh bottles of Nano DAP, both of which confirm to be utilized continually on a farm, through conventional distribution channels. The performance value proposition for nano fertilizers has also been validated in trials conducted by ICAR and the State Agricultural Universities. The use of Nano Urea (used together with the conventional recommended basal dose) has resulted in a reduction in urea usage by 25%-50% while increasing yields by 3%-8% for a wide variety of crop types. This convergence of efficiency evidence and scaled commercial distribution positions nano fertilizers as a structurally significant growth vector through 2032.
India Fertilizes Market OpportunitySoil Intelligence Infrastructure Unlocks Precision Nutrient Demand
The large scale deployment of soil health intelligence infrastructure is creating a transformative opportunity for value added fertilizer products, advisory integrated selling models, and precision nutrient solutions that address specific soil deficiency profiles rather than generic application norms. As farmer awareness of soil specific nutrient requirements deepens, the basis of purchasing decisions progressively shifts from commodity volume to targeted efficacy creating structural demand conditions that favor differentiated, higher margin product categories over conventional bulk inputs. This transition represents the most significant white space available to specialty fertilizer innovators in the current market environment.
The installed base of soil intelligence infrastructure is already substantial and continues to expand. More than 25.55 crore Soil Health Cards have been distributed as of mid November 2025, supported by over 93,000 farmer training programmes and approximately 6.8 lakh field demonstrations conducted through the scheme by July 2025. Complementing this awareness infrastructure, the PM PRANAM framework provides direct financial incentives equivalent to 50% of fertilizer subsidy savings to states that demonstrably reduce chemical fertilizer consumption against the prior three year average. This policy incentive structure accelerates the commercial viability of alternate nutrient products, customized formulations, and smarter nutrient planning solutions, creating compelling market entry conditions for value added offerings beyond conventional bulk supply through 2032
Unlock Market Intelligence
Explore the market potential with our data-driven report
India Fertilizes Market Segmentation Analysis
By Product Type
- Straight Fertilizers
- Nitrogenous
- Phosphatic
- Potassic
- Complex/Compound Fertilizers
- NP
- PK
- NPK
- Secondary Nutrient Fertilizers
- Micronutrient Fertilizers
- Organic & Biofertilizers
The segment with highest market share under the product type is straight fertilizers, accounting for approximately 80% of the total market. This dominant position reflects the deep rooted agronomic preference for direct nutrient products across India's diverse farming systems and cropping geographies. With four fifths of total market value concentrated within a single product category, straight fertilizers function as the structural backbone of the industry defining manufacturing priorities, channel investment allocation, and competitive strategy across the fertilizer value chain. Their commanding share confirms that large scale agricultural users continue to prioritize nutrient directness, cost efficiency, and application simplicity over complex formulation alternatives.
The enduring leadership of straight fertilizers is sustained by agronomic familiarity, extensive rural distribution penetration, and the reinforcing effect of subsidy structures calibrated around conventional nutrient products. This entrenched market position creates both a defensive moat for established players and a ceiling for undifferentiated new entrants. As efficiency oriented products including nano formats and specialty blends begin to penetrate the margins of this category, the competitive response from straight fertilizer incumbents will center on cost optimization, supply chain reliability, and channel loyalty reinforcement. The segment's structural centrality to product planning, value contribution, and market level performance is expected to remain intact through 2032.

By Application Method
- Soil Application
- Fertigation
- Foliar Application
The segment with highest market share under the application method is soil application, accounting for approximately 85% of the total market. This near total dominance reflects the deep operational entrenchment of field based nutrient delivery across India's agricultural landscape, where conventional soil treatment practices have been refined across generations of farming communities. The scale of this concentration with more than five-sixths of all fertilizer consumption occurring through direct soil placement demonstrates that alternative delivery methods, including foliar and fertigation systems, remain at the periphery of mainstream adoption despite growing agronomic awareness of their efficiency advantages.
The structural persistence of soil application dominance is reinforced by farmer familiarity, infrastructure availability, and the formulation compatibility of existing straight fertilizer products with conventional application equipment. This creates a self reinforcing adoption cycle that stabilizes volume through established channels while simultaneously limiting the pace at which precision delivery methods can displace incumbent practices. However, as soil health intelligence driven by the distribution of over 25.55 crore Soil Health Cards begins to inform more targeted nutrient placement decisions, the application method landscape may experience gradual shifts toward higher efficiency delivery formats. The segment's commanding position is expected to define demand formation and field level adoption patterns through 2032.
List of Companies Covered in India Fertilizes Market
The companies listed below are highly influential in the India fertilizes market, with a significant market share and a strong impact on industry developments.
- Indian Potash Limited (IPL)
- Rama Phosphates Limited
- DCM Shriram Ltd.
- Coromandel International Ltd.
- Indian Farmers Fertiliser Cooperative Ltd. (IFFCO)
- Mahadhan AgriTech Ltd.
- Gujarat Narmada Valley Fertilizers & Chemicals Ltd. (GNFC)
- Paradeep Phosphates Ltd.
- Gujarat State Fertilizers & Chemicals Ltd. (GSFC)
- ICL Fertilizers (India) Pvt. Ltd.
Market News & Updates
- Coromandel International Ltd, 2025:
Coromandel launched Fertinex in December 2025 as a next-generation water-soluble fertilizer powered by Smart Signalling Technology. This is relevant to the India fertilizers market because it expands the company’s nutrient portfolio into more precise, higher-efficiency fertilizer use cases, especially where fertigation, foliar application, and specialty crop nutrition are gaining importance beyond conventional bulk fertilizer use.
- Rashtriya Chemicals & Fertilizers Ltd., 2025:
RCF commissioned its Nano Urea plant at Trombay on 4 February 2025, bringing a new nano-fertilizer production unit into operation. This is an important India fertilizers market development because it expands domestic supply of advanced nitrogen fertilizer technology and supports the shift toward more efficient nutrient application with lower dependence on conventional urea.
Frequently Asked Questions
Related Report
- Market Segmentation
- Research Scope
- Research Methodology
- Definitions and Assumptions
- Executive Summary
- India Fertilizers Market Policies, Regulations, and Standards
- India Fertilizers Market Dynamics
- Growth Factors
- Challenges
- Trends
- Opportunities
- India Fertilizers Market Statistics, 2022-2032F
- Market Size & Growth Outlook
- By Revenues in USD Million
- Market Segmentation & Growth Outlook
- By Product Type
- Straight Fertilizers- Market Insights and Forecast 2022-2032, USD Million
- Nitrogenous- Market Insights and Forecast 2022-2032, USD Million
- Phosphatic- Market Insights and Forecast 2022-2032, USD Million
- Potassic- Market Insights and Forecast 2022-2032, USD Million
- Complex/Compound Fertilizers- Market Insights and Forecast 2022-2032, USD Million
- NP- Market Insights and Forecast 2022-2032, USD Million
- PK- Market Insights and Forecast 2022-2032, USD Million
- NPK- Market Insights and Forecast 2022-2032, USD Million
- Secondary Nutrient Fertilizers- Market Insights and Forecast 2022-2032, USD Million
- Micronutrient Fertilizers- Market Insights and Forecast 2022-2032, USD Million
- Organic & Biofertilizers- Market Insights and Forecast 2022-2032, USD Million
- Straight Fertilizers- Market Insights and Forecast 2022-2032, USD Million
- By Form
- Conventional Fertilizers- Market Insights and Forecast 2022-2032, USD Million
- Specialty Fertilizers- Market Insights and Forecast 2022-2032, USD Million
- By Application Method
- Soil Application- Market Insights and Forecast 2022-2032, USD Million
- Fertigation- Market Insights and Forecast 2022-2032, USD Million
- Foliar Application- Market Insights and Forecast 2022-2032, USD Million
- By Application Timing
- Basal/Pre-plant- Market Insights and Forecast 2022-2032, USD Million
- At-planting/Starter- Market Insights and Forecast 2022-2032, USD Million
- In-season/Top-dress- Market Insights and Forecast 2022-2032, USD Million
- Post-harvest/Soil-conditioning- Market Insights and Forecast 2022-2032, USD Million
- By Crop Type
- Cereals & Grains- Market Insights and Forecast 2022-2032, USD Million
- Oilseeds & Pulses- Market Insights and Forecast 2022-2032, USD Million
- Fruits & Vegetables- Market Insights and Forecast 2022-2032, USD Million
- Plantation & Commercial Crops- Market Insights and Forecast 2022-2032, USD Million
- Turf & Ornamentals- Market Insights and Forecast 2022-2032, USD Million
- Other Crops- Market Insights and Forecast 2022-2032, USD Million
- By End User
- Commercial Farms- Market Insights and Forecast 2022-2032, USD Million
- Smallholder Farms- Market Insights and Forecast 2022-2032, USD Million
- Protected Cultivation Growers- Market Insights and Forecast 2022-2032, USD Million
- Institutional/Landscape Users- Market Insights and Forecast 2022-2032, USD Million
- Household/Retail Gardeners- Market Insights and Forecast 2022-2032, USD Million
- By Distribution Channel
- Retail Offline- Market Insights and Forecast 2022-2032, USD Million
- Distributor/Dealer Network- Market Insights and Forecast 2022-2032, USD Million
- Cooperatives/Agri-input Retailers- Market Insights and Forecast 2022-2032, USD Million
- Retail Online- Market Insights and Forecast 2022-2032, USD Million
- Online/E-commerce Retail- Market Insights and Forecast 2022-2032, USD Million
- Non-Retail/Direct- Market Insights and Forecast 2022-2032, USD Million
- Direct Sales- Market Insights and Forecast 2022-2032, USD Million
- Institutional/Tender-based Sales- Market Insights and Forecast 2022-2032, USD Million
- Retail Offline- Market Insights and Forecast 2022-2032, USD Million
- By Region
- North India
- Uttar Pradesh
- Punjab
- Haryana
- Rajasthan
- West India
- Maharashtra
- Gujarat
- East India
- West Bengal
- Bihar
- Odisha
- South India
- Andhra Pradesh
- Telangana
- Karnataka
- Tamil Nadu
- Central India
- Madhya Pradesh
- Chhattisgarh
- North India
- By Competitors
- Competition Characteristics
- Market Share & Analysis
- By Product Type
- Market Size & Growth Outlook
- India Straight Fertilizers Market Statistics, 2022-2032
- Market Size & Growth Outlook
- By Revenues in USD Million
- Market Segmentation & Growth Outlook
- By Form- Market Insights and Forecast 2022-2032, USD Million
- By Application Method- Market Insights and Forecast 2022-2032, USD Million
- By Application Timing- Market Insights and Forecast 2022-2032, USD Million
- By Crop Type- Market Insights and Forecast 2022-2032, USD Million
- By End User- Market Insights and Forecast 2022-2032, USD Million
- By Distribution Channel- Market Insights and Forecast 2022-2032, USD Million
- By Region- Market Insights and Forecast 2022-2032, USD Million
- Market Size & Growth Outlook
- India Complex/Compound Fertilizers Market Statistics, 2022-2032
- Market Size & Growth Outlook
- By Revenues in USD Million
- Market Segmentation & Growth Outlook
- By Form- Market Insights and Forecast 2022-2032, USD Million
- By Application Method- Market Insights and Forecast 2022-2032, USD Million
- By Application Timing- Market Insights and Forecast 2022-2032, USD Million
- By Crop Type- Market Insights and Forecast 2022-2032, USD Million
- By End User- Market Insights and Forecast 2022-2032, USD Million
- By Distribution Channel- Market Insights and Forecast 2022-2032, USD Million
- By Region- Market Insights and Forecast 2022-2032, USD Million
- Market Size & Growth Outlook
- India Secondary Nutrient Fertilizers Market Statistics, 2022-2032
- Market Size & Growth Outlook
- By Revenues in USD Million
- Market Segmentation & Growth Outlook
- By Form- Market Insights and Forecast 2022-2032, USD Million
- By Application Method- Market Insights and Forecast 2022-2032, USD Million
- By Application Timing- Market Insights and Forecast 2022-2032, USD Million
- By Crop Type- Market Insights and Forecast 2022-2032, USD Million
- By End User- Market Insights and Forecast 2022-2032, USD Million
- By Distribution Channel- Market Insights and Forecast 2022-2032, USD Million
- By Region- Market Insights and Forecast 2022-2032, USD Million
- Market Size & Growth Outlook
- India Micronutrient Fertilizers Market Statistics, 2022-2032
- Market Size & Growth Outlook
- By Revenues in USD Million
- Market Segmentation & Growth Outlook
- By Form- Market Insights and Forecast 2022-2032, USD Million
- By Application Method- Market Insights and Forecast 2022-2032, USD Million
- By Application Timing- Market Insights and Forecast 2022-2032, USD Million
- By Crop Type- Market Insights and Forecast 2022-2032, USD Million
- By End User- Market Insights and Forecast 2022-2032, USD Million
- By Distribution Channel- Market Insights and Forecast 2022-2032, USD Million
- By Region- Market Insights and Forecast 2022-2032, USD Million
- Market Size & Growth Outlook
- India Organic & Biofertilizers Market Statistics, 2022-2032
- Market Size & Growth Outlook
- By Revenues in USD Million
- Market Segmentation & Growth Outlook
- By Form- Market Insights and Forecast 2022-2032, USD Million
- By Application Method- Market Insights and Forecast 2022-2032, USD Million
- By Application Timing- Market Insights and Forecast 2022-2032, USD Million
- By Crop Type- Market Insights and Forecast 2022-2032, USD Million
- By End User- Market Insights and Forecast 2022-2032, USD Million
- By Distribution Channel- Market Insights and Forecast 2022-2032, USD Million
- By Region- Market Insights and Forecast 2022-2032, USD Million
- Market Size & Growth Outlook
- Competitive Outlook
- Company Profiles
- Coromandel International Ltd.
- Business Description
- Product Portfolio
- Collaborations & Alliances
- Recent Developments
- Financial Details
- Others
- Indian Farmers Fertiliser Cooperative Ltd. (IFFCO)
- Business Description
- Product Portfolio
- Collaborations & Alliances
- Recent Developments
- Financial Details
- Others
- Mahadhan AgriTech Ltd.
- Business Description
- Product Portfolio
- Collaborations & Alliances
- Recent Developments
- Financial Details
- Others
- Gujarat Narmada Valley Fertilizers & Chemicals Ltd. (GNFC)
- Business Description
- Product Portfolio
- Collaborations & Alliances
- Recent Developments
- Financial Details
- Others
- Paradeep Phosphates Ltd.
- Business Description
- Product Portfolio
- Collaborations & Alliances
- Recent Developments
- Financial Details
- Others
- Indian Potash Limited (IPL)
- Business Description
- Product Portfolio
- Collaborations & Alliances
- Recent Developments
- Financial Details
- Others
- Rama Phosphates Limited
- Business Description
- Product Portfolio
- Collaborations & Alliances
- Recent Developments
- Financial Details
- Others
- DCM Shriram Ltd.
- Business Description
- Product Portfolio
- Collaborations & Alliances
- Recent Developments
- Financial Details
- Others
- Gujarat State Fertilizers & Chemicals Ltd. (GSFC)
- Business Description
- Product Portfolio
- Collaborations & Alliances
- Recent Developments
- Financial Details
- Others
- ICL Fertilizers (India) Pvt. Ltd.
- Business Description
- Product Portfolio
- Collaborations & Alliances
- Recent Developments
- Financial Details
- Others
- K+S Fertilizers (India) Pvt. Ltd.
- Business Description
- Product Portfolio
- Collaborations & Alliances
- Recent Developments
- Financial Details
- Others
- Indian Phosphate Limited
- Business Description
- Product Portfolio
- Collaborations & Alliances
- Recent Developments
- Financial Details
- Others
- Narmada Bio-chem Limited
- Business Description
- Product Portfolio
- Collaborations & Alliances
- Recent Developments
- Financial Details
- Others
- Gencrest Bio-products Pvt. Ltd.
- Business Description
- Product Portfolio
- Collaborations & Alliances
- Recent Developments
- Financial Details
- Others
- Rashtriya Chemicals and Fertilizers Ltd. (RCF)
- Business Description
- Product Portfolio
- Collaborations & Alliances
- Recent Developments
- Financial Details
- Others
- Coromandel International Ltd.
- Company Profiles
- Disclaimer
| Segment | Sub-Segment |
|---|---|
| By Product Type |
|
| By Form |
|
| By Application Method |
|
| By Application Timing |
|
| By Crop Type |
|
| By End User |
|
| By Distribution Channel |
|
| By Region |
|
Research Methodology
This study followed a structured approach comprising four key phases to assess the size and scope of the electro-oxidation market. The process began with thorough secondary research to collect data on the target market, related markets, and broader industry context. These findings, along with preliminary assumptions and estimates, were then validated through extensive primary research involving industry experts from across the value chain. To calculate the overall market size, both top-down and bottom-up methodologies were employed. Finally, market segmentation and data triangulation techniques were applied to refine and validate segment-level estimations.
Secondary Research
The secondary research phase involved gathering data from a wide range of credible and published sources. This step helped in identifying industry trends, defining market segmentation, and understanding the market landscape and value chain.
Sources consulted during this phase included:
- Company annual reports, investor presentations, and press releases
- Industry white papers and certified publications
- Trade directories and market-recognized databases
- Articles from authoritative authors and reputable journals
- Gold and silver standard websites
Secondary research was critical in mapping out the industry's value chain and monetary flow, identifying key market segments, understanding regional variations, and tracking significant industry developments.
Other key sources:
- Financial disclosures
- Industry associations and trade bodies
- News outlets and business magazines
- Academic journals and research studies
- Paid industry databases
Primary Research
To validate secondary data and gain deeper market insights, primary research was conducted with key stakeholders across both the supply and demand sides of the market.
On the demand side, participants included decision-makers and influencers from end-user industries—such as CIOs, CTOs, and CSOs—who provided first-hand perspectives on market needs, product usage, and future expectations.
On the supply side, interviews were conducted with manufacturers, industry associations, and institutional participants to gather insights into current offerings, product pipelines, and market challenges.
Primary interviews provided critical inputs such as:
- Market size and revenue data
- Product and service breakdowns
- Market forecasts
- Regional and application-specific trends
Stakeholders consulted included:
- Leading OEM and solution providers
- Channel and distribution partners
- End users across various applications
- Independent consultants and industry specialists
Market Size Estimation and Data Triangulation
- Identifying Key Market Participants (Secondary Research)
- Goal: To identify the major players or companies in the target market. This typically involves using publicly available data sources such as industry reports, market research publications, and financial statements of companies.
- Tools: Reports from firms like Gartner, Forrester, Euromonitor, Statista, IBISWorld, and others. Public financial statements, news articles, and press releases from top market players.
- Extracting Earnings of Key Market Participants
- Goal: To estimate the earnings generated from the product or service being analyzed. This step helps in understanding the revenue potential of each market player in a specific geography.
- Methods: Earnings data can be gathered from:
- Publicly available financial reports (for listed companies).
- Interviews and primary data sources from professionals, such as Directors, VPs, SVPs, etc. This is especially useful for understanding more nuanced, internal data that isn't publicly disclosed.
- Annual reports and investor presentations of key players.
- Data Collation and Development of a Relevant Data Model
- Goal: To collate inputs from both primary and secondary sources into a structured, data-driven model for market estimation. This model will incorporate key market KPIs and any independent variables relevant to the market.
- Key KPIs: These could include:
- Market size, growth rate, and demand drivers.
- Industry-specific metrics like market share, average revenue per customer (ARPC), or average deal size.
- External variables, such as economic growth rates, inflation rates, or commodity prices, that could affect the market.
- Data Modeling: Based on this data, the market forecasts are developed for the next 5 years. A combination of trend analysis, scenario modeling, and statistical regression might be used to generate projections.
- Scenario Analysis
- Goal: To test different assumptions and validate how sensitive the market is to changes in key variables (e.g., market demand, regulatory changes, technological disruptions).
- Types of Scenarios:
- Base Case: Based on current assumptions and historical data.
- Best-Case Scenario: Assuming favorable market conditions, regulatory environments, and technological advancements.
- Worst-Case Scenario: Accounting for adverse factors, such as economic downturns, stricter regulations, or unexpected disruptions.


